The KMOS3D Survey: rotating compact star forming galaxies
and the decomposition of integrated line widths ††\dagger††\daggerBased on observations obtained at the Very Large Telescope (VLT) of the European Southern Observatory (ESO), Paranal, Chile (ESO program IDs 092A-0091, 093.A-0079, 094.A-0217,095.A-0047, 096.A-0025, and 097.A-0028, 098.A-0045
Abstract
Using integral field spectroscopy we investigate the kinematic properties of 35 massive centrally-dense and compact star-forming galaxies (, , ) at within the KMOS3D survey. We spatially resolve 23 compact star-forming galaxies (SFGs) and find that the majority are dominated by rotational motions with velocities ranging from km s-1.
The range of rotation velocities is reflected in a similar range of integrated H linewidths, km s-1, consistent with the kinematic properties of mass-matched extended galaxies from the full KMOS3D sample. The fraction of compact SFGs that are classified as ‘rotation-dominated’ or ‘disk-like’ also mirrors the fractions of the full KMOS3D sample. We show that integrated line-of-sight gas velocity dispersions from KMOS3D are best approximated by a linear combination of their rotation and turbulent velocities with a lesser but still significant contribution from galactic scale winds. The H exponential disk sizes of compact SFGs are on average kpc, the continuum sizes, in agreement with previous work. The compact SFGs have a higher AGN incidence than the full KMOS3D sample at fixed stellar mass with average AGN fraction of 76%. Given their high and centrally concentrated stellar masses as well as stellar to dynamical mass ratios close to unity, the compact SFGs are likely to have low molecular gas fractions and to quench on a short time scale unless replenished with inflowing gas. The rotation in these compact systems suggests that their direct descendants are rotating passive galaxies.
Subject headings:
galaxies: evolution galaxies: high-redshift galaxies: kinematics and dynamics infrared: galaxies12 March 2018
1. Introduction
The transformation of a star-forming galaxy (SFG) into a passive galaxy is a key process in galaxy evolution. Yet the details of how SFGs are quenched are mostly unknown, particularly in the early universe. Studies of the high-redshift galaxy population have shown that quiescent galaxies at are much more compact than their local counterparts (e.g., van Dokkum et al. 2008; Trujillo et al. 2007; Damjanov et al. 2009; Newman et al. 2012). Their small sizes suggest that they were either created from larger SFGs through highly dissipative processes or formed from already compact SFGs. These different formation histories imply different quenching mechanisms.
There are many well supported candidates for quenching e.g. environment, mass and evidence that different mechanisms act in tandem (e.g. Toomre & Toomre 1972; Mihos & Hernquist 1994; Peng et al. 2010; Hopkins et al. 2010; Fossati et al. 2017). However because the transition of individual galaxies from star forming to passive can be rapid (Balogh et al., 2004; Martin et al., 2007) it is particularly difficult to observe individual cases. Instead, progress in understanding the cessation of star formation typically comes from studies of statistical samples where comparisons can be drawn between the global properties of star-forming and passive galaxy populations. Global properties, e.g. color, structural properties, size-mass, star formation rate-mass, often show a bimodality with a small number of galaxies creating a bridge between the star-forming and passive populations. The galaxies in between may represent an interesting class of galaxies currently undergoing a transformation.
In recent years, observational studies have shown that the quenching of star-formation is intimately linked to the formation of a bulge (e.g. Bluck et al. 2014; Lang et al. 2014), lending support to an association between early-type morphology and quiescence. Galaxies in transition are expected to change their morphologies prior to quenching, stimulated for example by interactions with other galaxies or their environments (e.g. Toomre & Toomre 1972; Mihos & Hernquist 1994; Naab & Burkert 2003). Major mergers can drive the formation of spheroids either directly or by triggering massive central starbursts (Hopkins et al., 2010), however internal disk instabilities, either secular or merger-induced, are also expected to drive efficient radial inflows that can lead to a build up of central stellar mass density (Bournaud et al., 2007; Dekel & Burkert, 2014; Brennan et al., 2015).
The same mechanisms are expected as possible pathways from star-forming to quiescence in the early universe. In high-redshift disks violent internal instabilities and gas-rich mergers could lead to dissipative processes able to form a massive, compact bulge that can either exhaust the available gas or stabilize it against further collapse (Martig et al., 2009; Dekel & Burkert, 2014; Genzel et al., 2014b; Zolotov et al., 2015). In such a scenario, star formation is expected to wind down on Gyr timescales, resulting in young, quenched spheroids (Dekel & Burkert, 2014; Barro et al., 2014a).
Some models have shown that prior to being quenched galaxies exist in a compact-core or dense phase for a short time while still hosting significant star formation (Dekel & Burkert, 2014; Wellons et al., 2015; Tacchella et al., 2016). These galaxies, while rare, have been increasingly identified in large data sets that have become available from both observations (e.g. CANDELS; Grogin et al. 2011; Koekemoer et al. 2011) and simulations (e.g. EAGLE: Schaye et al. 2015; Crain et al. 2015; ILLUSTRIS: Vogelsberger et al. 2014; Genel et al. 2014). Thus, these ‘compact star-forming galaxies’ are possible immediate progenitors to distant compact quiescent galaxies. Observationally they are dense and compact ( kpc; Barro et al. 2013, 2014a; Nelson et al. 2014), dusty (van Dokkum et al., 2015), and despite often being branded as ‘blue nuggets’, to have red colors (Barro et al., 2013). While such characteristics are in line with expectations from ‘wet compaction’, there is also observational support for the scenario in which compact SFGs grow inside-out from already compact higher redshift progenitors (van Dokkum et al., 2015; Wellons et al., 2015).
While the sizes, colors, and star formation rates (SFRs) of these possible progenitors are well characterized, the dynamics of these systems are still being pieced together. Due to their small sizes, obtaining resolved dynamical information has been difficult (Barro et al., 2014b; Nelson et al., 2014; van Dokkum et al., 2015). Given their high central masses it is predicted that these objects will also have high central velocity dispersions both in gas and stars (Bell et al., 2012; Wake et al., 2012; Fang et al., 2013; Bezanson et al., 2015; van Dokkum et al., 2015; Beifiori et al., 2017), further linking them to quiescent galaxies at similar redshifts (van de Sande et al., 2013; Belli et al., 2014). Indeed, the first spectral measurements of compact SFGs at have revealed large integrated gas velocity dispersions, km s-1 (Barro et al., 2014b; Nelson et al., 2014), comparable to stellar velocity dispersions of massive quiescent galaxies at similar redshifts. However, to what extent rotation, dispersion, and galactic winds contribute to the integrated linewidths is unknown, thus making use of the integrated linewidth as a dynamical mass indicator highly uncertain.
The past 15 years have revealed that massive quiescent galaxies in the local Universe feature a mixture of kinematic signatures, defined by both rotation and pressure support (e.g. Emsellem et al. 2007, 2011; Cappellari et al. 2011). Given these results and the prevalence of massive high-redshift disk galaxies with prominent bulges (e.g. Lang et al. 2014) it is highly likely that at least a fraction of high-redshift quiescent galaxies and their progenitors also show disk-like morphologies and/or axial ratio distributions. Imaging studies lend credence to this hypothesis with 65% of compact quiescent galaxies showing disk-like morphologies (van der Wel et al., 2011; Chang et al., 2013). Furthermore, stellar rotation km s-1 has now been measured directly in 2 fortuitously strongly lensed quiescent galaxies (Newman et al., 2015; Toft et al., 2017). Recent long- and multi-slit results of possible progenitors to compact quiescent galaxies have also shown evidence for rotation-dominated kinematics (van Dokkum et al., 2015).
An additional factor that may contribute to the shut-down of star-formation in these systems is the role of active galactic nuclei (AGN) and AGN feedback (Croton et al., 2006; Bower et al., 2006). Compact SFGs are preferentially massive, thus high AGN fractions are expected (e.g. Kauffmann et al. 2003b; Reddy et al. 2005; Brusa et al. 2009). This is reflected in modern simulations where the black hole accretion rate is tied to the the density of the surrounding gas (Wellons et al., 2015). The observational signatures of AGN and AGN-driven outflows are commonly seen in the kinematics of high-redshift galaxies and increasingly prevalent at the massive end of the star-forming ‘main sequence’ (e.g. Shapiro et al. 2009; Alexander et al. 2010; Förster Schreiber et al. 2014; Genzel et al. 2014a, Förster Schreiber et al. in prep).
Here we exploit the 3D information and depth of our KMOS3D survey (Wisnioski et al. 2015; hereafter W15), to take the next step in addressing the kinematic nature of compact SFGs, set quantitative constraints on the processes driving their emission line widths, and shed new light on the connection to compact quiescent galaxies at similar redshifts.
We present the first integral field spectroscopic observations of 35 compact dense-core SFGs. In Section 2 we discuss selection techniques of compact and dense galaxies. In Section 3 we present our resolved KMOS3D results and investigate kinematic tracers of the potential using the rotational velocity and integrated linewidths. In Section 4 we discuss the implications of our results on the possible evolutionary pathways for both creating and evolving compact SFGs. We conclude our results in Section 5. We assume a CDM cosmology with km s-1 Mpc-1, , and . For this cosmology, corresponds to kpc at , kpc at and kpc at . We adopt a Chabrier (2003) initial mass function.
2. Data
2.1. KMOS observations and data analysis
KMOS3D is an ongoing kinematic survey using the K-band Multi-Object Spectrograph (KMOS; Sharples et al., 2013) to obtain near-infrared (IR) integral field spectroscopy covering the [N II]+H emission line complex at . Targets were selected from the 3D-HST Legacy Survey (Skelton et al., 2014; Brammer et al., 2012; Momcheva et al., 2016) and CANDELS (Grogin et al., 2011; Koekemoer et al., 2011) in COSMOS, GOODS-S, and UDS, and the primary sample includes galaxies with and a prior redshift (3D-HST) that places H in a region of the spectrum relatively free of contamination from OH sky lines. In addition, we also include data covering [O III]+H for narrow-band selected galaxies extending up to also observed in KMOS3D pointings.
The KMOS3D sample includes galaxies spanning more than 4 orders of magnitude in specific star formation rate (sSFR) because the target selection does not include any a priori information on SFR. In this work we identify SFGs based on their positions relative to the main sequence such that , where SFRMS is defined by the 3D-HST main sequence (MS; Whitaker et al. 2014) for each galaxy given its redshift and stellar mass using the parameterization of W15. SFRs are derived combining the unobscured (UV) and obscured (IR) star formation following Wuyts et al. (2011b) or from the spectral energy distribution (SED) if there is no IR detection. We note that the adopted cut between star-forming and passive galaxies for this paper is similar to an evolving selection; however, for the purposes of investigating possible progenitors of quenched galaxies we do not want to rule-out galaxies with passive colors that have residual star-formation (Barro et al., 2013; Belli et al., 2017b).
Full details of the KMOS3D observing conditions, observing strategy, and data reduction procedure are given in W15 and a forthcoming data release paper. Relevant details for this work are described briefly in the following paragraphs.
Observations of KMOS3D data used here have been carried out between October 2013 and September 2017 with exposure times ranging from 3–30 hours on source. Data was collected in excellent seeing conditions, , , or band median seeing FWHM 0.55′′. The model-independent seeing is measured as the FWHM from stars observed simultaneously in the same waveband and same detector as the galaxy observations. For the compact sources discussed in greater detail in this paper the median seeing was 0.5′′ with individual values ranging from .
We map the kinematics across the emission-line detected regions of the galaxy using single Gaussian fits after applying a pixel spatial median filter. The median filtering is used only to create the kinematic map. Integrated spectra and 1D kinematic extractions are extracted directly from the original data cube. The kinematic axis is determined from the 2D velocity field as the direction of the largest observed velocity difference. One-dimensional kinematic profiles are extracted along the kinematic major axis using an aperture equivalent to the PSF, unique to each galaxy. When a kinematic axis cannot be determined from the 2D velocity field the photometric major axis is used for the 1D extractions. Galaxies are considered resolved when emission lines can be fit to a radius of 1.5 the PSF FWHM from the center of the continuum emission. The 1D kinematic profiles allow measurements slightly beyond the extent of individual spaxels as they are measured from summed spectra within an aperture. In resolved cases we derive an estimate of the observed velocity difference along the kinematic major axis, , rotational velocity, , and disk velocity dispersion, . We estimate using the HST -band (F160W) structural axis ratio () assuming a thick disk with ratio of scale height to scale length of 0.25. Structural parameters are drawn from Lang et al. (2014) based on single component GALFIT (Peng et al., 2002) models (see also van der Wel et al. 2014). We derive integrated spectra for all KMOS3D galaxies by summing over spaxels within a 1.5 diameter aperture. The velocity gradients are not removed from these spectra. Good spaxel masks are created for resolved galaxies. They include spaxels where the S/N of H or [O III] is , velocity uncertainties of km s-1, and/or a relative velocity dispersion uncertainty of %.
KMOS observations are seeing limited and subject to beam smearing. Beam smearing corrections used to calculate the corrected rotational velocity, , and disk velocity dispersion, , are derived following the methods in Appendix A.2.4 of Burkert et al. (2016). In short, multiplicative beam smearing corrections are derived from a set of exponential disk dynamical models run at different inclinations, masses, ratios of half-light size to PSF size, velocity dispersions, and instrumental resolutions. To determine a beam smearing correction for an individual galaxy a relation relating the ratios of half-light size / PSF size to the magnitude of the beam smearing correction is queried based on the properties of the specific galaxy and observed PSF. The typical magnitude of the beam smearing corrections for the compact sources discussed here is discussed at the end of Section 3.3. For a more detailed description of the methods used to derive the kinematic maps and subsequent parameters we refer the reader to W15 and Appendix A of Burkert et al. (2016).
2.2. Compact galaxy selection
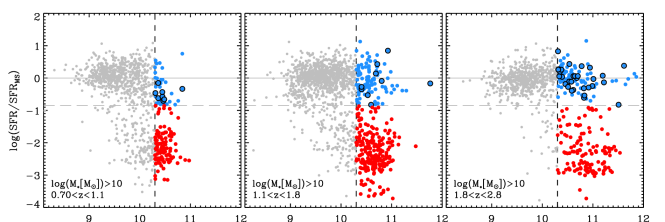
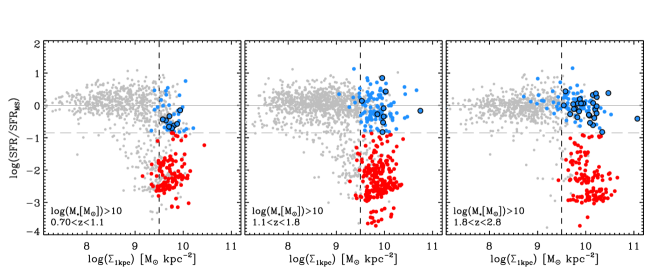
Our selection of compact galaxies relies primarily on two parameters: the global compactness (), where is the HST -band (F160W) circularized half-light size (Barro et al., 2013), and the stellar surface density within the central 1 kpc, . We compute by integrating over the deprojected luminosity density distribution as described by van Dokkum et al. (2014). We additionally require that compact galaxies are massive, M⊙. Figure 1 shows the distribution of KMOS3D galaxies in terms of their star-formation rate, compactness (top panels) and central density (bottom panels) in three redshift ranges corresponding to the KMOS YJ, H, and K bands.
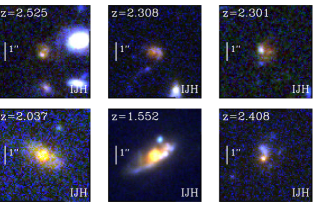
While selecting on global compactness identifies galaxies morphologically similar to compact quiescent galaxies (axis ratios of approximately unity and small sizes; kpc), selecting on central density identifies galaxies with a variety of sizes and axial ratios but with the presence of a dense stellar core, often seen as a requirement for quenching (e.g. Cheung et al. 2012; Lang et al. 2014; Bluck et al. 2014; van Dokkum et al. 2014). In all panels of Figure 1 the blue points show the SFGs selected on global compactness using (Barro et al., 2013). Their location in the bottom panels shows the overlap between what would be selected as compact rather than as containing a dense core using . Galaxies observed in KMOS3D are identified by black open circles in the top panels. Figure 2 shows examples of the types of galaxies selected by these two different criteria separately. While the galaxies in the top 3 panels are compact, they do not closely resemble quiescent galaxies at , which is a key motivation to study the compact SFGs. In contrast, the bottom three panels show galaxies with bulge components reminiscent of quiescent galaxies surrounded by large blue disks. We adopt as our final ‘compact’ sample those galaxies satisfying the global compactness and central density criteria ( and ).
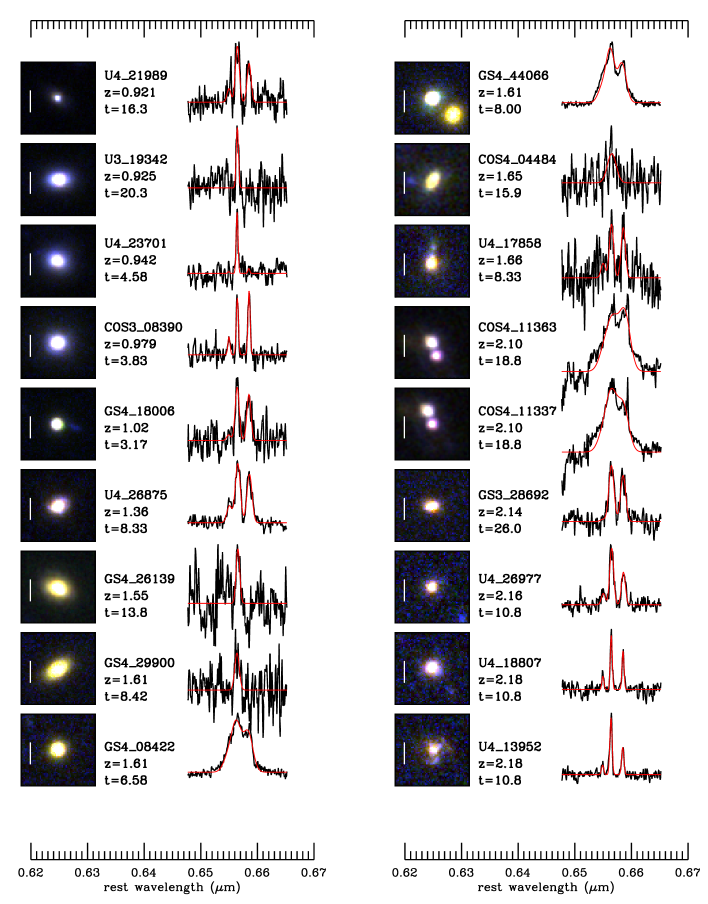
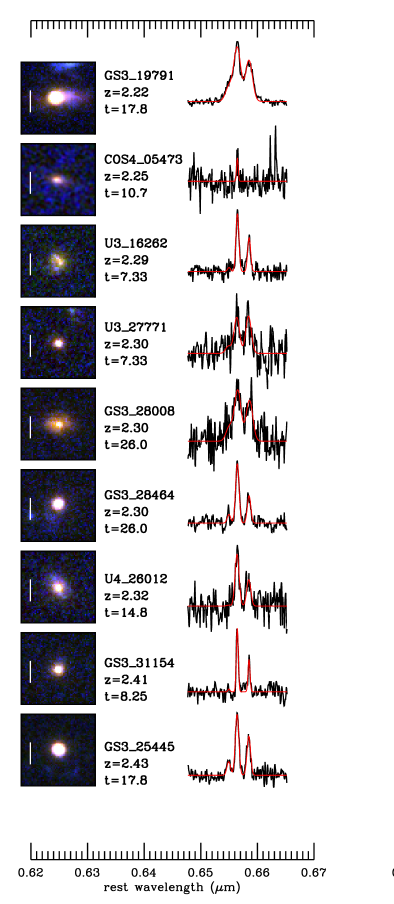
Of the 502 ‘star-forming’ galaxies, , in our KMOS3D sample (as of December 2016), 45 satisfy both the compactness and central density criteria, 35 of which are detected, spanning the redshift range , including both H(33) and [O III](2) detected galaxies. The composite HST images, integrated spectra, and exposure times for these objects are shown in Figure 3, ordered by increasing redshift. Integrated spectra for each galaxy are created by summing the spaxels in a 1.5” diameter aperture. Single component Gaussian fits are over-plotted in red.
The average half-light radius, Sérsic index, axis ratio, and bulge-to-total (B/T) of the detected compact SFGs are 1.85 kpc, 3.9, 0.72, and 0.5 respectively, compared to 1.36 kpc, 3.7, 0.65, and 0.7 for compact quiescent galaxies select using the same criteria. However, we note that some of these galaxies are close to the resolution limit of HST in the -band resulting in large uncertainties in structural parameters not included in the formal errors. For example, of the 35 detected galaxies 6 have unconstrained Sérsic indices of either 0.2 or 8.0, the limits of the fitting range. We note that 3 of the 6 are Type-I AGN as discussed in the next section.
Ten of the detected compact SFGs have rest-frame colors consistent with being passive using a color selection (e.g Muzzin et al. 2013). In addition to the compact SFG sample, we robustly detect H in 15 compact quiescent galaxies (QG; ), of which two are resolved. The properties of H detected quiescent galaxies are discussed in Belli et al. (2017b).
We find 76% of the detected compact SFGs may host an active galactic nucleus (AGN). In the general SFG population, AGN incidence is a strong function of stellar mass (e.g. Kauffmann et al. 2003b). In addition to optical indicators, this has also been shown using ultra-violet, infrared, and X-ray indicators (e.g. Best et al. 2005; Bundy et al. 2008). Combining X-ray, IR, and radio data confirm that the high mass galaxies, and in particular the compact dense galaxies in KMOS3D have high AGN fractions, as also shown by Barro et al. (2013) and Kocevski et al. (2017). Using techniques described in Genzel et al. (2014a) to identify likely AGN hosts we recover this trend in our full observed sample.
![[Uncaptioned image]](/html/1711.02111/assets/x6.png)
![[Uncaptioned image]](/html/1711.02111/assets/x7.png)
![[Uncaptioned image]](/html/1711.02111/assets/x8.png)
![[Uncaptioned image]](/html/1711.02111/assets/x9.png)
In concordance, nuclear activity is prevalent in the KMOS3D high-mass galaxies as determined from high [N II]/H ratios (([N II]/H)) and the presence of an underlying broad H emission component (Genzel et al. 2014a, Förster Schreiber et al. in prep). These results are consistent with the rapid increase of outflow incidence as a function of stellar mass as shown in our previous studies (Förster Schreiber et al., 2014; Genzel et al., 2014a) and updated with approximately 5 larger sample (Förster Schreiber et al. in prep), as well as with general trends with increasing central stellar mass density. We find that 45% of all observed KMOS3D SFGs exhibit high [N II]/H or a broad component in stellar mass range . Dense compact galaxies are among the most massive KMOS3D galaxies, by selection, and show higher fractions of spectral signatures of nuclear activity than the full population, with 55% in the same mass range. When taking into account all five AGN indicators from Genzel et al. (2014a) for the full KMOS3D sample in stellar mass range the AGN fraction is 53% compared to 76% for dense compact SFGs.
Fitting a single Gaussian to the spectrum of a galaxy hosting a outflow can result in an artificially larger linewidth with the strongest effect most likely to occur for shallow data strongly light-weighted by bright central regions where the presence of a centrally driven wind can dominate (Förster Schreiber et al., 2014; Genzel et al., 2014a). This effect is investigated further in Section 3.4.
Three compact SFGs are possible Type-I AGN as indicated from the combination of KMOS spectra, X-ray, and rest UV data, two of which have km s-1 from a single Gaussian fit to the KMOS data. The HST images of these three galaxies, COS4_14596, COS4_21492, and GS4_09075, exhibit characteristics of the PSF such as diffraction spikes and spots. We exclude these objects from our further analysis of the integrated linewidth and emission line ratios.
3. Results
3.1. H sizes
We measured intrinsic H or [O III] sizes for galaxies in our compact SFG sample by fitting a pure exponential disk profile convolved with the KMOS PSF to two-dimensional KMOS emission maps, with the centroid, ellipticity, and PA fixed to that of the continuum map in the HST F160W band (Erwin, 2015). The flux in individual spaxels was estimated by integrating the continuum-subtracted spectrum within a km s-1 window centered on the expected wavelength of the emission line, derived either from a single-component Gaussian fit to the line or, in the case of low-S/N regions, the nearest spaxel with a successful fit. In this way, we were able to derive emission maps extending over the full KMOS field of view. For each galaxy we construct a model of the KMOS PSF by stacking registered images of individual PSF stars taken in the same exposure and detector. We note that, due to uncertainties in the relative position of KMOS arms (0.2 arcsec r.m.s) this procedure likely underestimates the ”true” PSF FWHM, however we do not expect it to significantly affect our conclusions. Uncertainties on the sizes were estimated from bootstrap realizations of the combined KMOS data, where individual 300s exposures were randomly recombined with replacement. Further details of the modeling procedure will be described in a future paper (Wilman et al. in prep.).
The average intrinsic H half-light size of the compact SFGs is kpc. The H sizes are typically between the continuum sizes as measured from single Sérsic fits to the CANDELS F160W images, with 33% agreeing with a size ratio of unity within 1 errors. The average size ratio, , is 1.2 but ranges between 0.7 and 4.1. The size ratios are consistent with size ratios found for the most massive galaxies in the 3D-HST survey at (Nelson et al., 2016) and the H sizes of the KMOS3D compact SFGs are comparable to those derived from position-velocity diagrams of long- and multi-slit observations of compact SFGs van Dokkum et al. (2015).
H sizes also show good agreement with the rest-frame emission as probed by the observed -band distribution at these redshifts. Some compact SFGs in our sample do exhibit faint emission in the - and -bands as seen in the composite images of Figure 3 with either asymmetric emission around the dominant -band light (e.g. U4_17858 and COS4_22995) or extended emission reminiscent of a faint disk or spiral features (e.g. GS3_19791 and U4_26012). The galaxies with visible features in the -band are among the galaxies with the largest H sizes. In contrast, some simulations predict faint outer disks or rings surrounding compact SFGs (Zolotov et al., 2015). Galaxies in the KMOS3D sample which do fit the description of centrally dense cores surrounded by large ( kpc) star-forming rings are the extended centrally dense galaxies shown in the bottom panels of Figure 2.
3.2. Compact SFG un-resolved kinematics
For all detected compact SFGs we measure an integrated linewidth, , from single Gaussian fits to the H-[N II] or [O III] complex of the non-velocity shifted integrated spectrum and correct for spectral resolution. The linewidths of compact SFGs cover a wide range, km s-1. In Figure 4 we show the relationship between H velocity dispersion and stellar mass for extended and compact SFGs from KMOS3D. Compact SFGs from the literature are shown by green diamonds (van Dokkum et al., 2015; Barro et al., 2014b). We also compare our results to a complementary quiescent galaxy field survey with KMOS, the VLT IR IFU Absorption Line survey (VIRIAL; Mendel et al. 2015; in prep). VIRIAL targets are are passive galaxies selected from the 3D-HST survey. The velocity dispersions for the VIRIAL survey are measured from absorption lines of unresolved compact galaxies. Under the assumption that the majority of our sample is rotating we apply a simple correction to all KMOS3D galaxies to account for inclination effects (In W15 we show that 83% of SFGs at these epochs are rotationally-supported). In contrast, we do not apply a correction to the passive galaxy sample which we restrict to systems with (Belli et al., 2017a).
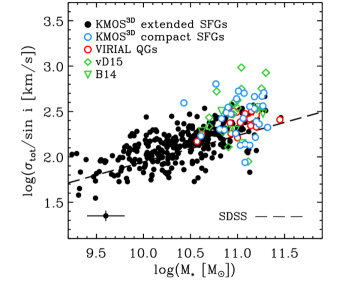
Figure 4 shows that the compact SFGs form the high-mass end of the trend established from the general SFG population. The linewidths of compact SFGs are consistent with the linewidths of extended SFGs from the KMOS3D survey of similar mass and redshift. Compact SFGs from the literature overlap but on average have slightly larger linewidths for their mass than when compared to the KMOS3D data. This may be a result of selection, shallower data, or contamination by nuclear-driven outflows. In general, the H velocity dispersions of compact SFGs show excellent agreement with the central stellar velocity dispersion of quiescent galaxies at equivalent redshifts and masses. We note that there are some ambiguities in comparing stellar and gas velocity dispersions, however because encompasses both rotation and turbulence it should trace the total dynamical mass of the galaxy comparable to central stellar dispersions (e.g Weiner et al. 2006; Kassin et al. 2007; Cappellari et al. 2013; Courteau et al. 2014; Guerou et al. 2017). We investigate the relationship between and rotational and dispersion velocities in Section 3.4.
Locally a tight relationship between central velocity dispersion and stellar mass has been established for both quiescent and star-forming galaxies (Wake et al., 2012; Fang et al., 2013). We recover a correlation over two orders of magnitude between and with a consistent slope and factor of offset from the local relation parameterized by Fang et al. (2013) with SDSS111The local relation is established using fiber-based central stellar velocity dispersions corrected to a radius of 1 kpc using equation 1 of Cappellari et al. (2006). We do not know if the intrinsic dispersion curves mirror those in Cappellari et al. (2006) and observational evidence indicates that they may be flat (Cresci et al., 2009) resulting in a null correction. However, if we assume that the dispersion curves have comparable radial profiles to the galaxies in Cappellari et al. (2006) and apply the same correction then the KMOS3D linewidths would increase by 1.09, with the highest factors being 1.15 for the few galaxies with half-light radii kpc and the smallest correction factors for compact SFGs and quiescent galaxies.. The slight offset of the population from the local relation could be explained by evolutionary effects. For example, it is well known that for SFGs the integrated linewidth is correlated with rotational velocity, both locally and at high-redshift (e.g. Tully & Fouque 1985; Weiner et al. 2006). Thus Figure 4 roughly presents a stellar Tully-Fisher Relation (Tully & Fisher, 1977; Übler et al., 2017). The details of the relationship between and velocity are less clear and may also change with redshift. This is explored in greater detail for the full KMOS3D sample in Section 3.4.
3.3. Compact SFG resolved kinematics
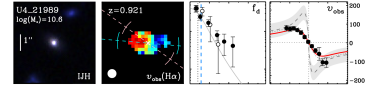
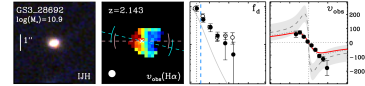
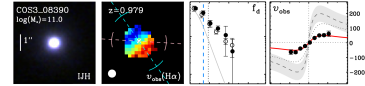
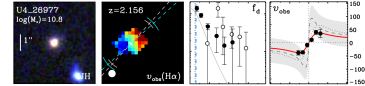
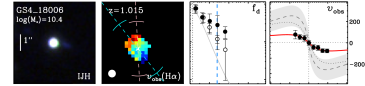
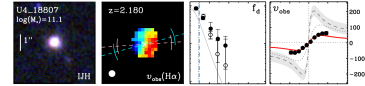
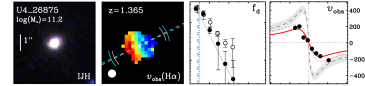
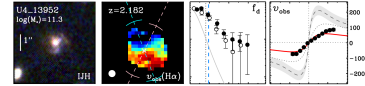
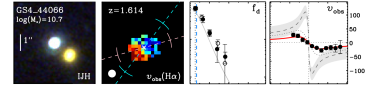
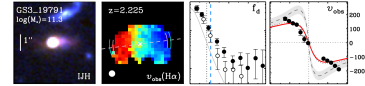
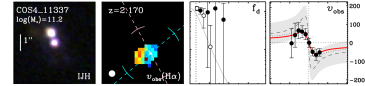
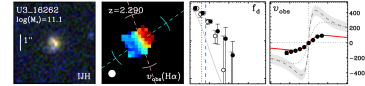
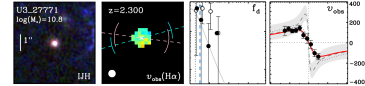
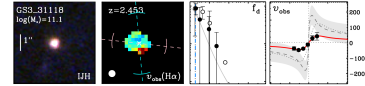
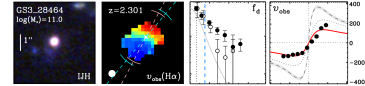
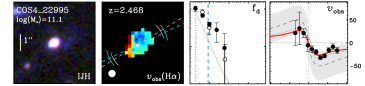
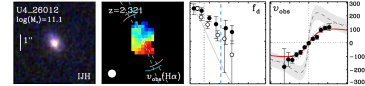
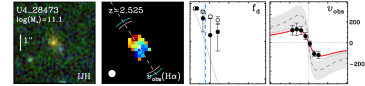
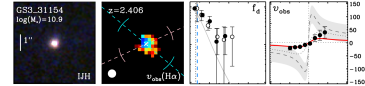
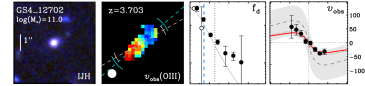
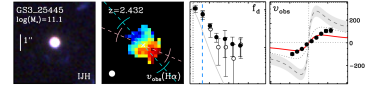
We resolve line emission in 23 of the 35 compact SFGs detected in KMOS3D, spanning the wide redshift range of . The fraction of resolved compact SFGs, %, is marginally lower than the resolved fraction in the full KMOS3D sample of 74%. In Section 4.1 of W15 we outline in detail a set of five criteria used for the KMOS3D survey to classify galaxies as ‘rotation-dominated’ and ‘disk-like’. The criteria are (1) a clear monotonic velocity gradient, (2) the ratio of rotational support to the disk velocity dispersion measured in the outer parts of the galaxy, , to be greater than unity, (3) the agreement of the photometric and kinematic axes within 30∘, (4) the spatial coincidence of the centroids of the velocity map and velocity dispersion map within the errors, and (5) the spatial coincidence of the centroids of the velocity map and the continuum map within the errors. Of the KMOS3D compact SFGs that are resolved, 21/23 satisfy the first two criteria to be considered rotation-dominated and 12/23 satisfy the more strict five criteria to be considered disk-like. These fractions are consistent with the same analysis for the full KMOS3D galaxy sample of 83% and 58% respectively, as reported in W15. In Figure 5 we show the 1D and 2D kinematics of the compact SFGs that are rotation-dominated.


Rotationally-supported compact SFGs have mean inclination and beam-smearing corrected velocities of km s-1 and mean , comparable to extended disk-like SFGs from the full KMOS3D sample. We discuss these properties in the context of the overall sample in Section 3.4. Typical uncertainties on and are 25% and 30% respectively. The main uncertainties for kinematic measurements of these compact galaxies are discussed further at the end of this section. Disk circular velocities are estimated for the galaxies satisfying all five disk criteria by correcting for the effects of inclination, beam smearing, and additional pressure support from random motions, such that;
| (1) |
The functional form of is dependent on the distribution of gas surface density and gas velocity dispersion (Valenzuela et al., 2007; Dalcanton & Stilp, 2010; Burkert et al., 2010). In the case of constant isotropic velocity dispersion (Cresci et al., 2009) adopted for this paper is defined as twice the ratio of half-light radius to disk radius, assuming is measured at (Burkert et al., 2010, 2016). We find a range of disk circular velocities, km s-1, for the compact SFGs which follows the underlying KMOS3D SFG population.
Although the kinematic values, , , and are calculated from the maximal velocity difference from the extracted 1D velocity profile, an exponential disk rotation curve is fit for illustrative purposes to the observed 1D velocity profile shown by the red line in Figure 5. The disk scale length of the model curve is constrained to be within 2 errors of the H or [O III] half-light radius. The emission line half-light sizes provide a better prior to obtain a best fit to the observed velocity data in the majority of galaxies. When the radius is left as a free parameter in the rotation curve fit, the resulting radii are more closely matched to the H sizes than the HST -band sizes. Both sizes are shown by vertical lines in the third panels of Figure 5.
A further consequence of the small characteristic sizes and morphologies of the compact SFGs is large uncertainties from both the beam smearing corrections, and the corrections to the observed velocity or linewidth. As a result of these corrections the errors on the disk circular velocity for the compact SFGs are large. Even when rotation is resolved the measured is a lower limit. Corrections for inclination, ()-1, are for nine compact SFGs due to the high axis ratios characteristic of compact SFGs. For galaxies with axis ratios very close to unity the true inclination correction is highly uncertain. This uncertainty is propagated to , however the % errors on the axis ratio may be underestimated for the compact sources presented in this work. In Figure 5 the dotted line shows the inclination correction applied to the best-fit model curve to the observed data.
A beam smearing correction is applied to the observed velocity, , in addition to the inclination correction. The beam smearing corrections depend on the ratio of the -band effective radius to the KMOS PSF. As a result, galaxies with compact -band sizes have large correction factors. In Figure 5 the intrinsic non-beam-smeared rotation curve assuming the exponential disk radius is equal to is shown by the dashed line. The average velocity beam smearing correction factor is 1.5, with a range from . However, as discussed, inferred intrinsic H sizes can be greater than the -band sizes. In these cases the beam-smearing corrections may be over-estimated when using the -band size. Beam smearing corrections are calculated using the H size for 6/23 resolved galaxies in the sample corresponding to the galaxies with H sizes 2-sigma larger than their -band sizes. For these 5 galaxies, the intrinsic non-beam-smeared rotation curve assumes that the exponential disk radius is equal to . The grey band surrounding the dashed line reflects the errors on the observed velocity, inclination correction, and beam-smearing corrections.
Errors on the beam smearing corrections are estimated from Monte Carlo simulations of the galaxy parameters that enter into the beam smearing calculations. For the velocity beam smearing correction only the half-light radius is varied. The resulting 34 and 68 percentile errors on the velocity beam smearing correction are small, typically a few percent. The dominant correction to the velocity is galaxy dependent as can be seen from the variety of rotation curves in Figure 5. Beam smearing corrections to are dependent on , , and as detailed in Appendix A.2.4 of Burkert et al. (2016). Multiplicative corrections range from . The 34 and 68 percentile errors on the dispersion beam smearing correction are larger, typically 40%.
A higher fraction of the compact galaxies may be rotating but observations are limited by beam size and low surface brightness (despite pushing to low flux levels for many cases, ergs s-1 cm-2 arcsec-2 using integration times hrs). Deep AO-assisted data (updating previously seeing-limited observations) of small SFGs has revealed that previously classified dispersion-dominated SFGs () are actually rotationally supported (Newman et al., 2013). Initial observations of compact SFGs yielded large linewidths, km s-1 (Barro et al., 2014b; Nelson et al., 2014), in some cases interpreted under the assumption that compact SFGs have negligible rotation (Barro et al., 2014b). Recent results, also from the 3D-HST sample (van Dokkum et al., 2015), find a wide range of linewidths and argue that rotation likely does provide the majority of dynamical support for these galaxies. We directly measure with integral field spectroscopy a similar but wider range of rotational velocities than those in van Dokkum et al. (2015). Compact SFGs have axis ratios close to unity resulting in poorly constrained photometric axes. An advantage of resolved spectroscopy for these galaxies is that the kinematic axis can be measured independent of the photometric axis. Approximately half, 11/21, of the rotation-dominated compact SFGs have a kinematic misalignment from the photometric axis of degrees as seen by the blue and pink lines in the second panels of Figure 5.
3.4. The dynamics of integrated linewidths
As discussed in Section 3.2 the measured integrated emission linewidth represents the total dynamics of the system including both rotation and dispersion as well as non-gravitational effects such as galactic-scale winds. With the resolved information from KMOS we decompose the relative contributions from turbulence, rotation, and large-scale winds to the measured of compact and extended SFGs with direct measurements.
In theory the observed linewidth should be a linear combination of these components, such that
| (2) |
(e.g. Tully & Fouque 1985; Weiner et al. 2006; van Dokkum et al. 2015). In equation 2, is a constant that we calibrate below, is the dispersion of the interstellar medium of the galaxy here approximated by , and is the dispersion of broad underlying emission from a large scale wind scaled by factor . The functional form of is unknown with likely dependence on galaxy inclination and wind opening angle. In the absence of knowledge of the detailed structure of the winds we parameterize empirically as the square of the ratio of the peak of the broad component in a two-Gaussian fit to the peak of a single Gaussian fit. This is based on the assumption that the closer the ratio is to unity the larger the effect of the wind on the total linewidth. Here, in contrast to equation 1, the ISM turbulence, measured as , is added in quadrature with no scale factor, reflecting its contribution to line-broadening, and no beam smearing correction is applied. Thus, in the case of a purely face-on disk with no winds the integrated linewidth is equivalent to the isotropic disk velocity dispersion, as both observables and are affected by inclination.
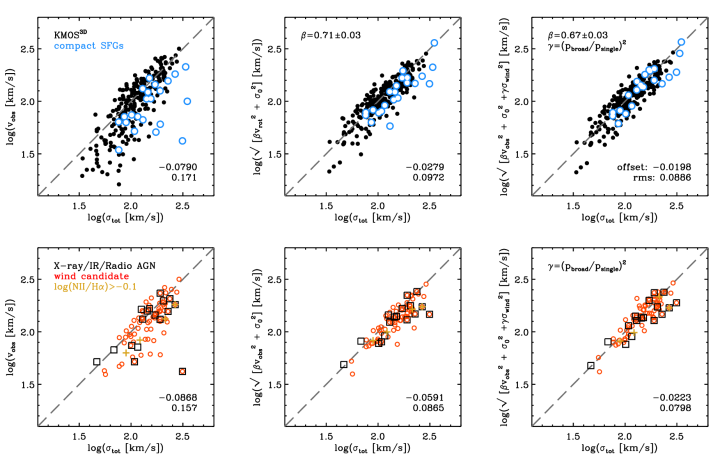
In Figure 6 we test the validity of equation 2 for KMOS3D galaxies showing rotation (disk criterion 1). In the top left panel of Figure 6 we show the measured velocity difference, , as a function of the observed linewidth, , for compact SFGs as they relate to the full population of KMOS3D galaxies. While the full sample shows a general agreement at high observed velocities and linewidths, there is significant scatter with the tendency for the velocity shear to represent only a fraction of the linewidth for both the compact SFGs and full population. This is unsurprising as local gas velocity dispersions are known to be high at these redshifts (e.g. Genzel et al. 2006; Förster Schreiber et al. 2006; Law et al. 2007; Förster Schreiber et al. 2009; Cresci et al. 2009; Kassin et al. 2012; Newman et al. 2013; Stott et al. 2016; W15). Adding the turbulent motions in quadrature to the observed velocity difference (top middle panel) reduces the rms comparison to the observed linewidth for the full KMOS3D sample of rotating galaxies from 0.171 dex to 0.097 dex with a best-fit scale factor of . Accounting for turbulence is fractionally most important in systems with low of 100 km s-1 or less including near face-on objects and galaxies with .
The right-most panels of Figure 6 show the comparison with observed integrated linewidth when the contribution of an additional non-gravitational component is considered. For galaxies in our sample with strong broad components we make a two-Gaussian fit to the rotation-corrected integrated spectrum to determine the contribution from nuclear- or SF-driven winds to the integrated linewidth (Förster Schreiber et al. 2014; Genzel et al. 2014a, Förster Schreiber et al. in prep). For the strongest cases an additional broad Gaussian component, , produces a significant improvement to the overall model spectral fit. Using a conservative cut, we measure in 68 galaxies, a quarter of our sample, that also have and measurements. We see a further reduction of scatter in Figure 6 when taking the wind component into account, with the ratio of the peak emission of the broad and single components and a best-fit scale factor of . Although the overall effect is small for the full resolved KMOS3D sample, the importance for the compact SFGs can be seen from the offset in the top middle and right panels of Figure 6.
The bottom panels of Figure 6 show the same linewidth comparisons for only AGN candidates using all available AGN indicators. The wind term of equation 2 with scale factor is particularly important for the subsample of galaxies that show evidence of hosting nuclear-driven outflows, many of which are classified as compact SFGs. For the galaxies possibly hosting AGN we see comparable trends as for the full rotation-dominated sample with a reduction in scatter from 0.087 dex to 0.080 dex when including the contributions from winds indicating that the presence of an AGN could influence the derived 1D kinematics as seen from the spectra shown in Figure 3 of COS4_11363 for example.
The velocity scale factor, , in equation 2 reflects the projection of the rotational velocity along the line-of-sight with literature values ranging from (e.g. Rix et al. 1997; Erb et al. 2006; Weiner et al. 2006; Zolotov et al. 2015). We use our observables to solve for the value of , which brings the left and right sides of equation 2 into agreement for the KMOS3D data as shown in the right most panels of Figure 6. If the wind component is not considered (middle panels) then is slightly lower but consistent within the uncertainties, 0.71. This value is higher than typically used by previous studies, however may encompass a mix of dependencies on aperture size, line-profile asymmetries, beam-smearing, centrally weighted light-profiles, and the magnitude of random motions (Rix et al., 1997) and thus may be sample or data specific.
The exact form of equation 1 and equation 2 and the constant in equation 1 is dependent on the radial distribution of density and velocity dispersion assumed. For a spherically symmetric system with isotropic velocity dispersion or depending on the exact model used (Binney & Tremaine, 2008). This formalism motivates the dynamical parameter popularized for use in Tully-Fisher analyses (e.g. Weiner et al. 2006; Kassin et al. 2007; Cortese et al. 2014). Setting here produces a similar reduction in scatter (rms=0.0995) but leads to a larger offset with 78% of values having (offset=-0.0756).
A caveat is that in small or faint galaxies in which the KMOS observations do not probe to the outer regions of the disk, the values may be biased low and the values may be biased high. However, the dual measurement effects act together minimising their effect (Covington et al., 2010).
3.5. Integrated line ratios
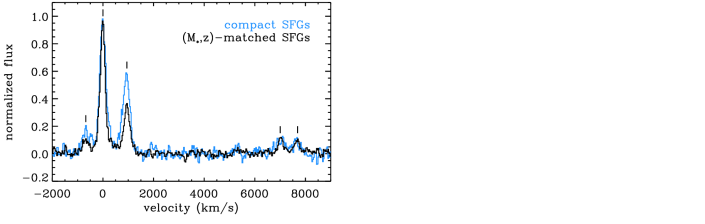
We measure a wide range of ([N II]/H) ratios, , for compact SFGs as shown in Figure 3. We combine the spectra in a median stack of H normalized spectra to determine the average emission line properties of compact SFGs. By stacking we are able to detect the weaker lines [S II]. Broad line AGNs are removed prior to stacking. For comparison a mass and redshift matched stack is also produced drawing from the full KMOS3D sample. Both stacked spectra are shown in Figure 7. The residuals from a single component Gaussian fits to the H-[N II]-[S II] lines reveal excess emission especially near the H-[N II] complex. This emission is likely from stellar or nuclear driven winds as discussed above. For simplicity we adopt a single component fit to the emission lines. However, we note that the narrow component for a two component fit is consistent within errors with the single component fit.
The compact SFGs (blue spectrum in Figure 7) show a higher [N II]/H ratio, , than the mass and redshift matched comparison sample (black spectrum), while the [S II]/H ratios are consistent within the errors, and respectively. The high [N II]/H ratios are expected given the high AGN fraction in massive galaxies and particularly the compact SFGs as discussed in the previous section. The low [S II]/H ratios in both stacks may be the result of a higher ionization parameter (Brinchmann et al., 2008; Kewley et al., 2015; Kashino et al., 2017) and are inconsistent with pure shock or LINER driven emission (from local calibrations; Rich et al. 2011).
3.6. Dynamical mass
We estimate the dynamical mass, , assuming a thick (1:4) exponential disk for the KMOS3D rotation-dominated galaxies (disk criterion 1 and 2) from the rotational velocities using:
| (3) |
where the factor is dependent on the mass distribution of the system (Binney & Tremaine, 2008). We assume for a pressure supported thick disk. We use the half light sizes, , measured from observed F160W -band light from the CANDELS imaging using single Sérsic fits (Lang et al., 2014). For a full analysis of the baryon fractions of KMOS3D galaxies and a 2D modeling approach see Wuyts et al. (2016). The dynamical mass estimates would marginally increase if H half-light sizes were used for the full sample as is close to unity for the majority of star-forming galaxies at this epoch (Nelson et al. 2014, Wilman et al. in prep).
For galaxies with unresolved kinematics we estimate the disk circular velocity from the observed linewidth, under the assumption that their dynamics are dominated by rotation (Binney & Tremaine, 2008). Because disk velocity dispersions are high at these epochs proving non-negligible pressure support, equation 2 alone is not sufficient to derive the velocity. Thus to derive the disk circular velocity from the integrated linewidth the corrections take the composite form of;
| (4) |
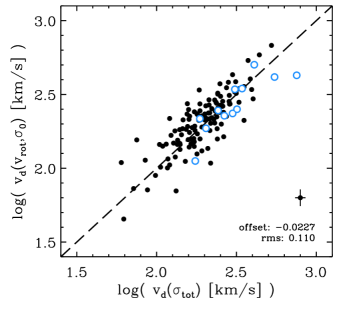
However, equation 4 requires knowledge of and , which are not available in the unresolved case. We estimate based solely on redshift such that km s-1 at , km s-1 at , and km s-1 at (W15) and assume that . We test this method on resolved rotation-dominated galaxies, shown in Figure 8, finding reasonable agreement between estimated from resolved parameters in equation 1 and estimated from equation 4, with 0.11 dex scatter. A large portion of the scatter is likely due to the range in measured values at each epoch (W15).
We also test the simpler case in which we assume that the turbulence and wind contributions are negligible and only apply an inclination correction to . The comparison between inclination corrected and shows on average that for the full sample. Although less physically motivated, the rms scatter for this method is comparable to using the method described above.
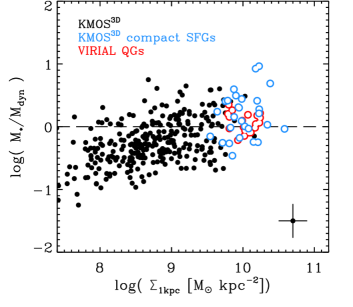
In Figure 9 we investigate the relationship between stellar and dynamical mass as a function of inner-kpc density recovering a weak trend such that the most centrally dense objects, including compact SFGs and quiescent galaxies, have stellar mass fractions closest to unity. We compare our results to the VIRIAL survey of quiescent galaxies. In contrast, their dynamical masses are computed from a combination of stellar kinematics and photometry with JAM modeling (Cappellari, 2008). With this comparison sample, we find that compact SFGs are consistent with quiescent galaxies in both central density and stellar baryon fraction with scattered around unity. This implies that there is little room for a significant additional mass component from molecular gas, atomic gas, or dark matter within the regions of the galaxies probed by our measurements. The high stellar to dynamical mass ratios and high stellar densities suggest a short time scale for the onset of quenching. Indeed, recent CO and [CI] ALMA observations of compact SFGs GS3_19791 and COS4_22995, also in our sample, reveal a molecular gas fraction between 4-14% as well as short depletion times (Spilker et al., 2016; Popping et al., 2017). These gas fractions are consistent with gas fractions implied by the ratio of the dynamical mass estimates and stellar masses. They are significantly lower than the average gas fractions of ‘typical’ extended SFGs of 40% (Tacconi et al., 2010, 2013, 2017; Daddi et al., 2010; Genzel et al., 2015).
As discussed in Wuyts et al. (2016) some galaxies scatter to unphysical baryon fractions. We investigate this further for the specific case of compact SFGs looking for trends with galaxy properties. Inclination corrections are particularly uncertain for compact SFGs as the typical axis ratios are close to unity. They are difficult to measure due to both the circular appearance of the galaxies as well as their small size in comparison to the HST PSF. The compact SFG with the highest stellar baryon fraction has axis ratio . If the axis ratio was increased to , comparable with other compact SFGs of the sample, then would be reduced to , in line with the scatter of the rest of the population.
4. Discussion
Compact SFGs have garnered a lot of attention in the last five years as a possible transitional population between the massive end of the star-forming main sequence and the quiescent galaxy population (e.g. Barro et al. 2013, 2014a, 2014b; Williams et al. 2014; Dekel & Burkert 2014; Tadaki et al. 2014; Brennan et al. 2015). Two dominant theories have emerged as to how compact SFGs are formed; either through gas dissipation and central starburst (Dekel & Burkert, 2014; Tadaki et al., 2017a) or from already small less-massive SFGs (van Dokkum et al., 2015; Lilly & Carollo, 2016). In contrast, compact SFGs have universally been linked as the immediate progenitors of compact quiescent galaxies at and thus the likely progenitors of a fraction of S0 or elliptical galaxies in the local universe. We explore our resolved H results in the context of these scenarios.
4.1. Forming compact SFGs
In the ‘compaction’ formation scenario central starbursts within extended galaxies rapidly build-up a central mass concentration creating the possible precursors of compact SFGs. Tadaki et al. (2017b) present two such galaxies at with dust obscured cores and compact molecular gas sizes ( kpc). The starburst cores have sizes, , and comparable to our H results of compact SFGs. However it follows that a more extended stellar disk remains that may be obscured or out-shined by the central core. The measured H profiles of KMOS3D compact SFGs with exponential disks of kpc and high stellar baryon fractions suggest that we are unlikely missing substantially larger extincted star-forming disks.
Alternatively, the H and continuum sizes may more simply suggest that compact SFGs are amongst the oldest galaxies in our full SFG population such that their current small observed sizes are reflective of the average population at the epoch when they assembled the bulk of their stellar mass (e.g. van Dokkum et al. 2015; Lilly & Carollo 2016). In this scenario, dissipative processes may still have been responsible for creating the high central density but have done so on a different time scale than the central starburst scenario.
4.2. Compact SFGs as progenitors of compact quiescent galaxies
The high stellar to dynamical mass ratios measured for the KMOS3D compact SFGs imply that the onset of quenching of the remaining star-formation should be fast as there is little room for molecular gas reservoirs. Further support for short timescales comes from the morphology of compact SFGs (e.g bulge-to-total ratios: B/T and Sérsic indices: ). Galactic structure, both locally and at , have been linked to high passive fractions for massive galaxies (Kauffmann et al., 2003a; Driver et al., 2006; Wuyts et al., 2011a; Bell et al., 2012). The results presented here and in other KMOS3D papers (Burkert et al., 2016; Wuyts et al., 2016) are consistent with scenarios in which SFGs approach a critical mass or mass density before quenching.
Our kinematic results reveal that of compact star-forming galaxies have a disk component with significant rotational support. If compact SFGs are the true progenitors of quiescent galaxies then the quenching process at this epoch will either destroy the rotation leaving a pressure-supported quiescent galaxy or leave the rotation intact forming a rotating quiescent galaxy. In the second scenario, the disk-like kinematics and large disk circular velocities imply that compact quiescent galaxies would be observed as ‘fast rotators’ at later times. Evidence of rotating quiescent galaxies at from the literature includes observational results from deep imaging that suggest as many as % of compact quiescent galaxies are disk dominated at (van Dokkum et al., 2008; van der Wel et al., 2011; Chevance et al., 2012) and spectroscopic results of two strongly lensed quiescent galaxies which reveal stellar rotation curves of km s-1and km s-1(Newman et al., 2015; Toft et al., 2017). The rotation detected in both compact SFGs and quiescent galaxies implies that integrated measurements of quiescent galaxies likely have a rotational component (see also Belli et al. 2017a, Mendel et al. in prep).
The dynamics of local descendants of rotating high-redshift compact galaxies depends strongly on their accretion histories. High-redshift compact galaxies may evolve into kinematically distinct cores, compact galaxies or S0s (e.g. Cappellari 2016). It is possible that they become the fast-rotators observed in high fractions locally (% of galaxies with ; e.g. Emsellem et al. 2011; van de Sande et al. 2017; Greene et al. 2018). However, the stellar masses could still increase by almost an order of magnitude from to today (e.g. Muzzin et al. 2013). If the compact SFGs follow this path, they may loose angular momentum due to merging and evolve into slow rotators at the highest masses (e.g. ; Wellons et al. 2016).
Merging is a possible mechanism to quench existing compact SFGs (e.g. Wellons et al. 2015; Zolotov et al. 2015) which could either destroy or retain the existing rotational support (Naab & Burkert, 2003; Hammer et al., 2005; Wuyts et al., 2010). There are two possible major mergers (mass ratios of 1:1, 1:2) in our sample identified by spectroscopic redshifts and projected separations ( km s-1, kpc). However, the number of possible companions around compact SFGs within 1-sigma redshift errors and 50 kpc (drawing from the 3D-HST catalog) is consistent within the errors with the full SFG sample of massive galaxies, , in KMOS3D, suggesting that major mergers are not the sole mechanism responsible for quenching compact SFGs.
AGN provide another mechanism to quench galaxies particularly at these masses and redshifts (e.g. Di Matteo et al. 2005; Hopkins et al. 2006; Croton et al. 2006; Shimizu et al. 2015) and have been proposed specifically for compact SFGs as a likely quenching mechanism (Barro et al., 2013). With access to additional metrics to measure nuclear activity (NII/H ratios, and deep data to recover broad underlying emission components) we have found an even higher rate of possible AGN activity in compact SFGs. We estimate the AGN incidence is higher in compact SFGs than the overall population at a fixed stellar mass. While we cannot rule out that this is partially a consequence of selection due to the emission from an AGN being attributed to star-formation or an AGN outshining a large underlying disk, it is suggestive that AGN may play a central role in the evolutionary tracks of compact SFGs. The high [N II]/H emission line ratio in the compact SFG stack is consistent with emission line ratios found in quiescent galaxies both locally (Yan et al., 2006) and at high redshift (Newman et al., 2015; Belli et al., 2017b; Toft et al., 2017).
5. Conclusions
We present the kinematic properties of 35 compact centrally-dense star-forming galaxies at in the KMOS3D survey. For the first time with Integral Field Spectroscopy (IFS) we spatially resolve 23 compact SFGs. The IFS data map the emission line kinematics and morphology in two spatial dimensions enabling a determination of the kinematic position angle in rotating galaxies. The data reveal that the majority of resolved compact SFGs, 21/23, are rotationally-dominated systems with rotational velocities and disk dispersions comparable to the full KMOS3D dataset of SFGs at similar masses. With the kinematic position angle know we can measure velocity gradients ranging from km s-1. The integrated ionized gas linewidths of compact SFGs ( km s-1) and extended SFGs can be reproduced by a combination of their observed rotation, disk velocity dispersion, and wind strength. This line decomposition demonstrates the important interplay of different kinematic components of these systems when inferring rotational velocities from unresolved data.
The H profiles of compact SFGs are well fit with an exponential disk model with sizes of kpc, slightly larger or comparable to the broad-band continuum sizes. This result and the detection of rotation are in line with earlier results presented by van Dokkum et al. (2015). Stacked spectra of compact SFGs show higher [N II]/H and comparable [S II]/H to a stellar mass and redshift matched sample.
We derive large dynamical masses leaving little room for large molecular gas reservoirs a result supported by recent ALMA observations of two of the compact SFGs in our sample. The high M∗/Mdyn ratios together with the structural parameters (high central densities and cuspy profiles) suggest that, assuming no further gas replenishment, these galaxies will have their large SFRs quenched on a short time scale. Depending on the quenching mechanism it is possible that the resultant quiescent galaxies would retain the rotational support observed in the compact SFG phase. There is a growing amount of evidence in the literature to support the scenario of rotationally supported quiescent galaxies at . Integrated ionized gas linewidths of compact SFGs are comparable to the stellar velocity dispersions of compact quiescent galaxies at similar redshifts. However, direct measurement of stellar and gas velocity dispersions in the same objects (e.g Barro et al. 2015) for a large sample is required to see if a link between these two measurements can be made on average. Future work utilising synergies between the KMOS3D survey and the complementary VIRIAL survey (Mendel et al., 2015) of passive galaxies in the same fields will investigate the relationship between stellar and ionized gas linewidths for a sample of galaxies observed in both surveys.
References
- Alexander et al. (2010) Alexander, D. M., Swinbank, A. M., Smail, I., McDermid, R., & Nesvadba, N. P. H. 2010, MNRAS, 402, 2211
- Balogh et al. (2004) Balogh, M. L., Baldry, I. K., Nichol, R., et al. 2004, ApJ, 615, L101
- Barro et al. (2013) Barro, G., Faber, S. M., Pérez-González, P. G., et al. 2013, ApJ, 765, 104
- Barro et al. (2014a) —. 2014a, ApJ, 791, 52
- Barro et al. (2014b) Barro, G., Trump, J. R., Koo, D. C., et al. 2014b, ApJ, 795, 145
- Barro et al. (2015) Barro, G., Faber, S. M., Dekel, A., et al. 2015, ArXiv e-prints, arXiv:1503.07164
- Beifiori et al. (2017) Beifiori, A., Mendel, J. T., Chan, J. C. C., et al. 2017, ApJ, 846, 120
- Bell et al. (2012) Bell, E. F., van der Wel, A., Papovich, C., et al. 2012, ApJ, 753, 167
- Belli et al. (2014) Belli, S., Newman, A. B., & Ellis, R. S. 2014, ApJ, 783, 117
- Belli et al. (2017a) —. 2017a, ApJ, 834, 18
- Belli et al. (2017b) Belli, S., Genzel, R., Förster Schreiber, N. M., et al. 2017b, ApJ, 841, L6
- Best et al. (2005) Best, P. N., Kauffmann, G., Heckman, T. M., et al. 2005, MNRAS, 362, 25
- Bezanson et al. (2015) Bezanson, R., Franx, M., & van Dokkum, P. G. 2015, ApJ, 799, 148
- Binney & Tremaine (2008) Binney, J., & Tremaine, S. 2008, Galactic Dynamics: Second Edition, ed. Binney, J. & Tremaine, S. (Princeton University Press)
- Bluck et al. (2014) Bluck, A. F. L., Mendel, J. T., Ellison, S. L., et al. 2014, MNRAS, 441, 599
- Bournaud et al. (2007) Bournaud, F., Elmegreen, B. G., & Elmegreen, D. M. 2007, ApJ, 670, 237
- Bower et al. (2006) Bower, R. G., Benson, A. J., Malbon, R., et al. 2006, MNRAS, 370, 645
- Brammer et al. (2012) Brammer, G., van Dokkum, P., Franx, M., et al. 2012, 1204.2829
- Brennan et al. (2015) Brennan, R., Pandya, V., Somerville, R. S., et al. 2015, MNRAS, 451, 2933
- Brinchmann et al. (2008) Brinchmann, J., Pettini, M., & Charlot, S. 2008, MNRAS, 385, 769
- Brusa et al. (2009) Brusa, M., Fiore, F., Santini, P., et al. 2009, A&A, 507, 1277
- Bundy et al. (2008) Bundy, K., Georgakakis, A., Nandra, K., et al. 2008, ApJ, 681, 931
- Burkert et al. (2010) Burkert, A., Genzel, R., Bouché, N., et al. 2010, ApJ, 725, 2324
- Burkert et al. (2016) Burkert, A., Förster Schreiber, N. M., Genzel, R., et al. 2016, ApJ, 826, 214
- Cappellari (2008) Cappellari, M. 2008, MNRAS, 390, 71
- Cappellari (2016) —. 2016, ARA&A, 54, 597
- Cappellari et al. (2006) Cappellari, M., Bacon, R., Bureau, M., et al. 2006, MNRAS, 366, 1126
- Cappellari et al. (2011) Cappellari, M., Emsellem, E., Krajnovic, D., et al. 2011, 1104.3545
- Cappellari et al. (2013) Cappellari, M., McDermid, R. M., Alatalo, K., et al. 2013, MNRAS, 432, 1862
- Chabrier (2003) Chabrier, G. 2003, PASP, 115, 763
- Chang et al. (2013) Chang, Y.-Y., van der Wel, A., Rix, H.-W., et al. 2013, ApJ, 773, 149
- Cheung et al. (2012) Cheung, E., Faber, S. M., Koo, D. C., et al. 2012, 1210.4173
- Chevance et al. (2012) Chevance, M., Weijmans, A.-M., Damjanov, I., et al. 2012, ApJ, 754, L24
- Cortese et al. (2014) Cortese, L., Fogarty, L. M. R., Ho, I.-T., et al. 2014, ApJ, 795, L37
- Courteau et al. (2014) Courteau, S., Cappellari, M., de Jong, R. S., et al. 2014, Reviews of Modern Physics, 86, 47
- Covington et al. (2010) Covington, M. D., Kassin, S. A., Dutton, A. A., et al. 2010, ApJ, 710, 279
- Crain et al. (2015) Crain, R. A., Schaye, J., Bower, R. G., et al. 2015, MNRAS, 450, 1937
- Cresci et al. (2009) Cresci, G., Hicks, E. K. S., Genzel, R., et al. 2009, ApJ, 697, 115
- Croton et al. (2006) Croton, D. J., Springel, V., White, S. D. M., et al. 2006, MNRAS, 365, 11
- Daddi et al. (2010) Daddi, E., Bournaud, F., Walter, F., et al. 2010, ApJ, 713, 686
- Dalcanton & Stilp (2010) Dalcanton, J. J., & Stilp, A. M. 2010, ApJ, 721, 547
- Damjanov et al. (2009) Damjanov, I., McCarthy, P. J., Abraham, R. G., et al. 2009, ApJ, 695, 101
- Dekel & Burkert (2014) Dekel, A., & Burkert, A. 2014, MNRAS, 438, 1870
- Di Matteo et al. (2005) Di Matteo, T., Springel, V., & Hernquist, L. 2005, Nature, 433, 604
- Driver et al. (2006) Driver, S. P., Allen, P. D., Graham, A. W., et al. 2006, MNRAS, 368, 414
- Emsellem et al. (2007) Emsellem, E., Cappellari, M., Krajnović, D., et al. 2007, MNRAS, 379, 401
- Emsellem et al. (2011) —. 2011, MNRAS, 414, 888
- Erb et al. (2006) Erb, D. K., Steidel, C. C., Shapley, A. E., et al. 2006, ApJ, 646, 107
- Erwin (2015) Erwin, P. 2015, ApJ, 799, 226
- Fang et al. (2013) Fang, J. J., Faber, S. M., Koo, D. C., & Dekel, A. 2013, ApJ, 776, 63
- Förster Schreiber et al. (2006) Förster Schreiber, N. M., Genzel, R., Lehnert, M. D., et al. 2006, ApJ, 645, 1062
- Förster Schreiber et al. (2009) Förster Schreiber, N. M., Genzel, R., Bouché, N., et al. 2009, ApJ, 706, 1364
- Förster Schreiber et al. (2014) Förster Schreiber, N. M., Genzel, R., Newman, S. F., et al. 2014, ApJ, 787, 38
- Fossati et al. (2017) Fossati, M., Wilman, D. J., Mendel, J. T., et al. 2017, ApJ, 835, 153
- Genel et al. (2014) Genel, S., Vogelsberger, M., Springel, V., et al. 2014, MNRAS, 445, 175
- Genzel et al. (2006) Genzel, R., Tacconi, L. J., Eisenhauer, F., et al. 2006, Nature, 442, 786
- Genzel et al. (2014a) Genzel, R., Förster Schreiber, N. M., Rosario, D., et al. 2014a, ApJ, 796, 7
- Genzel et al. (2014b) Genzel, R., Förster Schreiber, N. M., Lang, P., et al. 2014b, ApJ, 785, 75
- Genzel et al. (2015) Genzel, R., Tacconi, L. J., Lutz, D., et al. 2015, ApJ, 800, 20
- Greene et al. (2018) Greene, J. E., Leauthaud, A., Emsellem, E., et al. 2018, ApJ, 852, 36
- Grogin et al. (2011) Grogin, N. A., Kocevski, D. D., Faber, S. M., et al. 2011, ApJS, 197, 35
- Guerou et al. (2017) Guerou, A., Krajnovic, D., Epinat, B., et al. 2017, ArXiv e-prints, arXiv:1710.07694
- Hammer et al. (2005) Hammer, F., Flores, H., Elbaz, D., et al. 2005, A&A, 430, 115
- Hopkins et al. (2006) Hopkins, P. F., Hernquist, L., Cox, T. J., et al. 2006, ApJS, 163, 1
- Hopkins et al. (2010) Hopkins, P. F., Bundy, K., Croton, D., et al. 2010, ApJ, 715, 202
- Kashino et al. (2017) Kashino, D., Silverman, J. D., Sanders, D., et al. 2017, ApJ, 835, 88
- Kassin et al. (2007) Kassin, S. A., Weiner, B. J., Faber, S. M., et al. 2007, ApJ, 660, L35
- Kassin et al. (2012) —. 2012, ApJ, 758, 106
- Kauffmann et al. (2003a) Kauffmann, G., Heckman, T. M., White, S. D. M., et al. 2003a, MNRAS, 341, 54
- Kauffmann et al. (2003b) Kauffmann, G., Heckman, T. M., Tremonti, C., et al. 2003b, MNRAS, 346, 1055
- Kewley et al. (2015) Kewley, L. J., Zahid, H. J., Geller, M. J., et al. 2015, ApJ, 812, L20
- Kocevski et al. (2017) Kocevski, D. D., Barro, G., Faber, S. M., et al. 2017, ApJ, 846, 112
- Koekemoer et al. (2011) Koekemoer, A. M., Faber, S. M., Ferguson, H. C., et al. 2011, ApJS, 197, 36
- Lang et al. (2014) Lang, P., Wuyts, S., Somerville, R. S., et al. 2014, ApJ, 788, 11
- Law et al. (2007) Law, D. R., Steidel, C. C., Erb, D. K., et al. 2007, ApJ, 669, 929
- Lilly & Carollo (2016) Lilly, S. J., & Carollo, C. M. 2016, ApJ, 833, 1
- Martig et al. (2009) Martig, M., Bournaud, F., Teyssier, R., & Dekel, A. 2009, ApJ, 707, 250
- Martin et al. (2007) Martin, D. C., Wyder, T. K., Schiminovich, D., et al. 2007, ApJS, 173, 342
- Mendel et al. (2015) Mendel, J. T., Saglia, R. P., Bender, R., et al. 2015, ApJ, 804, L4
- Mihos & Hernquist (1994) Mihos, J. C., & Hernquist, L. 1994, ApJ, 425, L13
- Momcheva et al. (2016) Momcheva, I. G., Brammer, G. B., van Dokkum, P. G., et al. 2016, ApJS, 225, 27
- Muzzin et al. (2013) Muzzin, A., Marchesini, D., Stefanon, M., et al. 2013, ApJ, 777, 18
- Naab & Burkert (2003) Naab, T., & Burkert, A. 2003, ApJ, 597, 893
- Nelson et al. (2014) Nelson, E., van Dokkum, P., Franx, M., et al. 2014, Nature, 513, 394
- Nelson et al. (2016) Nelson, E. J., van Dokkum, P. G., Förster Schreiber, N. M., et al. 2016, ApJ, 828, 27
- Newman et al. (2015) Newman, A. B., Belli, S., & Ellis, R. S. 2015, ApJ, 813, L7
- Newman et al. (2012) Newman, A. B., Ellis, R. S., Bundy, K., & Treu, T. 2012, ApJ, 746, 162
- Newman et al. (2013) Newman, S. F., Genzel, R., Förster Schreiber, N. M., et al. 2013, ApJ, 767, 104
- Peng et al. (2002) Peng, C. Y., Ho, L. C., Impey, C. D., & Rix, H.-W. 2002, AJ, 124, 266
- Peng et al. (2010) Peng, Y.-j., Lilly, S. J., Kovač, K., et al. 2010, ApJ, 721, 193
- Popping et al. (2017) Popping, G., Decarli, R., Man, A. W. S., et al. 2017, A&A, 602, A11
- Reddy et al. (2005) Reddy, N. A., Erb, D. K., Steidel, C. C., et al. 2005, ApJ, 633, 748
- Rich et al. (2011) Rich, J. A., Kewley, L. J., & Dopita, M. A. 2011, ApJ, 734, 87
- Rix et al. (1997) Rix, H.-W., Guhathakurta, P., Colless, M., & Ing, K. 1997, MNRAS, 285, 779
- Schaye et al. (2015) Schaye, J., Crain, R. A., Bower, R. G., et al. 2015, MNRAS, 446, 521
- Shapiro et al. (2009) Shapiro, K. L., Genzel, R., Quataert, E., et al. 2009, ApJ, 701, 955
- Sharples et al. (2013) Sharples, R., Bender, R., Agudo Berbel, A., et al. 2013, The Messenger, 151, 21
- Shimizu et al. (2015) Shimizu, T. T., Mushotzky, R. F., Meléndez, M., Koss, M., & Rosario, D. J. 2015, MNRAS, 452, 1841
- Skelton et al. (2014) Skelton, R. E., Whitaker, K. E., Momcheva, I. G., et al. 2014, ApJS, 214, 24
- Spilker et al. (2016) Spilker, J. S., Bezanson, R., Marrone, D. P., et al. 2016, ApJ, 832, 19
- Stott et al. (2016) Stott, J. P., Swinbank, A. M., Johnson, H. L., et al. 2016, MNRAS, 457, 1888
- Tacchella et al. (2016) Tacchella, S., Dekel, A., Carollo, C. M., et al. 2016, MNRAS, 458, 242
- Tacconi et al. (2010) Tacconi, L. J., Genzel, R., Neri, R., et al. 2010, Nature, 463, 781
- Tacconi et al. (2013) Tacconi, L. J., Neri, R., Genzel, R., et al. 2013, ApJ, 768, 74
- Tacconi et al. (2017) Tacconi, L. J., Genzel, R., Saintonge, A., et al. 2017, ArXiv e-prints, arXiv:1702.01140
- Tadaki et al. (2014) Tadaki, K.-i., Kodama, T., Tanaka, I., et al. 2014, ApJ, 780, 77
- Tadaki et al. (2017a) Tadaki, K.-i., Genzel, R., Kodama, T., et al. 2017a, ApJ, 834, 135
- Tadaki et al. (2017b) Tadaki, K.-i., Kodama, T., Nelson, E. J., et al. 2017b, ApJ, 841, L25
- Toft et al. (2017) Toft, S., Zabl, J., Richard, J., et al. 2017, Nature, 546, 510
- Toomre & Toomre (1972) Toomre, A., & Toomre, J. 1972, ApJ, 178, 623
- Trujillo et al. (2007) Trujillo, I., Conselice, C. J., Bundy, K., et al. 2007, MNRAS, 382, 109
- Tully & Fisher (1977) Tully, R. B., & Fisher, J. R. 1977, A&A, 54, 661
- Tully & Fouque (1985) Tully, R. B., & Fouque, P. 1985, ApJS, 58, 67
- Übler et al. (2017) Übler, H., Förster Schreiber, N. M., Genzel, R., et al. 2017, ApJ, 842, 121
- Valenzuela et al. (2007) Valenzuela, O., Rhee, G., Klypin, A., et al. 2007, ApJ, 657, 773
- van de Sande et al. (2013) van de Sande, J., Kriek, M., Franx, M., et al. 2013, ApJ, 771, 85
- van de Sande et al. (2017) van de Sande, J., Bland-Hawthorn, J., Brough, S., et al. 2017, MNRAS, 472, 1272
- van der Wel et al. (2011) van der Wel, A., Rix, H.-W., Wuyts, S., et al. 2011, ApJ, 730, 38
- van der Wel et al. (2014) van der Wel, A., Franx, M., van Dokkum, P. G., et al. 2014, ApJ, 788, 28
- van Dokkum et al. (2008) van Dokkum, P. G., Franx, M., Kriek, M., et al. 2008, ApJ, 677, L5
- van Dokkum et al. (2014) van Dokkum, P. G., Bezanson, R., van der Wel, A., et al. 2014, ApJ, 791, 45
- van Dokkum et al. (2015) van Dokkum, P. G., Nelson, E. J., Franx, M., et al. 2015, ApJ, 813, 23
- Vogelsberger et al. (2014) Vogelsberger, M., Genel, S., Springel, V., et al. 2014, MNRAS, 444, 1518
- Wake et al. (2012) Wake, D. A., van Dokkum, P. G., & Franx, M. 2012, ApJ, 751, L44
- Weiner et al. (2006) Weiner, B. J., Willmer, C. N. A., Faber, S. M., et al. 2006, ApJ, 653, 1027
- Wellons et al. (2015) Wellons, S., Torrey, P., Ma, C.-P., et al. 2015, MNRAS, 449, 361
- Wellons et al. (2016) —. 2016, MNRAS, 456, 1030
- Whitaker et al. (2014) Whitaker, K. E., Franx, M., Leja, J., et al. 2014, ApJ, 795, 104
- Williams et al. (2014) Williams, C. C., Giavalisco, M., Cassata, P., et al. 2014, ApJ, 780, 1
- Wisnioski et al. (2015) Wisnioski, E., Förster Schreiber, N. M., Wuyts, S., et al. 2015, ApJ, 799, 209
- Wuyts et al. (2010) Wuyts, S., Cox, T. J., Hayward, C. C., et al. 2010, ApJ, 722, 1666
- Wuyts et al. (2011a) Wuyts, S., Förster Schreiber, N. M., van der Wel, A., et al. 2011a, ApJ, 742, 96
- Wuyts et al. (2011b) Wuyts, S., Förster Schreiber, N. M., Lutz, D., et al. 2011b, ApJ, 738, 106
- Wuyts et al. (2016) Wuyts, S., Förster Schreiber, N. M., Wisnioski, E., et al. 2016, ApJ, 831, 149
- Yan et al. (2006) Yan, R., Newman, J. A., Faber, S. M., et al. 2006, ApJ, 648, 281
- Zolotov et al. (2015) Zolotov, A., Dekel, A., Mandelker, N., et al. 2015, MNRAS, 450, 2327