Vol.0 (201x) No.0, 000–000
Supernova decay of nuclides 53Fe, 54Fe, 55Fe, and 56Fe in strongly screened plasma∗ 00footnotetext:
Abstract
The electron screening strong effect on the electron energy and threshold energy of the beta decay reaction. in this paper, we study the decay rates of some iron isotopes. The electron screening beta decay rates increase by about two orders of magnitude. The strong screening beta decay rates due to Q-value correction are by more than one order of magnitude higher than those of without Q-value correction.
keywords:
physical data and processes: nuclear reactions, nucleosynthesis, abundances — stars: supernova1 Introduction
Beta decay plays a key role in presupernova evolution. The cooling rates and antineutrino energy loss are strongly affected by the beta-decay rates. Some authors (e.g., Fuller et al. 1980; Aufderheide et al. 1990, 1994; Langanke et al. 1998, Liu et al, 2012, 2013a, 2013b, 2013c, 2013d, 2013e, 2013f, 2014, 2015, 2016a, 2016b) did a lot on the beta decay and electron capture. However, the effect of SES on weak interaction are not included.
According to the linear response theory model (LRTM) and shell model Fermi theory, we studied the SES beta decay rates of nuclides 53Fe, 54Fe, 55Fe, and 56Fe in astrophysical environments, which are very important for numerical simulation of supernova explosions (e.g., Fuller et al. 1982; Aufderheide et al. 1990, 1993, 1994; Langanke et al. 2003; Domingo-Pardo et al. 2009). The article is organized as follows. In section 2, we studied the beta-decay rates by including and neglecting SES effect. In section 3, the results and discussions are presented. The conclusions are given in section 4.”
2 Study the decay
2.1 The beta decay in no SES
In no SES, the decay rates is given by (Fuller et al. 1980; Aufderheide et al. 1990, 1994; Liu 2016a).
| (1) |
where is the spin, and is excitation energies of the parent states. is the Boltzmann constant. is the comparative half-life connecting states of and , is the nuclear energy difference between the states of and . , and are the masses of the parent nucleus and the daughter nucleus, respectively, and , are the excitation energies of the th and th nuclear state. is the nuclear partition function.
The phase space integral for the decay is given by
| (2) |
where and are the electron momentum, mass, chemical potential and energy, respectively. is the Coulomb wave correction.
In no SES, a reasonable approximation for the electron chemical potential takes the form (e.g., Bludman et al. 1978)
| (3) |
According to discussions from Zhou & Li et al. (2017), the half-life has the labels
| (4) |
where is the fine structrue constant with . The correction factor will take the labels (e.g., Zhou & Li et al. 2017)
| (5) | |||||
where in Eqs.(4-5). In Eq.(4), the shell and pairing effect on the nuclear matrix elements, which reflect the main information of the nuclear structure. The factor is well described by (zhou & Li et al. 2017).
The Fermi and the Gamow-Teller matrix elements for decay is given by (e.g., Aufderheide et al. 1994)
| (6) | |||||
| (7) | |||||
where is the initial parent state and is the final daughter state. , and are the numbers of neutrons and protons within the , and shell, respectively.
The Shell Model Monte Carlo (SMMC) method is used to calculate the total amount of GT strength and the response function of an operator at an imaginary-time . is given by (e.g., Langanke et al. 1998; Langanke et al. 2003)
| (8) |
where and are energies corresponding to the final states and . The total strength for the operator is given by . The strength distribution is given by
| (9) | |||||
which is related to by a Laplace Transform, . Note that here is the energy transfer within the parent nucleus, and that the strength distribution has units of and , is the nuclear temperature.
2.2 The beta decay in SES
Electron screening for nuclear reactions in astrophysical environments plays an unexpected and important role in enhancing reaction cross sections. In our previous works (e.g., Liu. 2013d, 2016c, 2017a, 2017b), we discussed this interesting problem. Based on the linear response theory model (hereafter LRTM), Itoh et al.(2002) also studied the influence of the screening potential on the weak interaction. The electron is strongly degenerate in our considerable regime of the density-temperature, which is given by
| (10) |
here the electron Fermi temperature and the density are and (in units of ), respectively.
Jancovici et al. (1962) studied the static longitudinal dielectric function for relativistic degenerate electron liquid. The electron potential energy in SES is given by
| (11) |
where is Jancovici s static longitudinal dielectric function and is the electron Fermi wave-number.
For relativistic degenerate electrons and based on LRTM, the screening potential is calculated as
| (12) |
where the parameters , and are discussed by Itoh et al.(2002)in detail. The Eqs. (12, 14) are satisfied for , which fulfill in the pre-supernova environment.
When we take account into the influence of SES, the beta decay Q-value changes by (Fuller et al(1982))
| (13) |
Thus, the Q-value of beta decay changes from to .
We can not neglect its influence at high density when electron is strongly screened due to the screening energy is so high. The electron screening make electron energy increase from to beta decay. The screening also decreases the threshold energy from to , and corresponding to the SES model(I) and model(II). The SES model(I) and model(II) are corresponding to the case without and with the correction of Q-value. So the phase space integral replaces in Eq.(2) for the SES beta decay rates, and is calculated as
| (14) |
Therefore, according to Eq.(1), the beta decay rate in SES is given by
| (15) |
where the half-life is given by
| (16) |
We compare the results () in SES with those of the rates () without SES by defining an enhancement factors , which is given by
| (17) |
3 Numerical results and discussions
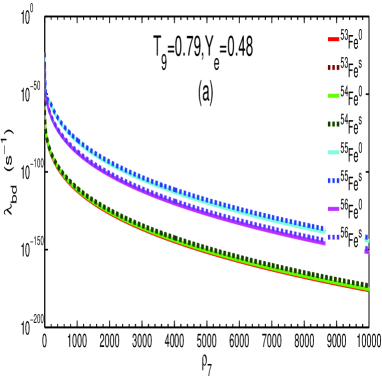
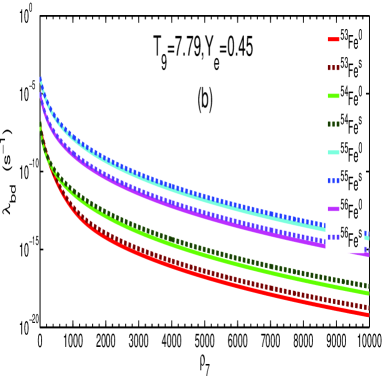
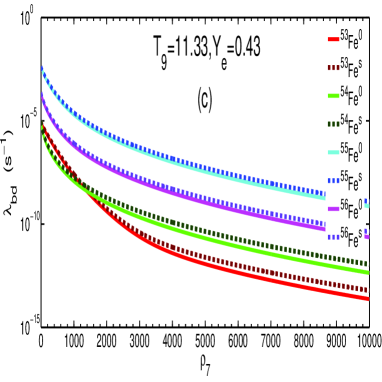
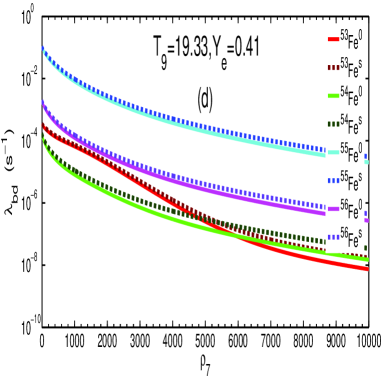
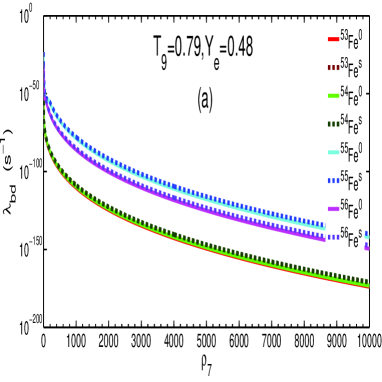
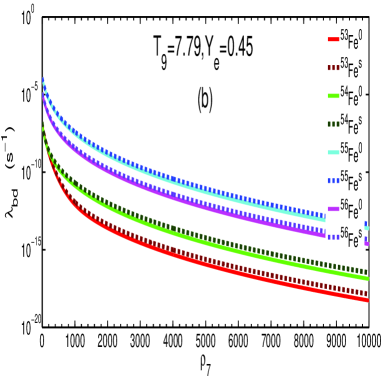
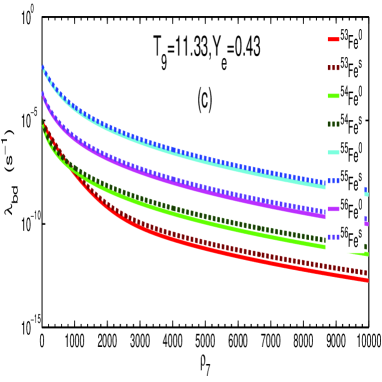
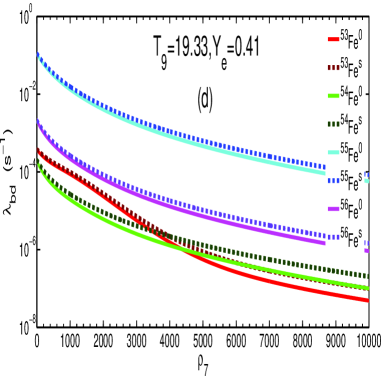
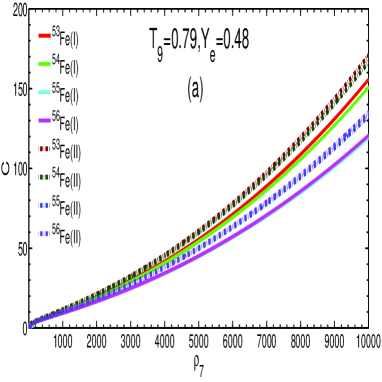
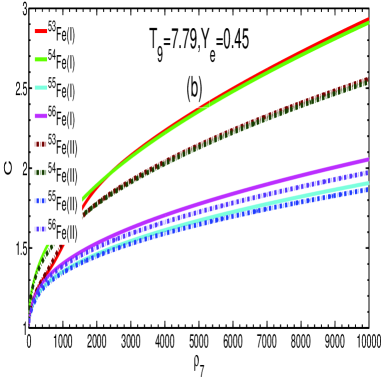
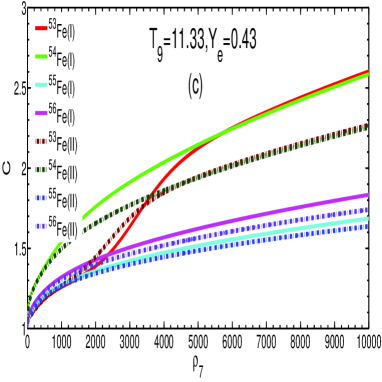
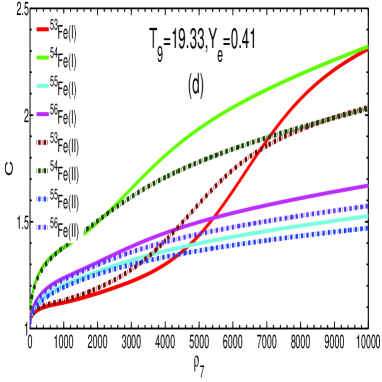
Based on proton-neutron quasi particle RPA model, Nabi(2010) investigated the beta decay rates in supernova. Under the same conditions, FFN (Fuller et al.1982) and Aufderheide et al. (1990, 1994) also discussed the beta rates. Their studies show that the beta decay rates play an important role in the core collapse calculations and evolution. However, they neglected the effect of SES on beta decay. Here based on LRTM, we discuss the beta decay for SES models (I) and (II). The model (I) and (II) are corresponding to the case without and with correction and correction of Q-value. Figure 1 and 2 presents the influences of density on beta decay rates of some iron group isotopes for the two SES models. The no SES and SES rates corresponded to solid and dotted line are compared. We detailed the GT transition contribution for beta decay according to SMMC method. For a given temperature, we find that the beta decay rates decrease by more than six orders of magnitude as the density increases. The strong screening rates always higher than those of no SES. For example, at the rates for 53Fe are and corresponding to those of no SES and SES for model (I) in Fig.1(b), but are and for model (II) in Fig.2(b). The SES beta decay rates of model (II) are by more than one order of magnitude higher than those of model (I).
Figure 3 shows the screening enhancement factors as a function of . Due to SES, the rates may increase by about two orders of magnitude. For instance, the screening enhancement factor increases from 11.55 to 170.8 when the density increases from to for 53Fe at for model (II)in Fig.3(a). The lower the temperature, the larger the effect of SES on beta decay rates is. One possible cause that the SES mainly increased the number of higher energy electrons. These electrons can actively join in the beta decay reaction. Moreover, the SES can also make the beta decay threshold energy greatly decrease. Thus, SES strong encourage the beta decay reactions. One also find that the SES enhancement factor of model (II) are higher than those of model (I). For example, at the screening factor for 53,54,55,56Fe is 88.09, 86.18, 70.11, 70.53 for model (I), and are 98.36, 95.89, 82.56, 84.12 for model (II) in Fig.3(a), respectively.
Table 1 and 2 show the screening enhancement factor at for model (I), and (II). From Table 1, the screening rates for 53,54,55,56Fe increase by a factor of 10.59, 10.43, 9.288, 9.349 at for model (I), and by a factor of 11.56, 11.46, 10.19, 10.32 for model (II), respectively. From Table 2, the screening rates for 53,54,55,56Fe increase by a factor of 155.7, 150.6, 118.9, 120.6 at for model (I), and by a factor of 170.8, 166.4, 132.2, 135.2 for model (II), respectively. But the difference of the screening enhancement factor between model (I), and (II) is small at the higher temperature. This is because that the higher the temperature, the larger the electron energy is for a given density. So the higher temperature weaken the effect of SES on beta decay.
The beta decay rates are strong depended on the decay Q-value. The higher the energy of outgoing electron, the larger the rates become when the electron energy is more than the threshold energy. When we take account the Q-value correction in model (II), according to Eq.(4), the half-life will increase as the the Q-value increase. The nuclear binding energy increases because of interactions with the dense electron gas in the plasma. The beta decay Q-value (), changes at high density due to the affect of the charge dependence of this binding. Based on Eq.(11), Q-value of beta decay decreases from to . Thus, the beta decay will increase due to correction of Q-value in model (II) according to Eq.(1) and Eq.(4).
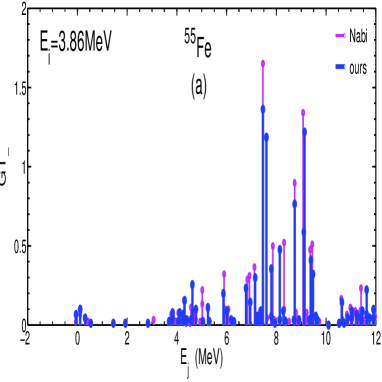
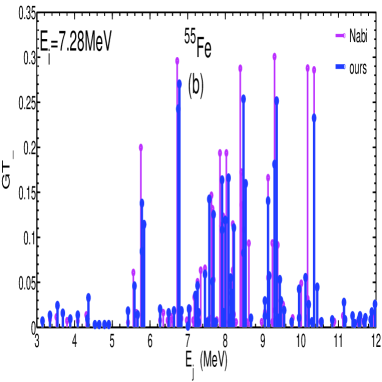
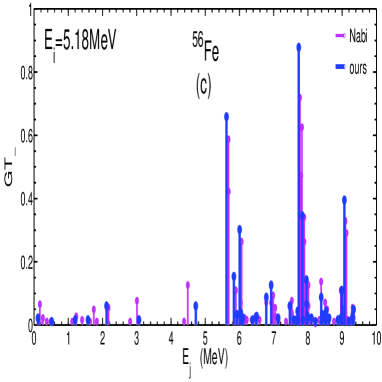
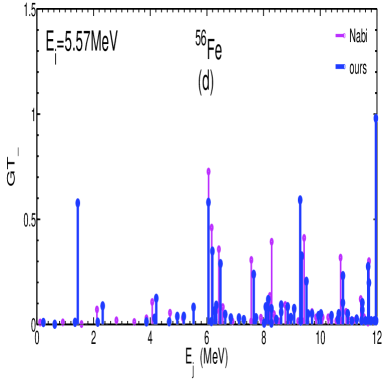
In supernova evolution the distributions of Gamow-Teller strength play a key role. As examples for the excited state GT distributions of 55,56Fe, Fig.4 presents some information about the comparison of our results by SMMC with those of Nabi (Nabi et al. 2010) for beta decay. We the first two excited state distributions are only shown. From fig. 4, one finds that our results of GT strength distributions calculated are lower than those of Nabi. For example, the distributions for 55Fe are 1.650MeV, 1.362MeV corresponding to Nabi’s and ours at , and are 0.7265MeV, 0.5865MeV for 56Fe at . Based the pn-QRPA theory, Nabi et al. (2010) analyzed nuclear excitation energy distribution by considering the particle emission processes. They calculated Gamow-Teller strength distribution and only discussed the low angular momentum states. By using the method of SMMC, actually we discuss GT intensity distribution and adopt an average distribution.
Synthesizes the above analysis, the charge screening strong effects the beta decay. The influence may be mainly come from following several factors. First, the electron Coulomb wave function is strongly changed by the screening potential in nuclear reactions. Second, the energy of outgoing electrons increases greatly due to the electron screening potential. Third, the energy of atomic nuclei also increases because of the electron screening (i.e., increases the single particle energy). Finally, the electron screening effectively make the number of the higher-energy electrons increase. So the electron energy is more than the threshold of beta decay. SES relatively decreases the threshold needed for beta decay.
| nuclei | |||||||||||
|---|---|---|---|---|---|---|---|---|---|---|---|
| 53Fe | 10.59 | 11.56 | 1.523 | 1.563 | 2.602 | 2.266 | 1.121 | 1.133 | |||
| 54Fe | 10.43 | 11.46 | 1.686 | 1.611 | 2.584 | 2.252 | 1.376 | 1.377 | |||
| 55Fe | 9.288 | 10.19 | 1.347 | 1.353 | 1.686 | 1.636 | 1.203 | 1.193 | |||
| 56Fe | 9.349 | 10.32 | 1.415 | 1.399 | 1.833 | 1.741 | 1.237 | 1.228 | |||
| nuclei | |||||||||||
|---|---|---|---|---|---|---|---|---|---|---|---|
| 53Fe | 155.7 | 170.8 | 2.931 | 2.566 | 1.258 | 1.267 | 2.320 | 2.034 | |||
| 54Fe | 150.6 | 166.7 | 2.911 | 2.539 | 1.542 | 1.497 | 2.332 | 2.028 | |||
| 55Fe | 118.9 | 132.8 | 1.905 | 1.866 | 1.273 | 1.264 | 1.526 | 1.470 | |||
| 56Fe | 120.6 | 135.2 | 2.055 | 1.972 | 1.321 | 1.306 | 1.669 | 1.573 | |||
4 Concluding remark
Based on LRTM and Fermi theory, we discuss the beta decay process for two typical SES models (i.e., model (I) and (II)). We detailed the GT transition contribution to the beta decay according to SMMC method. For a given temperature, the beta decay rates decrease by more than six orders of magnitude with the increasing of the density. The strong screening rates always higher than those of no SES. The SES beta decay rates of model (II) are by more than one order of magnitude higher than those of model (I). Our results show that the beta decay rates increase by about one order of magnitude due to SES. For instance, the screening enhancement factor increases from 11.55 to 170.8 when the density increases from to for 53Fe at for model (II). The beta decay rates and the antineutrino energy loss are quite relevant for numerical simulations of stellar thermal evolution. Our results may be helpful to the future studies of burst mechanism of supernova, and cooling numerical simulation.
Acknowledgements.
This work was supported in part by the National Natural Science Foundation of China under grants 11565020, and the Counterpart Foundation of Sanya under grant 2016PT43, the Special Foundation of Science and Technology Cooperation for Advanced Academy and Regional of Sanya under grant 2016YD28, the Scientific Research Starting Foundation for 515 Talented Project of Hainan Tropical Ocean University under grant RHDRC201701, and the Natural Science Foundation of Hainan Province under grant 114012.References
- [1990] Aufderheide, M. B., Brown, G. E., kuo, T. T. S., Stout, D. B., & Vogel, P., 1990, ApJ, 62, 241
- [1994] Aufderheide, M. B., Fushikii, I., Woosely, S. E., & Hartmanm, D. H.,, 1994, ApJS,, 91, 389
- [1993] Aufderheide, M. B., Bloom, S. D., Resler, D. A., Mathews, G. J., 1993, Phys.Rev. C, 91, 389
- [1978] Bludman S.A. and van Riper K.A. , 1978, Astrophys. J., 224, 631
- [2009] Domingo-Pardo, C., Dillmann, I., Faestermann, T., et al., 2009, Conference Proceedings, 1090, 230
- [1982] Fuller, G. M., Fowler, W. A., & Newman, M. J., 1982, ApJS, 48, 279
- [2001] Itoh, N., Tomizawa, N., Tamamura, M. et al., 2002, ApJ., 579, 380
- [1962] Jancovici, B., 1962, Nuovo Cimento, 25, 428
- [1998] Langanke, K., & Martinez-Pinedo, G., 1998, Phys. Lett. B, 436, 19
- [2003] Langanke, K.; Terasaki, J.; Nowacki, F.,et al.,2003, Phys.Rev. C, 67, 044314
- [2007] Liu, J. J. & Luo, Z. Q., 2007a, ChPhL, 24, 1861
- [2007] Liu, J. J. & Luo, Z. Q., 2007b, ChPhy,. 16, 3624
- [2007] Liu, J. J., Luo, Z. Q., Liu, H. L. & Lai, X. J., 2007c, IJMPA,. 22, 3305
- [2007] Liu, J. J. & Luo, Z. Q., 2007d, ChPhy, 16 2671
- [2008] Liu, J. J. & Luo, Z. Q., 2008a, ChPhC, 32, 617
- [2008] Liu, J. J. & Luo, Z. Q., 2008b, ChPhC, 32, 108
- [2008] Liu, J. J. & Luo, Z. Q., 2008c, CoTPh, 49, 239
- [2010] Liu, J. J., 2010a, ChPhC, 34, 171
- [2010] Liu, J. J., 2010b, ChPhC, 34, 1700
- [2011] Liu, J. J. & Kang, X. P. et al., 2011, ChPhC, 35, 243
- [2012] Liu, J. J., 2012, ChPhL,29,122301
- [2013] Liu, J. J., 2013a, Ap&SS,343, 117
- [2013] Liu, J. J., 2013b, Ap&SS,343, 579
- [2013] Liu, J. J., 2013c, RAA,13, 99
- [2013] Liu, J. J., 2013d, MNRAS., 433, 1108
- [2013] Liu J. J., 2013e, RAA., 13, 945
- [2013] Liu J. J., 2013f, Chin.Phys. C., 37, 085101
- [2013] Liu, J. J., 2014, MNRAS., 438, 390
- [2015] Liu, J. J., 2015, Ap&SS, 357, 93
- [2016] Liu, J. J., et al., 2016a, RAA, 16, 174
- [2016] Liu, J. J., et al., 2016b, ApJS, 224, 29
- [2016] Liu, J. J., et al., 2016c, RAA, 16, 83
- [2017] Liu, J. J., et al., 2017a, RAA, 17, 107, eprint arXiv:1707.03504
- [2017] Liu, J. J., et al., 2017b, ChPhC, 41, 5101
- [2010] Nabi, J-U., 2010, AdSpR, 46, 1191
- [2017] Zhou, Y., Li, Z. H., Wang, Y. B., et al., 2017, SCIENCE CHINA Physics, Mechanics & Astronomy.,10.1007/s11433-017-9045-0