PSR J1119–6127 and its pulsar wind nebula following the magnetar-like bursts
Abstract
We present a Chandra Director’s Discretionary Time observation of PSR J1119-6127 and its compact X-ray pulsar wind nebula (PWN) obtained on 27 October 2016, three months after the Fermi and Swift detection of millisecond bursts in hard X-rays, accompanied by 160 times increase in flux. This magnetar-like activity, the first observed from a rotation-powered radio pulsar, provides an important probe of the physical processes that differentiate radio pulsars from magnetars. The post-burst X-ray spectrum of the pulsar can be described by a single powerlaw model with a photon index of 2.00.2 and an unabsorbed flux of 5.710-12 ergs cm-2 s-1 in the 0.5–7.0 keV energy range. At the time of Chandra observations, the pulsar was still brighter by a factor of 22 in comparison with its quiescence. The X-ray images reveal a nebula brighter than in the pre-burst Chandra observations (from 2002 and 2004), with an unabsorbed flux of 2.210-13 ergs cm-2 s-1. This implies a current X-ray efficiency of 0.001 at a distance of 8.4 kpc. In addition, a faint torus-like structure is visible along the southeast-northwest direction and a jet-like feature perpendicular to the torus towards the southwest. The PWN is best fitted by an absorbed powerlaw with a photon index of 2.20.5 (post-burst). While the pulsar can still be energetically powered by rotation, the observed changes in PSR J1119–6127 and its PWN following the magnetar-like bursts point to an additional source of energy powered by its high-magnetic field.
Subject headings:
pulsars: individual (J1119–6127) — stars: neutron — X-rays: bursts1. Introduction
The radio pulsar J1119–6127, at the center of the supernova remnant (SNR) G292.2–0.5, was discovered in the Parkes multibeam 1.4 GHz pulsar survey with a spin period =408 ms, spin-down rate =410-12 s s-1, characteristic age 1.9 kyr, and spin-down luminosity =2.31036 ergs s-1 (Camilo et al. 2000). Its surface dipole magnetic field strength is =4.11013 G, close to the quantum critical field strength =4.41013 G, making PSR J1119–6127 a high-magnetic field pulsar. It has also shown sporadic, or rotating radio transient-like behavior, preceded by large amplitude glitch-induced changes in the spin-down parameters (Weltevrede et al. 2011).
The X-ray counterpart to the radio pulsar was first resolved with Chandra in 2002, providing the evidence for a compact pulsar wind nebula (PWN) of 36 in angular size (Gonzalez & Safi-Harb 2003). A follow up study performed with Chandra in 2004, combined with the 2002 observation, allowed for an imaging and spectroscopic study of the pulsar and PWN independently of each other (Safi-Harb & Kumar 2008). The PWN showed elongated jet-like features extending at least 7 north and south of the pulsar, and a longer southern jet becoming evident after accumulating 130 ks of combined Chandra data. The pulsar spectrum was described by a two-component model consisting of a powerlaw (PL) with photon index 1.9 and a thermal component, either a blackbody (BB) with temperature 0.21 keV or a neutron star atmospheric (NSA) model with 0.14 keV. The PWN spectrum was described by a nonthermal model with =1.1–1.4 (Safi-Harb & Kumar 2008). An XMM-Newton study of the pulsar revealed pulsations with an unusually high pulsed fraction of 7414% in the 0.5–2.0 keV energy range (Gonzalez et al. 2005). The profile is single-peaked and phase-aligned with its radio counterpart. No evidence of pulsations was detected above 2.5 keV (Ng et al. 2012). Gamma-ray pulsations were reported from PSR J1119–6127 using Fermi, making it the source with the highest inferred -field detected among -ray pulsars (Parent et al. 2011).
On 2016 July 27 and 28, PSR J1119–6127 exhibited two short (0.02–0.04 s), energetic hard X-ray bursts detected by the Fermi Gamma-ray Burst Monitor and Swift Burst Alert Telescope (Younes et al. 2016; Kennea et al. 2016; Göğüş et al. 2016). Using the Swift X-ray Telescope (XRT) and NuSTAR data, Archibald et al. (2016) reported a large glitch (/=5.74(8)10-6), pulsar flux increase by a factor 160 (0.5–10 keV), and the appearance of strong X-ray pulsations above 2.5 keV for the first time. On the other hand, the pulsed radio emission from PSR J1119–6127 disappeared after the onset of magnetar-like bursts, but reappeared two weeks later (Burgay et al. 2016a, 2016b; Majid et al. 2017). Using the Fermi Large Area Telescope data obtained from 2016 July 27–August 12, Younes et al. (2016) reported the lack of detection of -ray pulsations and derived an upper limit, consistent with the measured pre-burst -ray flux of the pulsar.
We requested a Chandra Director’s Discretionary Time observation to study the pulsar and, particularly, the effect of the magnetar-like bursts on its surrounding nebula. The superior angular resolution of Chandra is required to disentangle the emission of the pulsar and its compact PWN. Here, we present these results together with a reanalysis of the archived pre-burst Chandra observations. The distance to the PSR J1119–6127 is taken as 8.4 kpc from HI absorption measurements to the SNR (Caswell et al. 2004) and we scale all derived quantities in units of = kpc, where is the actual distance to the pulsar.
2. Observation and Data Reduction
We obtained new observations of PSR J11196127 on 2016 October 27 (ObsID 19690), three months after the reports of the magnetar-like bursts. We reprocessed all previous observations taken on 2004 November 2–3 (ObsID 6153), 2004 October 31–November 1 (ObsID 4676), and 2002 March 31 (ObsID 2833). The target was positioned at the aimpoint of the Advanced CCD Imaging Spectrometer (ACIS) in all four observations. The standard processing of the data was performed using the chandra_repro script in CIAO version 4.9111http://cxc.harvard.edu/ciao (CALDB v.4.7.6) to create new level 2 event files. The resulting effective exposure times were 55.5 ks, 18.9 ks, 60.5 ks, and 56.8 ks for ObsIDs 19690, 6153, 4676, and 2833, respectively. Throughout this paper, we refer to the 2002 and 2004 Chandra observations as ‘pre-burst’ and the data taken in 2016 as ‘post-burst’.
3. Imaging analysis
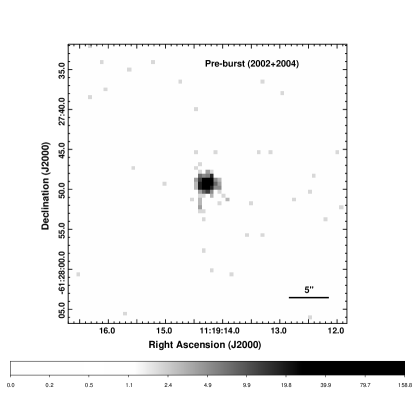
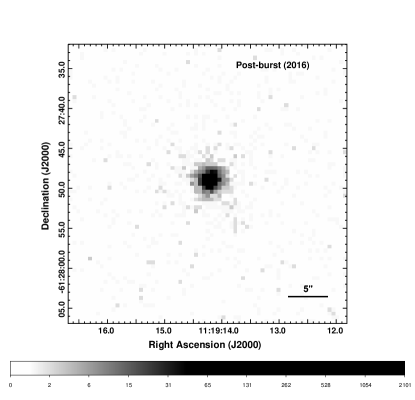
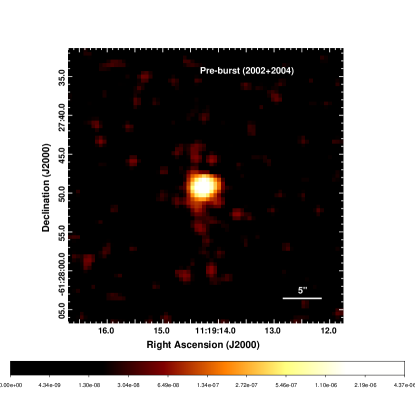
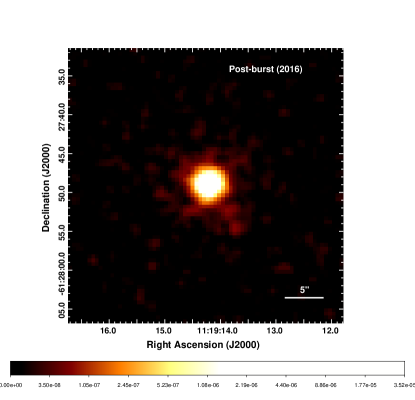
Figure 1 shows the broadband (0.5–7.0 keV) pre-burst (left) and post-burst (right) zoomed-in raw, unsmoothed (top) and exposure corrected, smoothed (bottom) images of the region around PSR J1119–6127, centered on the pulsar coordinates at =11h19m14260 and =61°27′4930. The bottom-panel images have been exposure-corrected using the CIAO task fluximage with a binsize of 1 pixel and smoothed using a Gaussian function of radius 2 pixels. The pre-burst image shows a nebula of size 615 in the north-south direction (Safi-Harb & Kumar 2008) while the post-burst image shows small-scale fine structures around the pulsar. The post-burst PWN morphology along the southeast–northwest direction can be considered as an equatorial torus 10025 in size, running perpendicular to the small jet-like structure 1535 southwest of the pulsar. The overall PWN is titled at an angle of 35–40 towards the west. A detailed spatially resolved imaging or spectroscopic study of the PWN structures is not possible with the current data due to the paucity of photon counts.
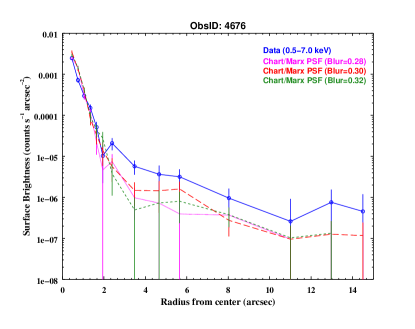
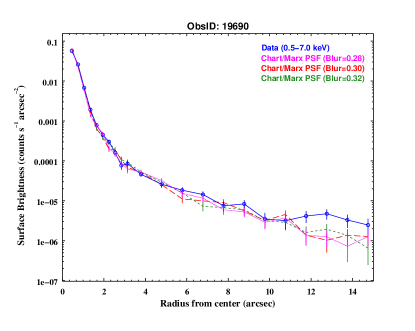
To further constrain the morphology of the diffuse emission around the pulsar at small angular scales and to probe the pulsar extent, we used the Chandra Ray Tracer (ChaRT222http://cxc.harvard.edu/ciao/PSFs/chart2/index.html) and MARX333http://space.mit.edu/CXC/MARX/ (ver. 5.3.2) software packages. The point spread functions (PSFs) were simulated using the best-fit pulsar spectrum (see Section 4) and ChaRT for each observation. The ChaRT output was then supplied to MARX to produce the simulated event files and PSF images. Different values (0.25, 0.28, 0.30, 0.32, 0.35) of the AspectBlur parameter (which accounts for the known uncertainty in the determination of the aspect solution) were used to search for an excess corresponding to the extended emission. We created broadband (0.5–7.0 keV) radial profiles up to 15 by extracting net counts in circular annuli centered on the point source, with an annular background from 30–40, and rebinned the data to obtain better statistical precision. Figure 2 shows a comparison of the surface brightness profiles for the pre-burst (ObsID 4676) and post-burst (ObsID 19690) data with the profiles generated with ChaRT/MARX for different blur values. The data show some slight excess compared to the simulated profiles beyond a radius of 15 for both the pre-burst and post-burst observations, although excess is clearly seen only beyond 11 for the post-burst data.
We performed spatial fitting on the 0.5–7.0 keV pulsar image to study the morphology of the extended emission quantitatively with Sherpa444http://cxc.harvard.edu/sherpa/. The ChaRT/MARX generated PSF was loaded as a table model to be used as a convolution kernel for the point source emission. The multi-component source model in Sherpa included a 2D Beta model (beta2d) for describing the extended component of the source emission, a PSF-convolved 2D Gaussian model (gauss2d) to describe the point source component, and a const2d model to describe the constant background level contributing to the total emission. The best-fit parameters were determined by the C-statistic and Nelder-Mead optimization method. We obtained a diffuse emission radius of 10.31.2 and 6.20.8 for the post-burst and pre-burst data, respectively, in comparison with the point source full-width half maximum (FWHM) of 12, suggesting an expansion of the nebula.
4. Spectral analysis
The spectral analysis was performed using the X-ray spectral fitting package, XSPEC version 12.9.1, and restricted to 0.5–7.0 keV as these energy bands were not background dominated. The contributions from background point sources were removed prior to the extraction of spectra. All the spectra extracted were grouped by a minimum of 10 counts per bin and the errors were calculated at the 90% confidence level.
4.1. Pulsar spectrum
For a point source observed on-axis with Chandra, 90% of the encircled energy lies within 12 at 1.49 keV and within 25 at 6.4 keV555http://cxc.harvard.edu/proposer/POG/html/chap6.html. Guided by the radial profile plots (Figure 2), 90% encircled energy fraction, and sherpa modelling, we here consider 15 as the best extraction radius for the pulsar. We chose an annular ring of 3–5 centered on the pulsar as background, to minimize the contamination from the surrounding PWN. Due to the evidence of pulsar brightening in the post-burst data, we investigated the possibility of pileup using the CIAO task pileup_map666http://cxc.harvard.edu/ciao/ahelp/pileup_map.html.. We obtained an average of 0.2 photons per frame of 3.2 s in the centermost pixel of the post-burst pulsar image, which translates into a pileup fraction of 10%. For a quantitative estimate of the post-burst pulsar spectrum, we used the jdpileup model of the Chandra spectral fitting software Sherpa convolved with an absorbed PL and BB model, which gave a pileup fraction of 5.2% and 21% for the two models, respectively. The pre-burst data did not show any evidence of pileup.
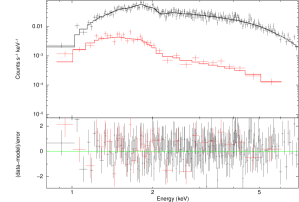
The post-burst pulsar spectrum was first fit with different one- and two-component models. A PL model yielded a better fit (/dof=0.906/291) with =1.71022 cm-2 and =1.8, while the BB model gave a low =0.71022 cm-2 and =1.0 keV for /dof=1.437/291, with excess emission seen above 3 keV. The addition of a second component was statistically not required for a single PL model, but the fit improved when a PL component was added to the BB model with =1.61022 cm-2, =0.40.1 keV, and =1.5 for /dof=0.892/289. We next fitted the spectra by including a pileup component to the PL and BB models, and the results are shown in Table 1. The pre-burst spectrum of the pulsar was also explored with different models, and as elaborated in Safi-Harb & Kumar (2008), a two-component BB+PL model best described the pulsar spectra (Table 1). Figure 3 (left) shows the best-fit post-burst (PL; black) and pre-burst (BB+PL; red) pulsar spectra. To better evaluate the contamination in the spectra from the surrounding PWN, the pulsar spectra were explored using larger extraction radii of 20 and 25 and we obtained similar spectral parameters as for the 15 region.
4.2. PWN spectrum
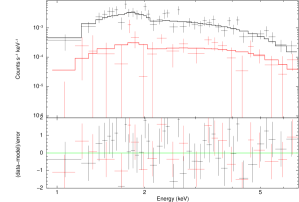
We extracted an annular ring of 2–10 region for the overall PWN to determine any spectral variations in the PWN between the epochs, following the imaging analysis and sherpa modelling results. The background was extracted from a nearby source-free elliptical region777The spectral fits were explored with different annular and elliptical backgrounds and binning, and the spectral parameters were consistent within uncertainties to those shown in Table 1.. All the extracted regions were simultaneously fit with a PL model by tying together. Figure 3 (right) and Table 1 show the best-fit model and spectral parameters for the PWN. The pre-burst spectral fit results obtained here are consistent with the results for the 615 region presented in Safi-Harb & Kumar (2008).
| Parameter | Pulsar | PWN | |||
| Pre-burst | Post-burst | Pre-burst | Post-burst | ||
| BB+PL | pileup*PL | pileup*BB | PL | PL | |
| ( cm-2) | 1.6 | 1.80.2 | 1.10.1 | 1.8 | |
| \cdashline5-6 | 2.0 | 2.00.2 | 1.20.8 | 2.20.5 | |
| kT (keV) | 0.20.1 | 0.70.1 | |||
| (PL)a | 7.410-14 | 5.710-12 | 2.310-14 | 2.210-13 | |
| (BB)a | 1.810-13 | 1.110-11 | |||
| /dof | 1.008/60 | 0.893/289 | 0.988/289 | 0.912/57 | |
| \cdashline5-6 Count rateb | (4.80.3)10-3 | (1.080.01)10-1 | (8.32.3)10-4 | (6.90.4)10-3 | |
| \cdashline3-4 c | 2.21033 | 4.81034 | 9.31034 | 1.91032 | 1.91033 |
| =/ | 0.001 | 0.02 | 0.04 | 0.0001 | 0.001 |
5. Discussion and conclusion
The high-magnetic field () pulsars are believed to be an important class of objects for studying the relationship between magnetars and radio pulsars. Seven high- pulsars have been identified so far. These include the radio pulsars J1119–6127, J1718–3718, J1734–3333, J1814–1744, J1847–0130, the X-ray pulsar J1846–0258, and the rotating radio transient J1819–1458 (Ng & Kaspi 2011). Based on the X-ray observations of PSR J1718–3718, Kaspi & McLaughlin (2005) suggested that high- pulsars may be quiescent magnetars. The first evidence for such a link was found when PSR J18460258 in SNR Kes 75 showed magnetar-like bursts and radiative changes such as a flux increase and spectral softening in X-rays (Gavriil et al. 2008; Kumar & Safi-Harb 2008). PSR J1119–6127 is the first radio pulsar, and the second high- pulsar, to display a magnetar-like burst. Here, we present a discussion of the results from our pre-burst and post-burst study on PSR J1119–6127 and its compact nebula.
The Chandra observations of PSR J1119–6127, made three months after its magnetar-like bursts, can be described by a single PL (=2.00.2) or BB (=0.70.1 keV) model with pileup, in contrast to its quiescent spectrum, which required a combination of PL and BB models. Here, we prefer a PL model over a BB model for the post-burst pulsar data due to the following reasons. Firstly, the pileup fraction required to fit the spectrum with a BB model is much higher than a PL model, suggesting that a BB fit is only possible if a large pileup fraction absorbs high-energy photons that are better fit with a PL tail. Secondly, the obtained from a BB model is much lower compared to that obtained for the pulsar and its PWN (Table 1), as well as from the SNR diffuse emission regions immediately surrounding the pulsar (Kumar et al. 2012). Thirdly, when the post-burst pulsar spectrum was fitted with a BB+PL model (although a second component was not statistically required), we find that 85% of the total unabsorbed flux is dominated by the nonthermal component. These results, together with the fact that the pulsar’s emission beyond 3 keV could not be described by a BB model alone, imply that the X-ray emission in the post-burst state is mainly magnetospheric in nature. Assuming isotropic emission, the pulsar’s luminosity =44.81034 ergs s-1, implying an X-ray efficiency =0.02 in the 0.5–7.0 keV energy range. It is interesting to note that the pulsar’s is less than 1 during its magnetar-like burst, indicating that its spin-down energy could still power the X-ray emission. Magnetar bursts are usually accompanied by dramatic changes in the persistent emission properties and spectral evolution, such as hardening/softening, change in pulsed fraction, pulse profiles, flux changes etc. (Rea & Esposito 2011). The burst-induced radiative changes observed for PSR J11119–6127 are very similar to those seen in magnetars, suggesting an activity associated with the pulsar’s high-magnetic field. Such results have been found in the case of PSR J1846–0258 as well, further implying that the high- pulsars could be powered by both rotational and magnetic energy (Camilo 2008).
The pulsar’s pre-burst data showed a compact PWN of size 615, while we see a change in the PWN morphology with faint tori and jet-like features surrounding the pulsar in the post-burst data. In the 92 days that elapsed from the detection of the first burst to the Chandra observation, the maximum distance the ejected particles could have traveled, assuming an 8.4 kpc distance and a speed of light velocity, is 19. Therefore, the new extended feature of 10 radius cannot be associated with the recent burst unless the distance to the pulsar is overestimated by at least an order of magnitude. The PWN spectrum also showed a change in photon index from 1.20.8 to 2.20.5 following the burst, although not unusual since the X-ray spectra of most PWNe have =1–2.5 (Kargaltsev & Pavlov 2008). The post-burst X-ray luminosity of the PWN is 1.91033 ergs s-1 (0.5–7.0 keV), implying an X-ray efficiency 0.001, consistent with the typical values of 10-5 to 10-1 observed in other rotation-powered pulsars with PWNe (Kargaltsev & Pavlov 2008). The flux from the compact nebula has also increased by an order of magnitude in comparison with the pulsar’s quiescent state, consistent with the pre-burst and post-burst surface brightness profiles (Figures 1 and 2). Although small-scale variabilities in PWN structures are seen in many nebulae, the changes as observed in PSR J1119–6127 are difficult to interpret in terms of spin-down energy alone.
| Pulsar | P | Distance | / | Ref. | ||||
|---|---|---|---|---|---|---|---|---|
| (s) | (1013 G) | (kpc) | (ergs s-1) | |||||
| PSR J1119–6127a | 0.408 | 4.1 | 8.4 | 2.31036 | 2.00.2 | 0.001 | This work | |
| PSR J1819–1458 | 4.26 | 5.0 | 3.6 | 3.01032 | 3.70.3 | 0.15 | Rea et al. 2009; Camero-Arranz et al. 2013 | |
| Swift J1834.9–0846 | 2.48 | 14 | 4.0 | 2.11034 | 2.20.2 | 0.1 | Younes et al. 2016 | |
| PSR J1846–0258 | 0.324 | 4.9 | 6.0 | 8.11036 | 1.930.03 | 0.02 | Kumar & Safi-Harb 2008; Ng et al. 2008 | |
| SGR J1935+2154b | 3.24 | 22 | 11.7 | 1.71034 | 3.80.3 | 0.35 | Israel et al. 2016; Surnis et al. 2016 |
It has been proposed that magnetars can produce relativistic particle outflows during an outburst or from a steady flux of Alfvén waves powering a wind nebula (Thompson & Duncan 1996; Harding 1999). Signatures of X-ray emission from a wind nebula have been reported in a few high- pulsars and magnetars such as PSR J1846–0258, PSR J1819–1458, Swift J1834.9–0846, and SGR J1935+2154 (Safi-Harb 2013). Table 2 summarizes the X-ray properties of PWNe observed around these highly magnetized neutron stars. PSR J1846–0258, which features a very prominent X-ray nebula, showed small-scale variability in its PWN after its magnetar-like bursts in 2006 (Ng et al. 2008; Kumar & Safi-Harb 2008). For the extended emission around the PSR J1819–1458 (Rea et al. 2009; Camero-Arranz et al. 2013), Swift J1834.9–0846 (Kargaltsev et al. 2012; Esposito et al. 2013), and SGR J1935+2154 (Israel et al. 2016), the authors favor a PWN or a scattering halo origin. Bright X-ray sources with large column densities can lead to an extended dust scattering halo, with the halo brightness proportional to the source flux (Predehl & Schmitt 1995). The diffuse emission region around Swift J1834.9–0846 has been identified as an inner symmetric region (50) of scattering halo and an outer asymmetric region (150) of a possible magnetar wind nebula, since the emission remained fairly constant in flux and spectral shape across three years (Younes et al. 2012, 2016).
A detailed investigation of a halo component associated with PSR J1119–6127’s magnetar-like burst would require modeling beyond the scope of this Letter. However, for a dust scattering halo, one would expect to find symmetric structures around the point source with a relatively steeper (softer) photon index than the source as the scattering cross-section varies with the inverse-square of the energy. The fact that the compact PWN has an asymmetric structure (Figure 1), with a hard spectral index (2.20.5) comparable to that of the pulsar (2.00.2) does support a PWN interpretation. We further note that the spectral index of PSR J1119–6127 is also harder than the other magnetars associated with dust scattering haloes. Israel et al. (2016) suggests that the extended emission seen around SGR 1935+2154, with a =3.80.3, could also be magnetically powered due to its unusually high X-ray efficiency. From Table 2, we see that the X-ray efficiency is much less than 1 for PSR J1119–6127, but its photon index is comparable to the magnetically powered nebula around Swift J1834.9–0846 (=2.20.2). Despite some similarities in properties, none of other PWNe exhibited any notable change in morphology or spectrum as seen for PSR J1119–6127.
In summary, while the PWN in PSR J1119–6127 can still be energetically powered by its spin-down power, the changes observed in the PWN spectrum point towards a new source of energy powered by the magnetar bursts. The change in PWN morphology could be somewhat related to the recent bursts, but the large scale changes must have happened over longer timescales and could perhaps be related to an earlier undetected burst. Unfortunately, the spacing between observations is insufficient to make firm conclusions about the timescale of these changes. We cannot rule out a dust scattering halo component for PSR J1119–6127, but require additional deeper observations at different epochs to separate any halo component and confirm the nature of the PWN emission and its morphology post-burst.
References
- (1) Archibald, R. F., Kaspi, V. M., Tendulkar, S. P., & Scholz, P. 2016, ApJL, 829, L21
- (2) Burgay, M., Possenti, A., Kerr, M., et al. 2016a, The Astronomer’s Telegram, 9286
- (3) Burgay, M., Possenti, A., Kerr, M., et al. 2016b, The Astronomer’s Telegram, 9366
- (4) Camilo, F., Kaspi, V. M., Lyne, A. G., Manchester, R. N., Bell, J. F., D’Amico, N., McKay, N. P. F., & Crawford, F. 2000, ApJ, 541, 367
- (5) Camilo, F. 2008, Nature Physics, 4, 353
- (6) Camero-Arranz A., Rea, N., Bucciantini, N., et al. 2013, MNRAS, 429, 2493
- (7) Caswell, J. L., McClure-Griffiths, N. M., & Cheung, M. C. M. 2004, MNRAS, 352, 1405
- (8) Esposito, P., Tiengo, A., Rea, N., et al. 2013, MNRAS, 429, 3123
- (9) Gavriil, F. P., Gonzalez, M. E., Gotthelf, E. V., Kaspi, V. M., Livingstone, M. A., & Woods, P. M. 2008, Science, 319, 1802
- (10) Göğüş, E., Lin, L., Kaneko, Y., et al. 2016, ApJL, 829, L25
- (11) Gonzalez, M. E., & Safi-Harb, S. 2003, ApJL, 591, L143
- (12) Gonzalez, M. E., Kaspi, V. M., Camilo, F., Gaensler, B. M., & Pivovaroff, M. J. 2005, ApJ, 630, 489
- (13) Harding, A., Contopoulos, I., Kazanas, D. 1999, ApJL, 525, L125
- (14) Israel, G. L., Esposito, P., Rea, N., et al., 2016, MNRAS, 547, 3448
- (15) Kargaltsev, O. & Pavlov, G. G. 2008, AIP Conference Proceedings, Volume 983, 171
- (16) Kargaltsev, O., Kouveliotou, C., Pavlov, G. G., et al. 2012, ApJ, 748, 26
- (17) Kaspi, V. M., & McLaughlin, M. A. 2005, ApJL, 618, L41
- (18) Kennea, J. A., Lien, A. Y., Marshall, F. E., et al. 2016, GRB Coordinates Network, 19735
- (19) Kuiper, L., Hermsen, W., Den Hartog, P. R., & Collmar, W. 2006, ApJ, 645, 556
- (20) Kumar, H. S. & Safi-Harb, S. 2008, ApJ, 678, L43
- (21) Kumar, H. S., Safi-Harb, S., & Gonzalez, M. E. 2012, ApJ, 754, 96
- (22) Majid, M. A., Pearlman, A. B., Dobreva, T., Horiuchi, S., Kocz, J., Lippuner, J., & Prince, T. A. 2017, ApJL, 834, 2
- (23) Predehl, P., & Schmitt, J. H. M. M. 1995, A&A, 293, 889
- (24) Ng, C.-Y., Slane, P. O., Gaensler, B. M. & Hughes, J. P. 2008, ApJ, 686, 508
- (25) Ng, C. -Y., & Kaspi, V. M. 2011, AIP Conference Proceedings, Volume 1379, 60
- (26) Ng, C.-Y., Kaspi, V. M., Ho, W. C. G., et al. 2012, ApJ, 761, 65
- (27) Parent, D., Kerr, M., den Hartog, P. R., et al. 2011, ApJ, 743
- (28) Rea, N., McLaughlin, M. A., Gaensler, B. M., et al. 2009, ApJ, 703, L41
- (29) Rea, N., & Esposito, P. 2011, Astrophysics and Space Science Proceedings, 21, 247
- (30) Safi-Harb, S. & Kumar, H. S. 2008, ApJ, 684, 532
- (31) Safi-Harb, S. 2013, Proceedings of the International Astronomical Union, Volume 291, 251
- (32) Surnis, M. P., Joshi, B. C., Maan, Y., Krishnakumar, M. A., Manoharan, P. K., and Naidu, A. 2016, ApJ, 826, 184
- (33) Thompson, C. & Duncan, R. C. 1996, ApJ, 473, 322
- (34) Wilms J., Allen A., & McCray R. 2000, ApJ, 542, 914
- (35) Weltevrede, P., Johnston, S. & Espinoza, C. M. 2011, MNRAS, 411, 1917
- (36) Younes, G., Kouveliotou, C., Kargaltsev, O., et al. 2012, ApJ, 757, 39
- (37) Younes, G., Kouveliotou, C., Kargaltsev, O., et al., 2016, ApJ, 824, 138
- (38) Younes, G., Kouveliotou, C., & Roberts, O. 2016, GRB Coordinates Network, 19736