0cm \DeclareCaptionTypeSI-figure[Fig.] \addtokomafontpagenumber
This manuscript is the pre-submission manuscript provided by the authors.
For the final, post-review version, please see:
http://www.nature.com/nature/journal/vaap/ncurrent/full/nature24647.html
Discovery of a big void in Khufu’s Pyramid by observation of cosmic-ray muons
Kunihiro Morishima1, Mitsuaki Kuno1, Akira Nishio1, Nobuko Kitagawa1, Yuta Manabe1, Masaki Moto1 — Fumihiko Takasaki2, Hirofumi Fujii2, Kotaro Satoh2, Hideyo Kodama2, Kohei Hayashi2, Shigeru Odaka2 — Sébastien Procureur3, David Attié3, Simon Bouteille3, Denis Calvet3, Christopher Filosa3, Patrick Magnier3, Irakli Mandjavidze3, Marc Riallot3 — Benoit Marini5, Pierre Gable7, Yoshikatsu Date8, Makiko Sugiura9, Yasser Elshayeb4, Tamer Elnady10, Mustapha Ezzy4, Emmanuel Guerriero7, Vincent Steiger5, Nicolas Serikoff5, Jean-Baptiste Mouret11, Bernard Charlès6, Hany Helal4,5, Mehdi Tayoubi5,6
Corresponding Authors: Kunihiro Morishima (morishima@flab.phys.nagoya-u.ac.jp) and Mehdi Tayoubi (tayoubi@hip.institute)
1F-lab, Nagoya University. Furo-cho, Chikusa-ku, Nagoya, 464-8602, Japan — 2KEK,1-1 oho, Tsukuba, Ibaraki 305-0801 Japan — 3 IRFU, CEA, Université Paris Saclay, 91191 Gif-sur-Yvette, France — 4 Cairo University, 9 Al Gameya, Oula, Giza Governorate, Egypt — 5HIP Institute, 50 rue de Rome 75008 Paris, France — 6Dassault Systèmes, 10 Rue Marcel Dassault, 78140 Vélizy-Villacoublay, France — 7 Emissive, 71 rue de Provence 75009 Paris, France — 8 NEP, 4-14 Kamiyama-cho, Shibuya-ku,Tokyo 150-0047, Japan — 9Suave images, N-2 Maison de Shino, 3-30-8 Kamineguro, Meguro-Ku, Tokyo, 153-0051, Japan — 10Ain Shams University, Kasr el-Zaafaran, Abbasiya, Cairo, Egypt — 11Inria Nancy - Grand Est, 615 rue du Jardin Botanique, Villers-lès-Nancy, 54600, France
The Great Pyramid or Khufu’s Pyramid was built on the Giza Plateau (Egypt) during the IVth dynasty by the pharaoh Khufu (Cheops), who reigned from 2509 to 2483 BC1. Despite being one of the oldest and largest monuments on Earth, there is no consensus about how it was built2,3. To better understand its internal structure, we imaged the pyramid using muons, which are by-products of cosmic rays that are only partially absorbed by stone4,5,6. The resulting cosmic-ray muon radiography allows us to visualize the known and potentially unknown voids in the pyramid in a non-invasive way. Here we report the discovery of a large void (with a cross section similar to the Grand Gallery and a length of 30 m minimum) above the Grand Gallery, which constitutes the first major inner structure found in the Great Pyramid since the 19th century1. This void, named ScanPyramids Big Void, was first observed with nuclear emulsion films7,8,9 installed in the Queen’s chamber (Nagoya University), then confirmed with scintillator hodoscopes10,11 set up in the same chamber (KEK) and re-confirmed with gas detectors12 outside of the pyramid (CEA). This large void has therefore been detected with a high confidence by three different muon detection technologies and three independent analyses. These results constitute a breakthrough for the understanding of Khufu’s Pyramid and its internal structure. While there is currently no information about the role of this void, these findings show how modern particle physics can shed new light on the world’s archaeological heritage.
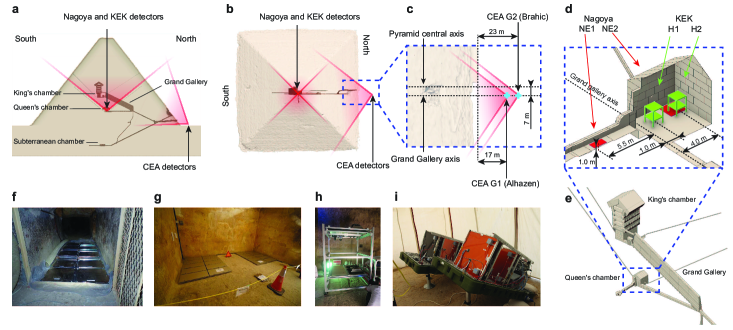
The pyramid of Khufu is 139 m high and 230 m wide1,13. There are three known chambers (Fig. 1), at different heights of the pyramid, which all lie in the north-south vertical plane1: the subterranean chamber, the Queen’s chamber, and the King’s chamber. These chambers are connected by several corridors, the most notable one being the Grand Gallery (8.6 m high × 46.7 m long × 2.1 to 1.0 m wide). The Queen’s chamber and the King’s chamber possess two “air shafts” each, which were mapped by a series of robots14,15 between 1990 and 2010. The original entrance is believed to be the “descending corridor”, which starts from the North face, but today tourists enter the pyramid via a tunnel attributed to Caliph al-Ma’mun’s (around AD 820)1.
Most of the current understanding of Khufu’s Pyramid comes from architectural surveys and comparative studies with other pyramids1,2,13. In Histories, Herodotus described the construction of Khufu’s Pyramid, but this account was written about 2,000 years later (in 440 BC). The only known documents written during Khufu’s reign were discovered in 201316, but these papyri describe only the logistics of the construction, such as how the stones were transported, and not the construction itself. In 1986, a team surveyed the pyramid using microgravimetry17, that is, the measurement of slight variations in gravity due to large variations in the amount of matter18. Based on these data, the team drilled 3 holes in the corridor to the Queen’s chamber in the hope of finding a “hidden chamber”; the team only observed sand17. A more recent analysis of the same data dismissed the theory of a “hidden chamber” where the holes had been drilled17.In 1988, a Ground-Penetrating Radar survey19 suggested that an unknown corridor could be parallel to the Queen’s chamber corridor. To our knowledge, this theory has been neither confirmed nor refuted.
Here we follow in the footsteps of Alvarez et al.5 who used spark chambers as muon detectors in Khafre’s pyramid (Kephren) and concluded that there is no unknown structure with a volume similar to the King’s chamber above the Belzoni chamber5. Muon particles originate from the interactions of cosmic rays with the atoms of the upper atmosphere, and they continuously reach the Earth with a speed near to that of light and a flux of around 10,000 per m2per minute4. Similar to X-rays which can penetrate the body and allow bone imaging, these elementary particles can keep a quasi-linear trajectory while going through hundreds of meters of stone before decaying or being absorbed. By recording the position and the direction of each muon that traverses their detection surface, muon detectors can distinguish cavities from stones: while muons cross cavities with practically no interactions, they can be absorbed or deflected by stones. Put differently, muons traversing a region with lower-than-expected density will result in a higher-than-expected flux in the direction of the region. In the recent years, muon detectors have been successfully deployed in particle accelerators, in volcanology6, to visualize the inner structure of the Fukushima’s nuclear reactor11,20, and for homeland security21. In heritage buildings, detectors have been recently set up in archaeological sites near Rome22 and Naples23 (Italy), where they were able to detect some known structures from underground, and in the Teotihuacan Pyramid of the Sun (Mexico)24. However, since the muons generated by cosmic rays come from the sky, the detectors can only detect density variations in some solid angle above them (the exact acceptance depends on the detection technology). In addition, the muon imaging technique measures the average density of the structure in a given direction: while a void results in a lower density, its impact on the muon radiography is determined by the ratio between the void and the length of material that is traversed. For this reason, small cavities like air shafts cannot be detected by this technique within a reasonable exposure time. Lastly, in large and dense buildings like Khufu’s Pyramid where only about 1% of muons reach the detectors, the data need to be accumulated over several months.
We first installed nuclear emulsion films (Fig. 1f-g), developed by Nagoya University, because they are compact and do not require electric power, which makes them well suited for installation in the pyramid (Extended Data Table 1). A nuclear emulsion film is a special photographic film that can detect muon trajectories in three-dimensional images with sub-micrometric accuracy7,8,9. In these experiments, we used unit films of 30 × 25 cm2and covered a maximum 8 m2 at a time. Each film has a 70 microns thick emulsion coating on both sides of a 175 microns thick transparent plastic base (Methods). The muon measurement accuracy is around 1 micron in position and around 1.8 mrad (~0.1degree) for vertical track by using the information obtained with one film (Extended Data Table 1).
The films were installed near the south-west corner of the Queen’s chamber (position NE2, Fig. 1d) and in the adjacent narrow hand-excavated corridor called “Niche” (position NE1, Fig 1d) on the east side of the Queen’s chamber. The distance between the centres of these two detectors is about 10 m on average, which allows us to perform a stereo analysis of the detected structures. The exposure started in December 2015. During the exposure, we modified the film configuration several times when we changed the films (every two months on average); only a subset of the full dataset was used for this analysis to mitigate the effect of the parallax on the resolution (Extended Data Table 1 and Methods). After each exposure, the nuclear emulsion films were processed by photographic development in the dark room of the Grand Egyptian Museum Conservation Center. After the development, they were transported to Nagoya University and read-out by an automated nuclear emulsion scanning system25,26,27.
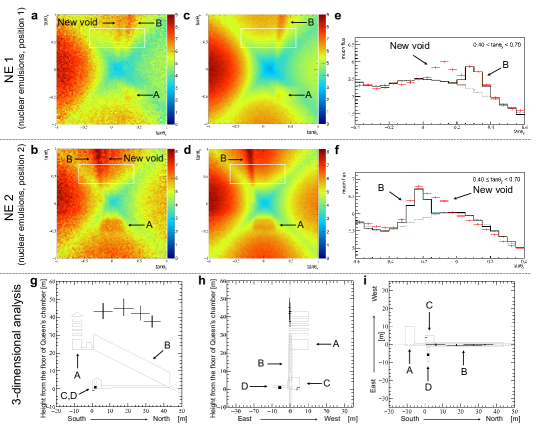
We compared the resulting muon radiographs (Fig. 2a,b) with the expected results computed using Monte Carlo simulation that include known structures inside the observation region (Fig. 2c,d). These comparisons clearly show that the large known structures (the Grand Gallery and the King’s chamber) are observed by the measurements and the results match the expectation (Fig. 2a-d). However, from the two positions, we also detected an unexpected and significant excess of muons in a region almost parallel to the image of the Grand Gallery. Statistical significance of the excess is higher than 10 sigma at the highest difference direction (Fig. 2c). The muon excess is similar to the one generated by the Grand Gallery, which means that the volume of the two voids is of the same order (Fig. 2e,f and Extended Data Fig. 2). We then performed a triangulation using the data from the two positions and four points along the new void (Methods). The results show that the new void has an estimated length of more than 30 m and is located between 40 m and 50 m away from the detector positions, 21 m above the ground level.
The second detection technology, designed by KEK, is composed of four layers of scintillator hodoscopes arranged in two units of double orthogonal layers10,11 (Fig. 1h). Each layer is composed of 120 plastic scintillator bars measuring 1×1 cm2 in cross section to cover an area of 120 × 120 cm2. Two units are vertically separated to allow the measurement of the two-dimensional incoming direction of the muons. We placed the detectors near the South-East corner (position H1, Fig 1d) of the Queen’s chamber in August 2016. The separation between two units was set to 1.5 m. Unfortunately, the newly detected void was overlapping with the Grand Gallery, which made it difficult to identify. After a stable operation for five months, we moved the detector to another position near the south-west corner of the chamber in January 2017 (position H2, 2.9 m from position H1, Fig. 1d) and reduced the unit separation to 1.0 m to enlarge the angular coverage of the measurement. The detector operation has been very stable for more than one year and is still being continued (Methods).
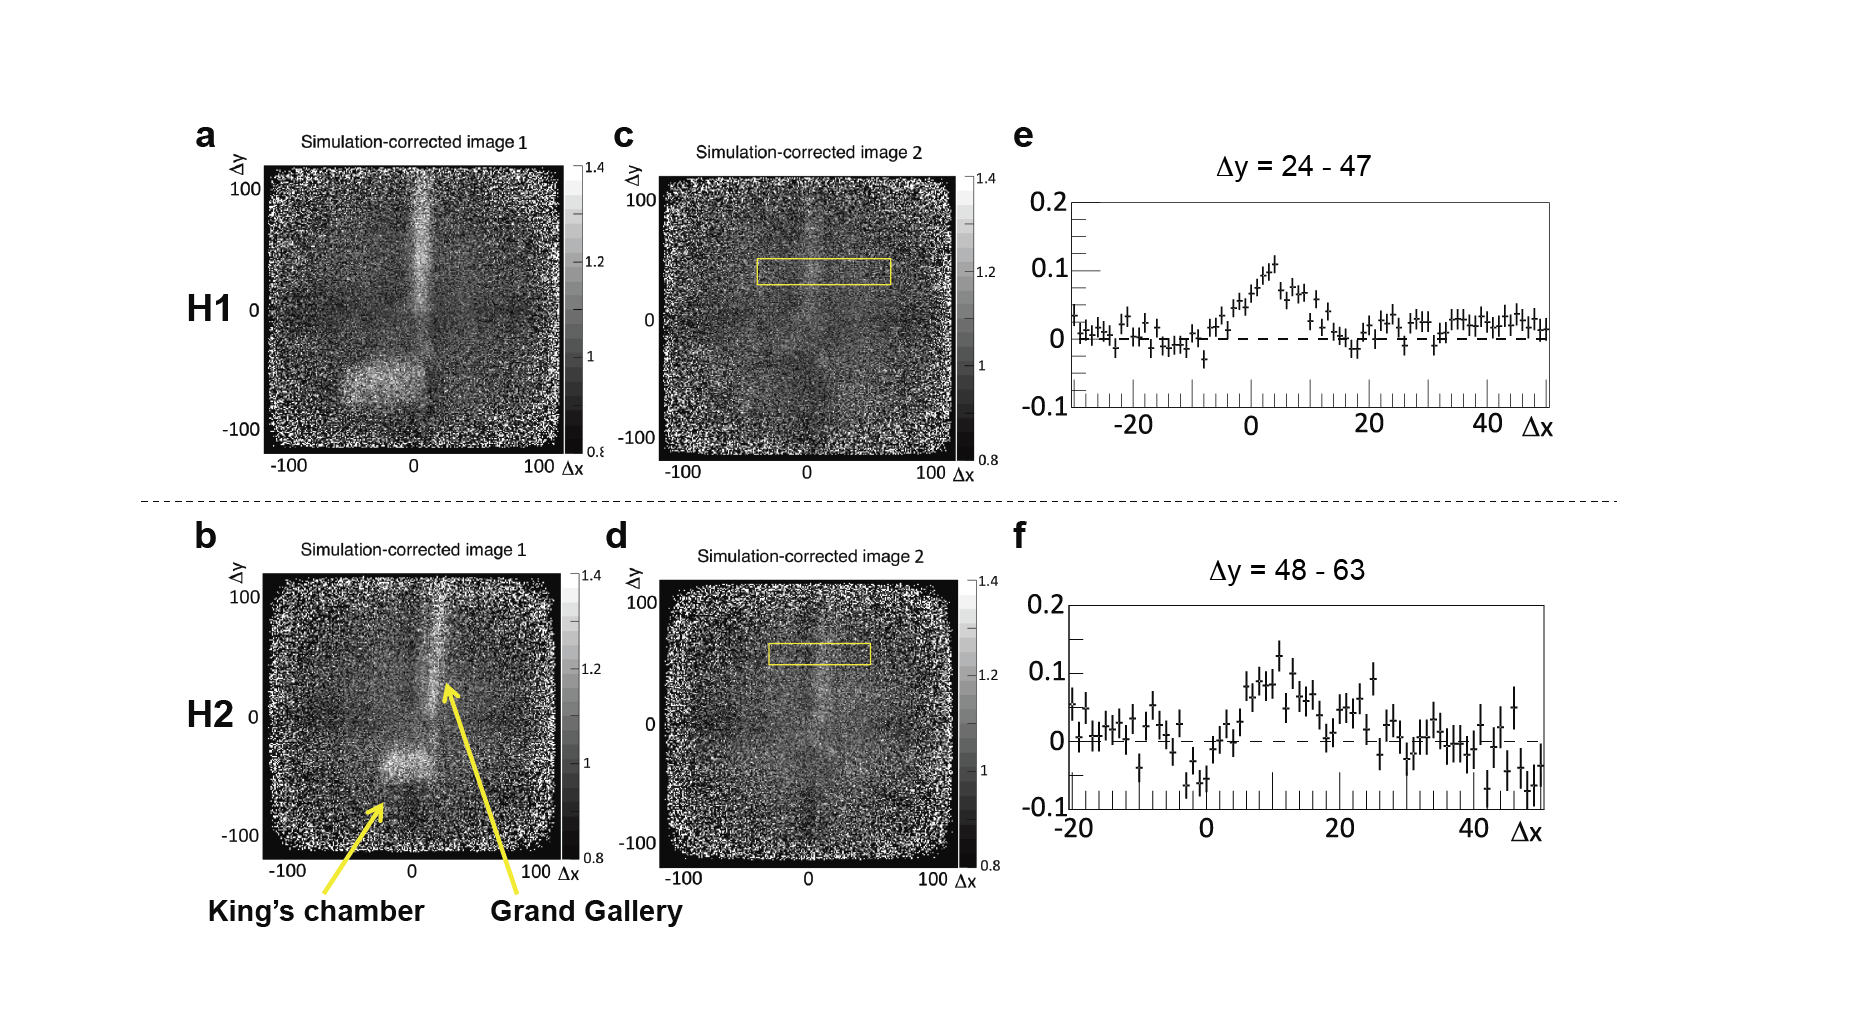
When we normalize the results by the simulation of the solid pyramid without the known structures, we see them clearly (Fig. 3a,b). By normalizing with a simulation that includes the known structures, we observe a muon excess that is consistent with Nagoya’s result (Methods, Fig. 3c-f).
The third kind of instrument, designed by the CEA, is made of micro-pattern gaseous detectors (Micromegas) based on an argon mixture12 (Methods). They are robust enough to be installed outside and can run for unlimited time, but they have a larger footprint than the emulsion plates (Fig. 1i, Extended Data Table 1). Each “telescope” is built from four identical detectors with an active area of 50 × 50 cm2, and a signal on at least three of them is required to trigger the acquisition. An online analysis is performed to extract the muon track parameters which are then transferred at CEA, in France, with a 3G connection (Methods).
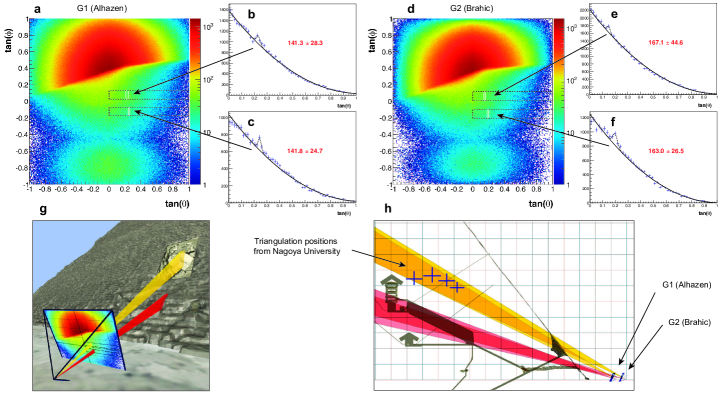
In order to confirm Nagoya’s discovery and to provide an additional point of view, we placed two such telescopes in front of the North face of the pyramid (Fig. 1a-c), looking in the direction of the Grand Gallery (Methods), and close enough to each other so that their data can be combined (Fig. 1c). A previous 3-month measurement campaign with one telescope on the north side already revealed an anomaly in this region, above 3 sigma, but the telescope was shifted from the main vertical axis, and so not optimally positioned. After two months of acquisition from the new position, the data analysis reveals two statistically significant excesses of muons in the core of the pyramid (Fig. 4): one corresponding to the Grand Gallery and one corresponding to the unexpected void (Methods). The 3D model confirms that the telescopes’ observation converges to the same region as the one obtained from the Queen’s chamber with emulsion plates (Fig. 4h). The overall combined excesses yield 8.4 (resp. 5.8) sigma for the Grand Gallery (resp. the new void) (Methods). To our knowledge, this is the first time an instrument has detected a deep void from outside a pyramid.
Three techniques of cosmic-ray muon imaging were applied to investigate the inner structure of the pyramid. The known voids (King’s chamber and Grand Gallery) are observed as well as an unexpected big void, which fully demonstrates the ability of cosmic-ray muon radiography to image structures. The centre of the void is located between 40 m and 50 m from the floor of the Queen’s chamber. Its length is more than 30 m and its cross section is comparable to that of the Grand Gallery. There are still many architectural hypotheses to consider; in particular, the big void could be made of one or several adjacent structures, and it could be inclined or horizontal. The detailed structure of the void should be further studied. Overall, this discovery shows how the methods developed in particle physics can shed light on one of the most important heritage buildings, and it calls for more interdisciplinary collaborations to help understanding the pyramid and its construction process.
-
1.
Lehner, M., The complete pyramids: Solving the Ancient Mysteries (Thames and Hudson, 2008).
-
2.
Hawass, Z., Pyramid Construction: New Evidence Discovered in Giza. Stationen: Beiträge zur Kulturgeschichte, 1998.
-
3.
Smith, C. B., Hawass, Z. & Lehner, M., How the great pyramid was built (Harper Collins, 2006).
-
4.
Particle Data Group, Review of particle physics. Chinese Physics C40 (10), 100001 (2016).
-
5.
Alvarez, L. W. et al., Search for hidden chambers in the pyramids. Science 167 (3919), 832-839 (1970).
-
6.
Tanaka, H. K. M., Nakano, T., Takahashi, S., Yoshida, J. & Niwa, K., Development of an emulsion imaging system for cosmic-ray muon radiography to explore the internal structure of a volcano, , Mt. Asama. Nucl. Instrum. Methods Phys. Res. A575, 489-497 (2007).
-
7.
Morishima, K., Nishio, A., Moto, M., Nakano, T. & Nakamura, M., Development of nuclear emulsion for muography. Annals of Geophysics 60 (1), 0112 (2017).
-
8.
Nakamura, T. A. et al., The OPERA film: New nuclear emulsion for large-scale, high-precision experiments." . Nuclear Instruments and Methods in Physics Research Section A: Accelerators, Spectrometers, Detectors and Associated Equipment 556 (1), 80-86 (2006).
-
9.
Nishio, A., Morishima, K., Kuwabara, K. & Nakamura, M., Development of nuclear emulsion detector for muon radiography. Physics Procedia 80, 74-77 (2015).
-
10.
Fujii, H. et al., Detection of on-surface objects with an underground radiography detector system using cosmic-ray muons. PTEP (5), 053C01 (2017).
-
11.
Fujii, H. et al., Performance of a remotely located muon radiography system to identify the inner structure of a nuclear plant. PTEP 7, 073C01 (2013).
-
12.
Bouteille, S. et al., A Micromegas-based telescope for muon tomography: The WatTo experiment (and references therein). Nuclear Instruments and Methods in Physics Research Section A: Accelerators, Spectrometers, Detectors and Associated Equipment 834, 223-228 (2016).
-
13.
Dash, G., The Great Pyramid’s Footprint: Results from our 2015 Survey. Aeragram 16 (2), 8-14 (2015).
-
14.
Hawass, Z. et al., First report: Video survey of the southern shaft of the queen’s chamber in the great pyramid. Annales du Service des Antiquités de l’Egypte 84, 203-216 (2010).
-
15.
Richardson, R. et al., The "Djedi" Robot Exploration of the Southern Shaft of the Queen’s Chamber in the Great Pyramid of Giza, Egypt. Journal of Fields Robotics 30 (3), 323-348 (2013).
-
16.
Tallet, P., Les papyrus de la Mer Rouge 1: Le "journal de Merer" (Institut Français d’Archéologie Orientale, 2017).
-
17.
Bui, H. D., Imaging the Cheops pyramid (Springer Science & Business Media, 2011).
-
18.
Butler, D. K., Microgravimetric and gravity gradient techniques for detection of subsurface cavities. Geophysics 49 (7), 1084-1096 (1984).
-
19.
Yoshimura, S., Nakagawa, T., Tonouchi, S. & Seki, K., Non destructive Pyramids investigation, Part 1 and 2. Studies in Egyptian Culture 6 (1987).
-
20.
Morishima, K. et al., First demonstration of cosmic ray muon radiography of reactor cores with nuclear emulsion based on an automated high-speed scanning technology. Proc. of the 26th Workshop on Radiation Detectors and Their Uses (2012).
-
21.
Borozdin, K. N. et al., Surveillance: Radiographic imaging with cosmic-ray muons. Nature 422 (6929), 277 (2003).
-
22.
Menichelli, M. et al., A scintillating fibres tracker detector for archaeological applications. Nuclear Instruments and Methods in Physics Research Section A: Accelerators, Spectrometers, Detectors and Associated Equipment 572 (1), 262–265 (2007).
-
23.
Saracino, G. et al., Imaging of underground cavities with cosmic-ray muons from observations at Mt. Echia (Naples). Scientific Reports 7 (1), 1181 (2017).
-
24.
Menchaca-Rocha, A., Searching for cavities in the Teotihuacan Pyramid of the Sun using cosmic muons experiments and instrumentation. International Cosmic Ray Conference 4, 325 (2011).
-
25.
Yoshimoto, M., Nakano, T., Komatani, R. & Kawahara, H., Nuclear emulsion readout system HTS aiming at scanning an area of one thousand square meters. e-Print: arXiv, 1704.06814 (2017).
-
26.
Morishima, K., Hamada, K., Komatani, R., Nakano, T. & Kodama, K., Development of an automated nuclear emulsion analyzing system. Radiation Measurements 50, 237-240 (2013).
-
27.
Hamada, K. et al., Comprehensive track reconstruction tool "NETSCAN 2.0" for the analysis of the OPERA Emulsion Cloud Chamber. Journal of Instrumentation 7 (7), P07001 (2012).
-
28.
Agostinelli, S. et al., GEANT4—a simulation toolkit. Nuclear instruments and methods in physics research section A: Accelerators, Spectrometers, Detectors and Associated Equipment 506 (3), 250-303 (2003).
Author contributions K. M., M. K., A. N., N. K., Y. M. and M. M. performed the experiments and analysed the results for the nuclear emulsion films; F. T., H. F., K. S., H. K., K. H. and S. O. performed the experiments and analysed the results for the scintillator hodoscopes. S. P., D. A., S. B., D. C., C. F., P. M., I. M. and M. R. performed the experiment and analysed the results for telescopes gas detectors. B. M., P. G., E. G., N. S., Y. D. and M. S. created the 3D models used for muography simulations and RTMS. B. M. designed and implemented the Real Time Muography Simulator (RTMS) and contributed to the analyses; Y. E., T. E., M. E. and V. S. coordinated the different experiments operations on the field (muography, 3D scans); the paper was mainly written by K. M., S. P., F. T., M. T., B. M. and J.-B. M., with contributions of all the other authors; H. H., M. T., B. C., B. M. and Y. E. designed and coordinated the project (ScanPyramids);
Author information Correspondence and requests for materials should be addressed both to K. M. (morishima@flab.phys.nagoya-u.ac.jp) and M. T. (tayoubi@hip.institute).
Acknowledgements This experiment is part of the ScanPyramids project, which is supported by NHK, La Fondation Dassault Systèmes, Suez, IceWatch, le Groupe Dassault, Batscop, Itekube, Parrot, ILP, Kurtzdev, Gen-G, Schneider Electric. The measurement with nuclear emulsions was supported by the JST-SENTAN Program from Japan Science and Technology Agency, JST and JSPS KAKENHI Grant Numbers JP15H04241. The CEA telescopes were partly funded by the Région Ile-de-France and the P2IO LabEx (ANR-10-LABX-0038) in the framework “Investissements d’Avenir” (ANR-11-IDEX-0003-01) managed by the Agence Nationale de la Recherche (ANR, France). The detectors were built by the ELVIA company and the CERN MPGD workshop. The authors would like to thank the members and benefactors of the ScanPyramids project, and in particular: T. Hisaizumi, the members of Cairo University, the members of F-lab Nagoya University, Y. Doki, Aïn El Shams University 3D scanning team, the members of Egyptian Ministry of Antiquities, K. El Enany, M. El Damaty, T. Tawfik, S. Mourad, S. Tageldin, E. Badawy, M. Moussa, T. Yabuki, D. Takama, T. Shibasaki, K. Tsutsumida, K. Mikami, J. Nakao, H. Kurihara, S. Wada, H. Anwar, T. de Tersant, P. Forestier, L. Barthès, M.-P. Aulas, P. Daloz, S. Moignet, V. Raoult-Desprez, S. Sellam, P. Johnson, J.-M. Boursier, , T. Alexandre, V. Ferret, T. Collet, H. Andorre, C. Oger-Chevalier, V. Picou, B. Duplat, K. Guilbert, J. Ulrich, D. Ulrich, C. Thouvenin, L. Jamet, A. Kiner, M.-H. Habert, B. Habert, L. Gaudé, F. Schuiten, F. Barati, P. Bourseiller, R. Theet, J.-P. Lutgen, R. Chok, N. Duteil, F. Tran, J.-P. Houdin, L. Kaltenbach, M. Léveillé-Nizerolle, R. Breitner, R. Fontaine, H. Pomeranc, F. Ruffier, G. Bourge, R. Pantanacce, M. Jany, L. Walker, L. Chapus, E. Galal, H. A. Mohalhal, S. M. Elhindawi, J. Lefaucheux, J.-M. Conan, E. M. Elwilly, A. Y. Saad, H. Barrada, E. Priou, S.Parrault, J.-C. Barré, X. Maldague, C. Ibarra Castenado, M. Klein, F. Khodayar, G. Amsellem, M. Sassen, C. Béhar, M. Ezzeldin, E. Van Laere, D. Leglu, B. Biard, N. Godin, P. der Manuelian, L. Gabriel, P. Attar, A. De Sousa, F. Morfoisse, R. Cotentin.
Methods
Detector Design (nuclear emulsions - Nagoya University). Nuclear emulsion is a special photographic film that is able to detect minimum ionizing particles such as cosmic-ray muons (Extended Data Fig. 1). The films used in this experiment have been developed and produced at Nagoya University. In this design, silver bromide crystals with a diameter of 200 nm are dispersed in a 70 m thick sensitive emulsion layer, which is coated on both sides of a 175 m thick transparent polystyrene plastic base7,29 (Extended Data Fig. 1a,b). When a charged particle passes through this emulsion layer, its three-dimensional trajectory (track) is recorded and can be revealed through the chemical development process (Extended Data Fig. 1c,e). Thanks to the precise grain size and structure, tracks can be reconstructed with sub-micron accuracy in 4 steradians by using an optical microscope (Extended Data Fig. 1d). The track reconstruction quality depends on the grain density per length along the line of a track. In this experiment, films with a grain density of 37 grains per 100 m and a noise level of about 1 grain per 1000 m3 were used. These films can be used for long term (2-3 months) measurement in an environment at 25 °C (temperature in the Queen’s chamber) by tuning of volume occupancy of silver bromide crystals (35%)30. Each 30×25 cm2 film was vacuum-packed in an aluminium laminated package for light shielding and humidity control (30%RH) (Extended Data Fig. 1f). An acrylic plate with 2 mm thickness was also packed together for the control of noise increase9. The packed film was fixed onto an aluminum honeycomb plate (Extended Data Fig. 1 g,h) at Nagoya University, and then transported to Cairo by airplane. To avoid the elevated cosmic-ray flux during the flight, we transported the two emulsions layers of each detector separately and assembled them in Egypt. Since we reject the trajectories that are not crossing the two layers, the muons accumulated during the flight are rejected in the analysis and are considered as background tracks.
Data acquisition (Nuclear emulsions - Nagoya University). The observation with nuclear emulsion films was launched in the Queen’s chamber in December 2015 and the films were periodically replaced. Each film was aligned with a reference line drawn with a laser marker and a spirit level, which led to an angular error of less than 10 mrad. After each exposure, we processed the films by photographic development in the dark room at the Grand Egyptian Museum Conservation Center. For the developing solution, we used the XAA developer (FUJI FILM Co. Ltd.) for 25 minutes at 20°C. After the development, we carried the films to Nagoya University, where they were read-out by an automated nuclear emulsion scanning system developed since early 1980’s in Nagoya University31,32. In this experiment, tracks recorded in films were scanned by a Hyper Track Selector25 which can read-out tracks at a speed of 4700 cm2/h with angular accuracy of 1.8 mrad for vertical tracks, and saved in a computer storage device as digital data (position, angle, pulse height). The angular acceptance is approximately |tan| 1.3 where is the zenith angle relative to the perpendicular of the emulsion surface.
Data analysis and statistics (nuclear emulsions - Nagoya University). The muon tracks are reconstructed by the coincidence between the two stacked films within criteria of signal selection and then counted as detected muons26. In this analysis, a subset of the full data set was used to avoid decreasing the resolution because of imaging parallax: 4.4 million tracks were accumulated for 98 days at position NE1 and 6.2 million tracks for 140 days at position NE2, with an effective area of 0.45 m2. Subsequently, detected muons were integrated into two-dimensional angular space (tanx-tany) with the bin size of a specified size (e.g., 0.025 × 0.025) and the angular acceptance of |tan| 1.0, and converted to muon flux (/cm2/day/sr) in each bin (Fig. 2).
We used the Monte Carlo simulator Geant4 Version 10.228 to compute the expected muon flux at detector position. In these simulations, the physical process of electromagnetic interactions and decays of muons were included, Miyake’s formula of integrated intensity of cosmic-ray muons was utilized as a flux model, and only muons were generated as primary particles in this simulator33. In order to reduce the processing time, only muons were propagated and the range of incident muon energy was limited to be 20 to 1000 GeV in the zenith angular range 0 to 70 degree (-2.75 < tan < 2.75). For the pyramid simulation, we modeled the shape and the location of the known structures (the Grand Gallery, the King’s chamber, the corridor that connects them, and the Queen’s chamber) using the survey of Dormion34. We defined that any empty void would be filled with air and that the stones are limestone (2.2 g/cm3) except around the King’s chamber, where they are granite (2.75 g/cm3). The exposure period in the simulation is compatible with 1000 days, which is approximately 10 times longer than that of analyzed data. We estimated the rock thickness distribution in 2D from the detector position: the minimum thickness is 65 m and the maximum thickness is 115 m. If we assume the fluctuation of surface structure is 1 m scale (stone size), the effect of the relative fluctuation is less than 2%.
Normalization was performed to compare real and simulated data in the region without the analyzing target (the Grand Gallery, the King’s chamber, and the anomaly region). The excess region of muon flux was clearly apparent in the images (Figure 2a-d). Two histograms (Figure 2e,f) show muon flux extracting from the slice in 0.4 tany < 0.7. From the comparison between data and the simulation, the significances of each anomaly region were evaluated at 13.7 sigma (statistical) for position NE1 and 12.7 sigma for position NE2.
In order to locate the newly discovered structure, we performed a triangulation from the two positions. The centre of detector position NE1 was located at 5.8 m east from the axis of the Grand Gallery and at 4.5 m west for position NE2. The distance between position NE1 and NE2 is 1.1 m in north-south (Figure 1d). In order to determine the direction toward the anomaly region, we performed the fitting of the excess region to a Gaussian function by dividing the region (0 tany < 1) into four regions with a segment of 0.25 in tany, because the new structure seems to align along the tany axis direction (Extended Data Fig. 2). The fitted center value was used for triangulation and the errors of the estimated positions were defined from the errors on the sight lines coming from a half of the bin width, i.e. 0.0125 in tanx and 0.125 in tany (Fig. 2g-i).
Detector design (scintillator hodoscopes - KEK). The detector consists of two units of double layers, i.e., x and y layers, of plastic scintillator arrays (Extended Data Fig. 3a-c). A single scintillator element is 10 ×10 mm2 in cross section and 1200 mm long. Each layer has 120 elements tightly packed, and hence its active area is 1200 × 1200 mm² (Extended Data Fig. 3d). The element has a central hole along its length, through which a wave-shifter optical fiber is inserted to efficiently transfer the scintillation light to a Multi-Pixel Photon Counter Sensor (MPPC, Hamamatsu). The bias voltage of the MPPC was selected according to the temperature of the Queen’s Chamber, which is constant regardless of the weather outside. Each layer has its own DAQ box, which digitizes the information of sensor signals and sends them to a common PC inside the detector frame. The total power consumption of the detector system is 300 W. The vertical distance between the two units is 1500 mm at position H1 and 1000 mm at position H2, and gives an angular resolution around 7 and 10 mrad respectively. The tangent acceptance ranges from 0 (vertical) to 0.8 and 1.2 rad respectively.
The detector introduces a dark cross-shaped artefact visible on the two-dimensional histograms (Fig. 3a-d), which adds a small systematic error of 3 % to the analysis. According to our analyses, the error is likely to be caused by the very narrow gap between neighboring scintillator elements, but this effect has not been fully understood yet. This systematic error is not relevant in the present analysis, which only examines the existence of the new void.
Data acquisition (scintillator hodoscopes - KEK). Raw data - time and position of all hit channels - are first stored in a PC and regularly retrieved with USB memory to be sent to KEK through the Internet. In the off-line analysis, a muon event is defined by the coincidence of the 4 layers, with at most 2 neighboring hits in each of them. Events are accumulated in two-dimensional bins (x, y) given by the channel number differences between the upper and lower layers along x and y coordinates. The bin number hence ranges from -120 to 120 and provides the tangent of the incident angle when divided by 150 (resp. 100) for position H1 (resp. H2). We installed the detector at position H1 in August 2016, and continued the data taking for five months until January in 2017. During this period, we accumulated 4.8 M events. We then moved the detector by 2.9 m west in order to better investigate the newly observed void. The data taking is still continuing for more than eight months and 12.9 M events were accumulated at position H2 at the end of September 2017, with an overall smooth acquisition for more than a year.
Data analysis and statistics (scintillator hodoscopes - KEK). The first step of the analysis is the normalization of the data by a Monte Carlo simulation that takes into account the cosmic ray muon flux and muon interactions35,36 (energy loss and multiple scattering) in the Pyramid. We assume a constant energy loss of 1.7 MeV per g/cm2 (ref. 4), a mean density of 2.2 g/cm3, and a radiation length of 26.5 g/cm2 for the stones. Muons are propagated in steps of 0.1 m. Because the known structures of the Pyramid are simulated, their effects are removed after the normalization of the data and the remaining muon excess shows the existence of an unknown corridor-like new structure. The successful elimination of the known structures suggests the reliability of our simulation. Slices of the images along x are presented in Extended Data Fig. 4a,b. The vertical scale is the relative yield to the simulation result. The new structure is clearly seen in each slice. The significance of the muon excess was obtained by a Gaussian fit: at position H1 the excess heights in the slices ranges from 5.2% to 8.9% and more than 10 sigma except for the most outer slice, in which the height is still more than 5 sigma. At position H2 the height ranges from 8.9% to 11% and are again above 10 sigma except for the most outer slice, in which the excess is above 7 sigma. From these slices, we found that the structure starts almost at the centre of the Pyramid and ends at an angle whose tangent is 0.8 to the North. As a result, the length of the main part of the new structure is approximately 30 m. Results from both position H1 and H2 show that the new void is above the Grand Gallery, which is consistent with Nagoya’s result.
Detector design (gas detectors - CEA). A telescope (Extended Data Fig. 5a) is composed of 4 Micromegas (Extended Data Fig. 5b), a Micro-Pattern Gaseous Detector (MPGD) invented at CEA-Saclay37 (Extended Data Fig. 5c). All the detectors are identical, with an active area of 50 × 50 cm² (ref. 12). They are built from the bulk technology38 with a screen-printing resistive film on top of the readout strips to allow for stable operation and higher gain39. Each detector provides X and Y coordinates through a 2D readout inserted onto the printed circuit board (Extended Data Fig. 5d). The 1037 readout strips (482 micron pitch) of each coordinate are multiplexed according to a patented scheme40. An Argon-iC4H10-CF4, non-flammable gas mixture (95-2-3) is flushed in series in all the detectors of a telescope, with a flow below 0.5 L/h, thanks to a tight seal (measured gas leak below 5 mL/h per detector).
Each telescope is operated with a Hummingboard nano-PC running GNU/Linux, which controls all the electronics41: a dedicated high voltage power supply (HVPS) card with 5 miniaturized CAEN modules, which provide up to 2 kV with 12V inputs, and the Front End Unit (FEU) readout electronics based on the DREAM ASIC42. A particularly important feature of DREAM is its self-triggering option to generate the trigger from the detectors themselves. A dedicated software package was developed to interface all these electronic components to the Hummingboard which performs the data acquisition with the FEU. It also monitors and sets the high voltages through the HVPS and a patented amplitude feedback to keep the gain constant in spite of the extreme environmental conditions of the Giza plateau (Extended Data Fig. 5 e-g). The overall consumption of a telescope is only 35 W.
A trigger is formed by the FEU when at least 5 coordinates out of 8 observe a signal above a programmable threshold. The sampled signals (50 samples at a frequency of 100/6 MHz, Extended Data Fig. 5h) of all the electronic channels (64 × 8) are then directly converted to a ROOT file43, a format commonly used in particle physics. The nano-PC performs the online reconstruction of muon trajectories, and the muon track parameters are sent to France with some environmental data (temperature, pressure, humidity in the gas) through a 3G connection.
Data acquisition (gas detectors - CEA). The data were collected from May 4th to July 3rd, 2017 with a stable data taking. Two telescopes were installed in front of the chevrons (North face), at a distance of 17 and 23 m, respectively (Fig. 1b,c). The axis of both telescopes deviated slightly from the north-south axis, toward the east, to prevent the Grand Gallery from being at the centre of the image, where some correlated noise can show up. During the acquisition time the two telescopes (called Alhazen and Brahic, at positions G1 and G2, see Fig. 1b,c) recorded 15.0 and 14.5 million triggers, respectively, from which 10.6 and 10.4 million of track candidates were identified. After the chi² quality cut, 6.9 and 6.0 million good tracks were reconstructed, and form the images shown in Figure 4 (a) and (d).
Data analysis and statistics (gas detectors - CEA). From the acquired tracks, we searched for anomalies by extracting slices in tan(phi), i.e. horizontal slices. To get more statistics, the thickness of the slices is larger than the binning shown in the 2D images. We chose a slice thickness of 0.10 for the Alhazen telescope, and we increased to 0.11 for the Brahic telescope to keep roughly the same statistics. The Extended Data Fig. 6 illustrates all the slices made with Alhazen from 0.21 to -0.19. From one histogram to another, the slice position is shifted by 0.02, which means the data of consecutive histograms largely overlap. The goal is to scan the pyramid and detect any deviation from statistics, being fluctuations or not.
As can be seen on Extended Data Fig. 6, the slices show smooth distributions, except around histograms 5-6 and 15. The histograms 6 and 15 correspond to Fig. 4b and 4c respectively. These distributions were fitted with different functions, in particular polynomials. Though such functions are essentially empirical, a CRY/Geant4 simulation was performed to further validate this choice, leading to a good agreement using a 2nd order polynomial with a reduced ² of 1.4. The same function reproduces data distributions fairly well - with a reduced ² value of 1.6 and 2.0 respectively for histograms 6 and 15 - except in a region where an excess is clearly observed on both slices, with single bin excess of 4.2 and 5.3 sigma respectively. Re-fitting with a 2nd order polynomial and a Gaussian significantly reduces the ² to 1.2 and 1.4, with a Gaussian integral of 141.3 ± 28.3 (5.0 sigma, histogram 6) and 141.8 ± 24.7 (5.7 sigma, histogram 15). Similarly, Brahic data show 2 significant excesses, corresponding to Fig. 4e and 4f. A 2nd order polynomial alone results in reduced ² value of 1.8 and 2.4 respectively, while adding a Gaussian reduces them to 1.5 and 1.6. The Gaussian integral is 167.1 ± 44.6 (3.7 sigma, Fig. 4e) and 163 ± 26.5 (6.1 sigma, Fig. 4f).
The 3D model confirms that the (well compatible) excesses from Fig. 4c (Alhazen) and 4f (Brahic) point to the same region of the pyramid and overlap very well with the Grand Gallery (Fig. 4h). The quasi-full overlap of the cones (due to the purposeful proximity of the telescopes) justifies adding the 2 excesses, leading to 304.8 ± 36.2 (i.e., 8.4 sigma). This fully validates the ability of the telescopes to unambiguously detect large structures in the core of the pyramid.
The 3D model also confirms that the excesses from Fig. 4b and 4e point to the same region. Like before, the quasi-full overlap of the cones justifies adding the 2 excesses, leading to 308.4 ± 52.8 (5.8 sigma). A 3D comparison with the triangulation made by Nagoya University further confirms a large overlap of these regions. The other slices show no other anomaly exceeding 5 sigma.
It is worth mentioning that this analysis relies directly on raw data without model subtraction, which means the systematics are much smaller, and can only originate from the fitting function. As an exercise, a 3rd polynomial fit was used for the histograms showing the new void, resulting in excesses of 5.2 and 3.6 sigma for Alhazen and Brahic, and a combined excess of 303.5 ± 52.1 (5.8 sigma).
3-dimensional model of the pyramid. We designed an accurate 3-dimensional model of the pyramid by combining existing architectural drawings34,44 photogrammetry45, and laser scanner measurements45, both inside and outside of the pyramid. After merging these data, the model contains about 500,000 triangles (Extended Data Fig. 7 b-d). This model was mainly used in the RTMS simulator (see below) and as reference for the simplified models used in the other simulators. The full model has a precision of approximately 30 cm for the internal structures and approximately 1 m for the external casing.
Real Time Muography Simulator. The Real Time Muography Simulator (RTMS, Extended Data Figure 7a) is a fast, interactive simulator that was mainly used for preliminary analyses, to aid positioning the gas sensors (telescopes), and for confirming the results obtained from the others simulators. It allows the user to place a sensor in the detailed 3D model of the pyramid and to simulate the observed muon rate in real time. Muon scattering is not simulated. For each pixel of the sensor, which represents a direction relative to the sensor, the simulator computes the opacity (integral of the density along the path) from the sensor to the outside of the pyramid, along this direction. We used a density of 2.2 g/cm3 for the limestone, and 2.6 g/cm3 for the granite. We consider that muons lose energy at a constant rate of 1.69 MeV per g/cm2 (ref 4) which allows us to compute the minimal energy Emin to cross the pyramid given the value of the opacity. Finally, we use Miyake’s formula33 to calculate the distribution of muons that have greater energy than Emin coming at a zenith angle . This value is computed for each pixel of the image, leading to a 2-dimensional histogram similar to those obtained with the detectors.
Data availability. The data that support the findings in this study are available from the corresponding authors on reasonable request.
-
29.
Morishima, K., Latest Developments in Nuclear Emulsion Technology. Physics Procedia 80, 19-24 (2015).
-
30.
Nishio, A. et al., Long Term Property of Nuclear Emulsion. Program and Proceedings of The 1st International Conference on Advanced Imaging (ICAI2015), 668-671 (2015).
-
31.
Aoki, S. et al., The Fully Automated Emulsion Analysis System. Nuclear Instruments and Methods in Physics Research Section B: Beam Interactions with Materials and Atoms 51, 466-472 (1990).
-
32.
Morishima, K. & Nakano, T., Development of a new automatic nuclear emulsion scanning system, S-UTS, with continuous 3D tomographic image read-out. Journal of Instrumentation 5 (4), P04011 (2010).
-
33.
Miyake, S., Rapporteur paper on muons and neutrinos. 13th International cosmic ray conference (1973).
-
34.
Dormion, G., La chambre de Cheops: analyse architecturale (Fayard, 2004).
-
35.
Reyna, D., A simple parameterization of the cosmic-ray muon momentum spectra at the surface as a function of zenith angle. arXiv preprint, hep-ph/0604145 (2006).
-
36.
Jokisch, H., Carstensen, K., Dau, W., Meyer, H. & Allkofer, O., Cosmic-ray muon spectrum up to 1 TeV at 75 zenith angle. Physical review D 19 (5), 1368 (1979).
-
37.
Giomataris, I. Y., Rebourgeard, P., Robert, J. P. & Charpak, G., MICROMEGAS: a high-granularity position-sensitive gaseous detector for high particle-flux environments. Nuclear Instruments and Methods in Physics Research Section A: Accelerators, Spectrometers, Detectors and Associated Equipment 376 (1), 29-35 (1996).
-
38.
Giomataris, I. Y. et al., Micromegas in a bulk. Nuclear Instruments and Methods in Physics Research Section A: Accelerators, Spectrometers, Detectors and Associated Equipment 560 (2), 405-408 (2006).
-
39.
Alexopoulos, T. et al., A spark-resistant bulk-micromegas chamber for high-rate applications. Nuclear Instruments and Methods in Physics Research Section A: Accelerators, Spectrometers, Detectors and Associated Equipment 640, 110-118 (2011).
-
40.
Procureur, S., Dupré, R. & Aune, S., Genetic multiplexing and first results with a 50x50cm2 Micromegas. Nuclear Instruments and Methods in Physics Research Section A: Accelerators, Spectrometers, Detectors and Associated Equipment 729, 888-894 (2013).
-
41.
Bouteille, S. et al., A Micromegas-based telescope for muon tomography: The WatTo experiment. Nuclear Instruments and Methods in Physics Research Section A: Accelerators, Spectrometers, Detectors and Associated Equipment 834, 223-228 (2016).
-
42.
Flouzat, C. et al., Dream: a 64-channel Front-end Chip with Analogue Trigger Latency Buffer for the Micromégas Tracker of the CLAS12 Experiment. Proc. of TWEPP conference (2014).
-
43.
Brun, R. & Rademakers, F., ROOT—an object oriented data analysis framework. Nuclear Instruments and Methods in Physics Research Section A: Accelerators, Spectrometers, Detectors and Associated Equipment 389 (1-2), 81-86 (1997).
-
44.
Maragioglio, V. & Rinaldi, C., L’architettura delle piramidi Menfite. Parte IV, La Grande piramide di Cheope (Rapallo, 1965).
-
45.
Kraus, K., Photogrammetry: geometry from images and laser scans (Walter de Gruyter, 2007).
Extended Data Table 1 | Comparison of the three muon detection technologies.
![[Uncaptioned image]](/html/1711.01576/assets/x4.png)
![[Uncaptioned image]](/html/1711.01576/assets/x5.png)
Overview of the nuclear emulsion films (Nagoya University). a, A cross sectional schematic view of nuclear emulsion. b, Enlarged schematic view of the emulsion layer. Silver bromide crystals are dispersed in gelatin. The red dashed arrow shows the trajectory of the charged particle. c, After the photographic development process, silver grains are aligned along the lines with the trajectory (or, track) of charged particle. d, An optical microscopic photograph of a track of minimum ionized particle recorded in a nuclear emulsion. e, A nuclear emulsion after development. f, A vacuum packed nuclear emulsion. g, Schematic view of the detector configuration: six packed nuclear emulsion films with a detection area of 30 × 25 cm2 each (yellow) are fixed between aluminum supporting plates (honeycomb plate, in grey). Two films stacked on top of each other are pressed with a rubber sheet (black) by four short screws. Three additional long screws are used as legs to correct the inclination of the detector. h, Cross sectional schematic view of the nuclear emulsion detector as shown in g. Two packed films are stacked between two honeycomb plates and rubber sheet.
![[Uncaptioned image]](/html/1711.01576/assets/x6.png)
Slices of the data for the nuclear emulsion plates. Each figure show slices for tany every 0.25 units (in tangent) and separated into four ranges at 0 tany < 1 (Fig. 2a,c). Top panel shows muon flux distribution and bottom panel shows difference of muon flux in each figure. In the top panels, the red line shows the data, the black solid line shows the simulation with the inner structures, and the grey dashed line shows the simulation without any internal structure. In the bottom panels, the red line shows the subtraction between the data and the simulation with the inner structures, the black line shows subtraction between the simulation with the inner structures and without them, so that the Grand Gallery appears as a muon excess. Error bars indicate 1 sigma of statistical error (standard deviation). The comparison between the excess that correspond to the Grand Gallery and the one that corresponds to the new void shows that the two structures are of a similar scale. For each projection of difference of muon flux, we performed a Gaussian fitting to estimate the direction of anomalies. The fitting zone was 0 tanx 0.2 for position NE1 and -0.2 tanx 0 for position NE2. These fitted centres were used for the triangulation.
![[Uncaptioned image]](/html/1711.01576/assets/x7.png)
Overview of the scintillator hodoscopes (KEK). a, Vertical view of the detector, consisting of two units of orthogonal double scintillator layers. A blue arrow indicates a muon track passing through the whole instrument. b, Cross section of a scintillator element, showing the central hole for the optical fiber. b, Grid made of double layers, detecting the position of incident muons. d, Plane view of the detector having an active area of 1.2 × 1.2 m².
![[Uncaptioned image]](/html/1711.01576/assets/x8.png)
Slices of the data for the scintillator hodoscopes. a, Relative yield of the measurement to the simulation (including known structures) at position H1 for 4 slices (the width of each bin is 24 y). b, Relative yield at position H2 for 5 slices (the width of each bin is 16 y). Error bars show one standard deviation.
![[Uncaptioned image]](/html/1711.01576/assets/x9.png)
Overview of the gas detectors (CEA). a, Design of a telescope (without its cover) showing the 4 detectors, the electronics box, the battery and the gas bottles. b, Design of the multiplexed Micromegas detector; c, Principle of a Micromegas detector showing the ionization and amplification of the signal initiated from a charged particle (dotted array). d, layout of the detector with the micro-mesh in red, the resistive strip film in blue, and the Y, X Copper readout strips in yellow; e-g, amplitude variation of a detector in Alhazen as a function of time for 2 previous campaigns (missions 1 and 2) and the one reported here (g), showing the effect of the patented feedback. Large variations observed in (e,f) can lead to inefficiency or degraded resolution, and are totally absent for the data of this paper. The only step observed in (g) corresponds to a manual change of the target amplitude. h, typical signal recorded in a detector, where each line corresponds to an electronic channel.
![[Uncaptioned image]](/html/1711.01576/assets/x10.png)
tan(phi), horizontal slices on the Alhazen muography. The slices are 0.10 (in tangent) thick, and each slice is shifted by 0.02 with respect to the previous one, which means they overlap. Distributions are generally smooth, with 2 significant muon excesses on histograms 5-6 and 15 (see Methods for details). Error bars show one standard deviation.
![[Uncaptioned image]](/html/1711.01576/assets/figures/extended_data_figure_7.jpg)
RTMS simulator and 3D models. a, RTMS with CEA position G2 (Alhazen) sensor with a 6-view layout. Interactive view with display of sensor field of view and cone projections. Real time simulation with internal structure overlaid in wireframe. Result with sensor point of view superposition b, Zoom on chevron area (shaded wireframe) c, Large view of optimized 3D model (shaded wireframe). d, Detail of optimized 3D model.