Reflection Spectra of the Black Hole Binary Candidate MAXI J1535-571 in the Hard State observed by NuSTAR
Abstract
We report on a NuSTAR observation of the recently discovered bright black hole candidate MAXI J1535-571. NuSTAR observed the source on MJD 58003 (five days after the outburst was reported). The spectrum is characteristic of a black hole binary in the hard state. We observe clear disk reflection features, including a broad Fe K line and a Compton hump peaking around 30 keV. Detailed spectral modeling reveals narrow Fe K line complex centered around 6.5 keV on top of the strong relativistically broadened Fe K line. The narrow component is consistent with distant reflection from moderately ionized material. The spectral continuum is well described by a combination of cool thermal disk photons and a Comptonized plasma with the electron temperature keV. An adequate fit can be achieved for the disk reflection features with a self-consistent relativistic reflection model that assumes a lamp-post geometry for the coronal illuminating source. The spectral fitting measures a black hole spin , inner disk radius , and a lamp-post height (statistical errors, 90% confidence), indicating no significant disk truncation and a compact corona. Although the distance and mass of this source are not currently known, this suggests the source was likely in the brighter phases of the hard state during this NuSTAR observation.
Subject headings:
accretion, accretion disks — black hole physics — X-rays: binaries1. INTRODUCTION
MAXI J1535-571 was discovered by MAXI/GSC (Negoro et al., 2017) and Swift/BAT (Kennea et al., 2017) as an uncatalogued hard X-ray transient located near the Galactic plane on September 2, 2017. Subsequent monitoring in X-ray and radio indicates behavior consistent with other known black hole transients, making it a strong black hole binary candidate (e.g., Negoro et al., 2017; Russell et al., 2017). The optical and near-infrared counterparts were identified (Dincer, 2017; Scaringi & ASTR211 Students, 2017). The source was reported to begin the hard-to-soft state transition around September 10 (Kennea, 2017; Nakahira et al., 2017), soon followed by the detection of low-frequency quasi-periodic oscillations (QPOs) by Swift/XRT (Mereminskiy & Grebenev, 2017). The X-ray flux level of MAXI J1535-571 rose rapidly, reaching 5 Crab in the MAXI/GSC band, making it one of the brightest black hole binary candidates known. At the time of this work the source is still in outburst and continues to evolve.
During a typical outburst, black hole binaries undergo a transition from the low/hard to the high/soft state through relatively short-lived intermediate states (see Remillard & McClintock, 2006, for a review). This process is believed to be associated with changes in the accretion flow geometry at the vicinity of the black hole. It is generally well accepted that the inner disk extends to the innermost stable circular orbit (ISCO) in the soft state. Since the black hole angular momentum sets the location of the ISCO radius, estimations of the black hole spin are possible via X-ray spectroscopy, which has been achieved either by modeling the thermal disk (e.g., Zhang et al., 1997) or the disk reflection component (e.g., Fabian et al., 1989). In addition, from the relativistic reflection spectrum, information can be obtained about the nature of the illuminating source commonly referred to as the “corona” (e.g., Miller et al., 2015b; Walton et al., 2017).
The interpretation of the hard state spectrum is still highly debated. The disk accretion model given by Esin et al. (1997) suggests the inner disk is truncated and replaced by an advection-dominated accretion flow at low mass accretion rates in the low/hard state. A recessed disk has also been invoked to explain the behavior of low-frequency QPOs commonly found in the hard state (e.g., Ingram et al., 2009, 2016). There have been efforts to measure the inner disk radius in the hard state through reflection modeling (e.g., Fürst et al., 2015; García et al., 2015). However, controversies remain about the radius of truncation and when disk truncation occurs in terms of the Eddington ratio. The results in some cases have been questioned because of photon pile-up issues at high count rates (e.g., Done & Diaz Trigo, 2010; Miller et al., 2010).
With high sensitivity, broad bandpass and triggered read-out free from pile-up distortion, the Nuclear Spectroscopic Telescope Array (NuSTAR, Harrison et al., 2013) is ideal for studying reflection in Galactic binaries. Recent NuSTAR observations of several black hole binaries in the bright hard state revealed very broad iron lines (Miller et al., 2013, 2015b), which are among the best evidence for lack of disk truncation. New observations of black hole binaries in outburst are important for understanding the accretion geometry in the hard state.
2. OBSERVATION AND DATA REDUCTION
MAXI J1535-571 was observed by NuSTAR (Harrison et al., 2013) starting on 2017 September 7 (MJD 58003) at 18:41:09 UT under a DDT request (OBSID 90301013002). We processed the NuSTAR data using v.1.6.0 of the NuSTARDAS pipeline with NuSTAR CALDB v20170817. After filtering background flares due to enhanced solar activity by setting saacalc=2, saamode = OPTIMIZED and tentacle = no in NUPIPELINE, and the correction for dead time, the effective exposure times are 8.7 ks and 9.1 ks for the two focal plane modules FPMA and FPMB, respectively. The spectra were extracted from a circular region of the radius 180 centered on the source location. We chose the background from a blank region on the detector furthest from source location to avoid source photons. The spectra were grouped to have a signal-to-noise (S/N) ratio of at least 30 per bin.
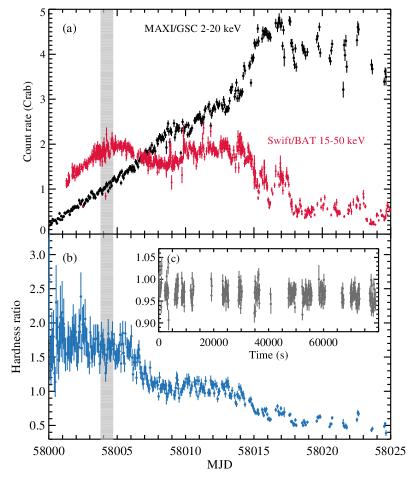
As shown in Figure 1, the NuSTAR observation caught MAXI J1535-571 in the hard state before the spectrum began to soften. The source flux rose quickly during the observation, the dead time corrected FPMA count rate increased from 750 cts s-1 to 900 cts s-1 from the start to the end of the exposure, exceeding the Crab count rate (500 cts s-1) in the NuSTAR band (Madsen et al., 2015a). We only consider time-averaged spectra in this work, as there is no significant change in the hardness ratio (Figure 1c). We model the NuSTAR spectra using XSPEC v12.9.0n (Arnaud, 1996) using statistics, and adopt the cross-sections from Verner et al. (1996) and abundances from Wilms et al. (2000). All parameter uncertainties are reported at the 90% confidence level for one parameter of interest. A cross-normalization constant is allowed to vary freely for FPMB and is assumed to be unity for FPMA.
3. SPECTRAL MODELING
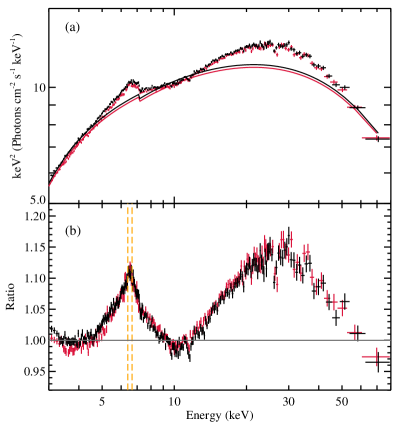
A clear reflection component is present in the NuSTAR spectra. To highlight the reflection features, we first fit the spectra with an absorbed cutoff power-law model, TBabs*cutoffpl in XSPEC notation, only considering the energy intervals of 3–4, 8–12, 40–79 keV. This approximate fit requires a power-law index 1.6 and high-energy cutoff at 60 keV. As displayed in Figure 2, a broad iron line extending down to about 4.5 keV and a Compton hump peaking around 30 keV is evident. In addition, a sharp Fe K-edge can be seen at 7.1 keV, indicating strong absorption.
In the residuals, we also notice narrow dips in the spectra at 11.5 and 26.5 keV, which would only be obvious in bright sources with high S/N data. Whether these are instrumental related is unclear and currently under investigation. We ignore the corresponding energy bins in the spectral fitting from here on. There is also a slight difference (1%) between FPMA and FPMB below 5 keV as can be seen in Figure 2b, which is within the calibration accuracy of NuSTAR (Madsen et al., 2015b). In order to improve the fitting statistics, we account for this discrepancy by fitting the photon-index, , of FPMA and FPMB independently. In all fits in this work, the difference in is minimal (within 0.01) and would not influence other parameters. Therefore we only report the value of from FPMA.
Motivated by the low high-energy cutoff, we model the continuum with the thermal Comptonization model nthcomp (Zdziarski et al., 1996; Życki et al., 1999). The shape of thermal Comptonization is significantly different from a cutoff power-law even below 80 keV (Zdziarski et al., 2003). To minimize the number of free parameters, we first fit the disk reflection assuming a “lamp-post” geometry, where the corona is a point source located on the spin axis of the black hole at a height, , above the accretion disk. The source emissivity profile can be self-consistently calculated with the lamp-post assumption given the location of the illuminating source (Dauser et al., 2013). We use the lamp-post model relxilllpCp in the relxill model family (Dauser et al., 2014; García et al., 2014), which internally includes a nthcomp continuum. The reflection fraction can be self-consistently determined in relxilllpCp based on the inner disk radius , the spin parameter and the lamp-post height from ray-tracing calculations, which helps to constrain the geometry of the system and rules out some unphysical parts of the parameter space (see Dauser et al., 2014, for a discussion). We fit for and simultaneously, and freeze the outer edge of accretion disk, , at 400 , where is the gravitational radius defined as ). In addition, we include possible contribution from reprocessing by distant material using an unblurred reflection model xillverCp (García & Kallman, 2010) to account for the narrow core of the Fe K line. We first assume the distant reprocessing to be neutral by fixing log (where the ionization parameter , is the ionizing luminosity, is the gas density and is the distance to the ionizing source), as neutral narrow Fe K lines have been commonly found in bright Galactic binaries (e.g., Parker et al., 2015; Walton et al., 2016). The iron abundance and the input continuum in xillverCp are linked with those in the disk reflection component. The total model setup is TBabs*(relxilllpCp+xillverCp) (Model 1).
As shown in Figure 3 (left panel), Model 1 fails to adequately fit the spectral continuum, leaving obvious excesses at both the soft and hard end of the NuSTAR energy band. The reduced ( where is the number of degrees of freedom) is . The fit can be greatly improved by adding a multi-color disk blackbody component: TBabs*(relxilllpCp+xillverCp+diskbb) (Model 2), with . A disk component is not evident in the Swift/XRT data as of September 11 (Kennea, 2017), which may be due to the high level of obscuration. However, we note that the contribution from the thermal disk is important for an adequate fit even at higher energies, because it allows for a harder continuum. There are still some residuals left, a narrow peak between 6 to 7 keV (see Figure 3). As can be seen in Figure 2b, the narrow core of the iron line actually peaks between 6.4 keV (neutral Fe K) and 6.7 keV (Fe XXV K), indicating that the distant reprocessing is most likely ionized. Therefore, we leave the ionization parameter to vary freely in xillverCp (Model 3).
| Component | Parameter | Model 3 | Model 4 |
|---|---|---|---|
| tbabs | () | ||
| diskbb | (keV) | ||
| Norm () | |||
| relxill(lp)Cp | () | ||
| () | |||
| () | |||
| () | |||
| (∘) | |||
| log (log []) | |||
| (solar) | |||
| (keV) | |||
| 1.55 | |||
| Norm | |||
| xillverCp | log (log []) | ||
| Norm () | |||
| F (erg cm-2 s-1) a | |||
| F (erg cm-2 s-1) b | |||
| F (erg cm-2 s-1) c | |||
Note. — Frozen parameters are marked with asterisks. There is no error estimation for in Model 3, as the parameter is self-consistently calculated in the lamp-post geometry. a,b Absorbed flux calculated from the normalization of FPMA. c Unabsorbed flux.
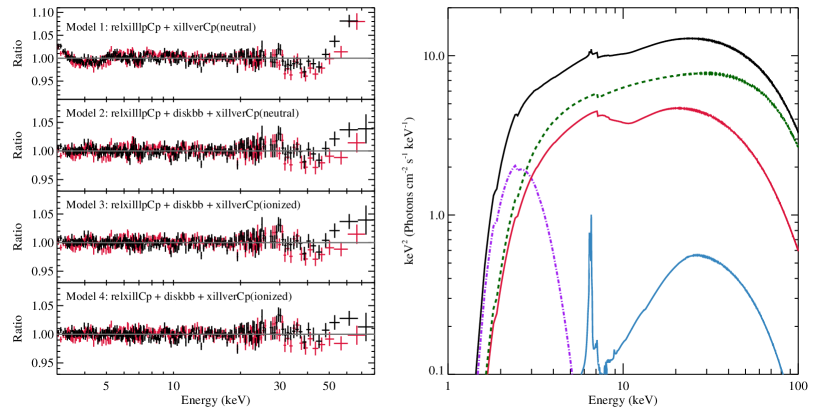
Model 3 yields a reasonable fit, with no obvious residuals (see Figure 3). Allowing the distant reflection component to be ionized brings an improvement of for one additional parameter, with the ionization parameter for the distant reprocessing material measured as log , indicating that the narrow core is actually a blend of Fe K line complex (which are not well separated by NuSTAR). The relative contributions from different components are plotted in Figure 3 (right panel). The Comptonization model nthcomp describes the incident continuum by the asymptotic photon-index, , and the electron temperature, , which are well measured to be and keV, respectively. We note the value of here is as observed, not in the source frame. The model also finds an inclination angle of ∘, an iron abundance (in solar units), and an accretion disk ionization parameter log (see Table 1).
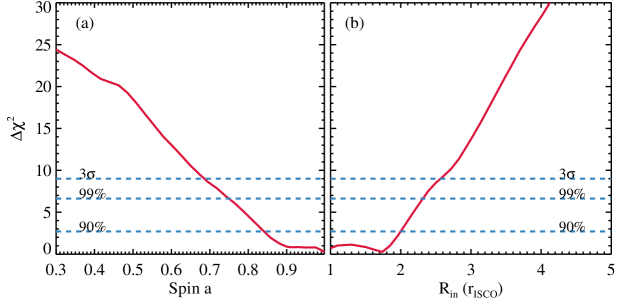
In addition, the disk reflection modeling indicates a relatively low lamp-post height of . The constraints on the spin, , and inner disk radius, , are plotted in Figure 4. Here we measure in units of to better test whether the disk is truncated as the black hole spin is not known a priori. The radius of the ISCO is a function of the black hole spin, decreasing monotonically from 6 for a Schwarzschild black hole to 1.235 for a black hole with the maximum spin parameter of 0.998. The results are strongly inconsistent with a significantly truncated accretion disk scenario, with the best-fit parameters and . The contour flattens down at the regime of high and low (Figure 4), which is expected as the two parameters are degenerate, both controlling the absolute position of the inner disk radius. The reflection fraction given by the lamp-post model is 1.55, defined to be the ratio of the coronal intensity illuminating the disk to that reaching the observer (Dauser et al., 2016). A high reflection fraction is an indicator of strong light bending effects, resulting from a combination of a low corona height, a small inner disk radius and a high spin. Fitting for the reflection fraction as a free parameter does not result in a significantly improved fit.
The model also confirms the obscured nature of the source with the absorption column density cm-2. The value is higher than that reported by Swift/XRT ( cm-2, Kennea, 2017), but a higher is expected in order to obtain a similar spectral shape with an extra thermal disk component included; a high was also reported by preliminary results from NICER ( cm-2, Gendreau et al., 2017). We note that the values of reported here were measured at different epochs, thus the difference could possibly be due to variations in the intrinsic absorption column during the outburst (e.g., Walton et al., 2017). The inner disk temperature measured is , which is somewhat higher than the values of several well-known black hole binaries in the hard state (e.g., Reynolds et al., 2010; Basak & Zdziarski, 2016). An alternative interpretation to the soft emission is to invoke a soft Comptonization component (e.g., Di Salvo et al., 2001). We explored this possibility by including an extra nthcomp model following Basak et al. (2017), but it brings no further improvement to the fit and causes no significant change in other parameters. In addition, we notice that the low-energy end of the spectra includes minor contributions from a dust scattering halo. Therefore, we stress that without soft band coverage, an accurate and unbiased determination of the disk temperature and absorption column density is difficult, but this uncertainty has negligible influence on the reflection parameters as the spectra can be well fitted above 5 keV without a thermal disk or soft Comptonization component, and the other parameters remain unchanged.
To explore the disk emissivity beyond the assumption from a lamp-post geometry, we use a broken power-law emissivity profile () in the relxillCp model, which is described by the inner and outer emissivity indexes and a break radius (Model 4). The best-fit inner emissivity index, , is pegged at the upper limit of 10, whereas and cannot be constrained. Thus we fix at 3 as expected in the Newtonian case, and at 10 . The model yields a broadly similar solution to the lamp-post model (see Table 1), also prefers a rapid black hole spin and a inner disk radius close to the ISCO. The reflection fraction in relxillCp is defined differently from the relxilllpCp, and the values are not directly comparable (for a detailed explanation, see Dauser et al., 2016). The extremely high emissivity index makes the model highly sensitive to the position of the inner radius, resulting in much tighter statistical constraints on and . However, the extreme value of the emissivity index could be an indication that the broken power-law is an overly simplified description of the complicated emissivity profile. Also, although this results in a better fit, we note the main difference of Model 3 and Model 4 lies in the high energy tail (see Figure 3, left panel), where FPMA and FPMB data do not match perfectly, indicating the difference of the two models is close to the instrumental calibration accuracy. Therefore, we focus our discussion on the results from Model 3.
4. DISCUSSION AND CONCLUSIONS
We have performed a spectral analysis of the NuSTAR observation of the recently discovered black hole binary candidate MAXI J1535-571 in the bright hard state. Spectral fitting with relativistic reflection models measures a high black hole spin of and a small inner disk radius . It supports that the inner edge of the accretion disk remains close to the ISCO at the bright hard state of MAXI J1535-571, the result is independent of whether a lamp-post coronal geometry is assumed or not. We measure a high reflection fraction , which can be self-consistently described in the lamp-post model as the result of strong light bending effects near the black hole. Our spin constraint is consistent with the preliminary results reported by a NICER observation in the intermediate state (Gendreau et al., 2017). With basic properties of the binary system unknown (i.e., distance, black hole mass, orbital period), the exact Eddington ratio at the time of the observation is unclear. Assuming a distance of 8 kpc as the source direction is close to the Galactic center, we measure the source luminosity erg s-1, which is about half the Eddington luminosity for a 10 black hole 111 here is about the highest observed among black hole binaries in the hard state, and a few tens times higher than that in the hard state of Cygnus X-1..
In addition, we measure a lamp-post height of and an electron temperature of keV, suggesting a compact and relatively cool corona. Low coronal temperatures, or equivalently low values for the high-energy cutoff, have so far been robustly measured in several black hole binaries during bright hard states with NuSTAR (e.g., Miller et al., 2013, 2015b). Evidence has been found previously that the coronal temperature decreases during the rising phase of the hard state (e.g., Joinet et al., 2008; Motta et al., 2009; García et al., 2015) and the high-energy cutoff disappears at the time of state transition (e.g., Belloni et al., 2006), which signals a dramatic changes in the coronae.
A weak narrow Fe K component is required for an adequate fit of the NuSTAR data, which can be well described by a moderately ionized unblurred reflection model xillverCp. A high resolution systematic study of Fe lines in X-ray binaries using Chandra/HETGS reveals that narrow Fe fluorescence emission is ubiquitous in high-mass X-ray binaries, but rare in low-mass X-ray binaries (Torrejón et al., 2010). It is unclear where the moderately ionized distant reprocessing material is located in MAXI J1535-571. The best-fit absorption column density cm-2 is higher than the expected value for the Galactic absorption column, cm-2 (Kalberla et al., 2005). The extra obscuration is most likely intrinsic, which might be an indication of a complicated structure for the binary system. It is possible that the ionized reflection comes from the outer regions of a flared disk or the titled outer part of a warped disk. Ionized narrow Fe K lines could also be produced in disk winds (e.g., Miller et al., 2015a; King et al., 2015), but is less likely in this case as there is no evidence for absorption lines and source is measured to be viewed at high inclination.
In light of the detection of QPOs reported in later observations (Gendreau et al., 2017; Mereminskiy & Grebenev, 2017), we perform a search for possible QPOs in the frequency range of 0.1 Hz to 500 Hz in the NuSTAR power spectra, but obtain no significant detection, which is not uncommon considering the transient nature of the QPO behavior.
References
- Arnaud (1996) Arnaud, K. A. 1996, in Astronomical Society of the Pacific Conference Series, Vol. 101, Astronomical Data Analysis Software and Systems V, ed. G. H. Jacoby & J. Barnes, 17
- Basak & Zdziarski (2016) Basak, R., & Zdziarski, A. A. 2016, MNRAS, 458, 2199
- Basak et al. (2017) Basak, R., Zdziarski, A. A., Parker, M., & Islam, N. 2017, MNRAS, 472, 4220
- Belloni et al. (2006) Belloni, T., Parolin, I., Del Santo, M., et al. 2006, MNRAS, 367, 1113
- Dauser et al. (2014) Dauser, T., García, J., Parker, M. L., Fabian, A. C., & Wilms, J. 2014, MNRAS, 444, L100
- Dauser et al. (2016) Dauser, T., García, J., Walton, D. J., et al. 2016, A&A, 590, A76
- Dauser et al. (2013) Dauser, T., Garcia, J., Wilms, J., et al. 2013, MNRAS, 430, 1694
- Di Salvo et al. (2001) Di Salvo, T., Done, C., Życki, P. T., Burderi, L., & Robba, N. R. 2001, ApJ, 547, 1024
- Dincer (2017) Dincer, T. 2017, The Astronomer’s Telegram, 10716
- Done & Diaz Trigo (2010) Done, C., & Diaz Trigo, M. 2010, MNRAS, 407, 2287
- Esin et al. (1997) Esin, A. A., McClintock, J. E., & Narayan, R. 1997, ApJ, 489, 865
- Fabian et al. (1989) Fabian, A. C., Rees, M. J., Stella, L., & White, N. E. 1989, MNRAS, 238, 729
- Fürst et al. (2015) Fürst, F., Nowak, M. A., Tomsick, J. A., et al. 2015, ApJ, 808, 122
- García & Kallman (2010) García, J., & Kallman, T. R. 2010, ApJ, 718, 695
- García et al. (2015) García, J. A., Steiner, J. F., McClintock, J. E., et al. 2015, ApJ, 813, 84
- García et al. (2014) García, J., Dauser, T., Lohfink, A., et al. 2014, ApJ, 782, 76
- Gendreau et al. (2017) Gendreau, K., Arzoumanian, Z., Markwardt, T., et al. 2017, The Astronomer’s Telegram, 10768
- Harrison et al. (2013) Harrison, F. A., Craig, W. W., Christensen, F. E., et al. 2013, ApJ, 770, 103
- Ingram et al. (2009) Ingram, A., Done, C., & Fragile, P. C. 2009, MNRAS, 397, L101
- Ingram et al. (2016) Ingram, A., van der Klis, M., Middleton, M., et al. 2016, MNRAS, 461, 1967
- Joinet et al. (2008) Joinet, A., Kalemci, E., & Senziani, F. 2008, ApJ, 679, 655
- Kalberla et al. (2005) Kalberla, P. M. W., Burton, W. B., Hartmann, D., et al. 2005, A&A, 440, 775
- Kennea (2017) Kennea, J. A. 2017, The Astronomer’s Telegram, 10731
- Kennea et al. (2017) Kennea, J. A., Evans, P. A., Beardmore, A. P., et al. 2017, The Astronomer’s Telegram, 10700
- King et al. (2015) King, A. L., Miller, J. M., Raymond, J., Reynolds, M. T., & Morningstar, W. 2015, ApJ, 813, L37
- Madsen et al. (2015a) Madsen, K. K., Reynolds, S., Harrison, F., et al. 2015a, ApJ, 801, 66
- Madsen et al. (2015b) Madsen, K. K., Harrison, F. A., Markwardt, C. B., et al. 2015b, ApJS, 220, 8
- Mereminskiy & Grebenev (2017) Mereminskiy, I. A., & Grebenev, S. A. 2017, The Astronomer’s Telegram, 10734
- Miller et al. (2015a) Miller, J. M., Fabian, A. C., Kaastra, J., et al. 2015a, ApJ, 814, 87
- Miller et al. (2010) Miller, J. M., D’Aì, A., Bautz, M. W., et al. 2010, ApJ, 724, 1441
- Miller et al. (2013) Miller, J. M., Parker, M. L., Fuerst, F., et al. 2013, ApJ, 775, L45
- Miller et al. (2015b) Miller, J. M., Tomsick, J. A., Bachetti, M., et al. 2015b, ApJ, 799, L6
- Motta et al. (2009) Motta, S., Belloni, T., & Homan, J. 2009, MNRAS, 400, 1603
- Nakahira et al. (2017) Nakahira, S., Negoro, H., Mihara, T., et al. 2017, The Astronomer’s Telegram, 10729
- Negoro et al. (2017) Negoro, H., Kawase, T., Sugizaki, M., et al. 2017, The Astronomer’s Telegram, 10708
- Parker et al. (2015) Parker, M. L., Tomsick, J. A., Miller, J. M., et al. 2015, ApJ, 808, 9
- Remillard & McClintock (2006) Remillard, R. A., & McClintock, J. E. 2006, ARA&A, 44, 49
- Reynolds et al. (2010) Reynolds, M. T., Miller, J. M., Homan, J., & Miniutti, G. 2010, ApJ, 709, 358
- Russell et al. (2017) Russell, T. D., Miller-Jones, J. C. A., Sivakoff, G. R., Tetarenko, A. J., & Jacpot Xrb Collaboration. 2017, The Astronomer’s Telegram, 10711
- Scaringi & ASTR211 Students (2017) Scaringi, S., & ASTR211 Students. 2017, The Astronomer’s Telegram, 10702
- Torrejón et al. (2010) Torrejón, J. M., Schulz, N. S., Nowak, M. A., & Kallman, T. R. 2010, ApJ, 715, 947
- Verner et al. (1996) Verner, D. A., Ferland, G. J., Korista, K. T., & Yakovlev, D. G. 1996, ApJ, 465, 487
- Walton et al. (2016) Walton, D. J., Tomsick, J. A., Madsen, K. K., et al. 2016, ApJ, 826, 87
- Walton et al. (2017) Walton, D. J., Mooley, K., King, A. L., et al. 2017, ApJ, 839, 110
- Wilms et al. (2000) Wilms, J., Allen, A., & McCray, R. 2000, ApJ, 542, 914
- Zdziarski et al. (1996) Zdziarski, A. A., Johnson, W. N., & Magdziarz, P. 1996, MNRAS, 283, 193
- Zdziarski et al. (2003) Zdziarski, A. A., Lubiński, P., Gilfanov, M., & Revnivtsev, M. 2003, MNRAS, 342, 355
- Zhang et al. (1997) Zhang, S. N., Cui, W., & Chen, W. 1997, ApJ, 482, L155
- Życki et al. (1999) Życki, P. T., Done, C., & Smith, D. A. 1999, MNRAS, 309, 561