Star formation is boosted (and quenched) from the inside out: radial star formation profiles from MaNGA.
Abstract
The tight correlation between total galaxy stellar mass and star formation rate (SFR) has become known as the star forming main sequence. Using 487,000 spaxels from galaxies observed as part of the Sloan Digital Sky Survey Mapping Galaxies at Apache Point Observatory (MaNGA) survey, we confirm previous results that a correlation also exists between the surface densities of star formation () and stellar mass () on kpc scales, representing a ‘resolved’ main sequence. Using a new metric (), which measures the relative enhancement or deficit of star formation on a spaxel-by-spaxel basis relative to the resolved main sequence, we investigate the SFR profiles of 864 galaxies as a function of their position relative to the global star forming main sequence (SFR). For galaxies above the global main sequence (positive SFR) is elevated throughout the galaxy, but the greatest enhancement in star formation occurs at small radii ( 3 kpc, or 0.5 ). Moreover, galaxies that are at least a factor of three above the main sequence show diluted gas phase metallicities out to 2 , indicative of metal-poor gas inflows accompanying the starbursts. For quiescent/passive galaxies that lie at least a factor of 10 below the star forming main sequence there is an analogous deficit of star formation throughout the galaxy with the lowest values of in the central 3 kpc. Our results are in qualitative agreement with the ‘compaction’ scenario in which a central starburst leads to mass growth in the bulge and may ultimately precede galactic quenching from the inside-out.
keywords:
galaxies: evolution, galaxies: star formation, galaxies: interactions, galaxies: bulges1 Introduction
One of the key contributions of large galaxy surveys has been to establish global scaling relations between galaxy properties. One such correlation has become known as the star forming main sequence (hereafter, simply ‘main sequence’111We will sometimes refer to the main sequence relationship between galaxy total stellar mass and total star formation rate as the ‘global’ main sequence, in order to distinguish it from the ‘resolved’ main sequence that is also studied in this work.) - a tight relation between a galaxy’s star formation rate (SFR) and its total stellar mass (Brinchmann et a. 2004; Salim et al. 2007; Renzini & Peng 2015). This relationship between SFR and M⋆ exists out to high redshifts, increasing its normalization to higher values at earlier epochs such that SFRs at a fixed stellar mass are higher by a factor of 20 by (e.g. Noeske et al. 2007; Daddi et al. 2007; Whitaker et al. 2012; Speagle et al. 2014; Schreiber et al. 2015; Barro et al. 2017).
Galaxies above/below the main sequence at any given epoch have, by definition, SFRs that are elevated or suppressed relative to the ‘norm’ for their stellar mass. Various processes have been associated with the modulation of star formation rates, including internal structure (such as bars and bulges, e.g. Ellison et al. 2011; Wuyts et al. 2011b; Wang et al. 2012; Mendel et al. 2013; Bluck et al. 2014), cold gas fraction (Saintonge et al. 2012, 2016; Tacconi et al. 2013, 2017; Sargent et al. 2014; Genzel et al. 2015; Violino et al. 2017) interactions with other galaxies (Ellison et al. 2008a, 2013; Scudder et al. 2012; Patton et al. 2013; Scott & Kaviraj 2014; Stierwalt et al. 2015; Willett et al. 2015) and the presence of an AGN (Shimizu et al. 2015; Cowley et al 2016; Ellison et al. 2016; Azadi et al. 2017; Sánchez et al. 2017b). The fraction of galaxies that inhabit the main sequence is also a function of both local and large scale environment (Peng et al. 2012; Woo et al. 2013; Knobel et al. 2015), with lower star formation rates in higher density environments (Lewis et al 2002; Gomez et al. 2003). These various processes for modulating star formation may be expected to impact the internal profiles of star formation in different ways. For example, positive feedback from an AGN, which frequently manifest evidence for central winds (Crenshaw et al. 2010; Harrison et al. 2014; McElroy et al. 2015; Woo et al. 2016, 2017; Concas et al. 2017) could suppress the star formation preferentially in the inner galactic regions (e.g. Cano Díaz et al. 2012; Carniani et al. 2016). Conversely, both bars and galaxy-galaxy interactions can funnel gas inwards (Martel et al. 2013; Moreno et al. 2015) leading to central SFR enhancements. Other processes, such as simple gas exhaustion, or stochastic bursts of star formation due to instabilities in gas rich disks, may lead to a more uniform SFR suppression/enhancement.
In recognition that, in practice, a variety of mechanisms can trigger star formation, a more generalized paradigm has recently emerged from simulations and observations alike. In this model, varying processes such as mergers (both minor and major), secular disk instabilities and streams lead to high gas densities and centrally concentrated star formation (e.g. Dekel & Burkert 2014; Zolotov et al. 2015; Tacchella et al. 2016a,b). Due to the characteristic build-up of central stellar mass density that follows the starburst, this process has been termed ‘galaxy compaction’. Galaxies can oscillate around the global star forming main sequence as a result of successive compaction and gas depletion events (e.g. Fig. 11 in Tacchella et al. 2016a). Empirical support for this compaction process comes from a tight observed correlation between the central surface density of stellar mass () and total stellar mass, wherein quiescent galaxies are offset to higher central at fixed M⋆ (Fang et al. 2013; Tacchella et al. 2015a), as well as the existence of a population of star forming galaxies with the same central as quiescent galaxies (Barro et al. 2013, 2014, 2017). These ‘compact star-forming’ galaxies have been proposed as the possible pre-cursors of fully quenched galaxies.
A clear testable prediction of the compaction model is that elevation above the main sequence is driven by central star formation, and that quenching proceeds with the same radial directionality. There is now considerable empirical evidence, from a variety of datasets, redshifts and observational techniques that support inside out quenching (e.g González Delgado et al. 2016; Nelson et al. 2016; Belfiore et al. 2017a, Tacchella et al. 2015a, 2017; Sánchez et al. 2017b; Morselli et al., in prep). There is likewise support for the importance of the central regions in building the galaxy’s stellar mass and inside out growth (Nelson et al. 2012; Pérez et al. 2013; González Delgado et al. 2014, 2015; Morselli et al. 2017; Lian et al. 2017). However, simultaneous assessments of the radial dependence of star formation both above and below the main sequence using the same dataset and homogeneous analysis are rare. From a study of 3000 galaxies at , Nelson et al. (2016) found that, in general, star formation was uniformly suppressed/enhanced in galaxies below/above the main sequence. Only in the highest mass galaxies in their sample were centrally enhanced trends evident. Simulations have shown that these observational results can be reproduced by bursty star formation histories (Orr et al. 2017). Evidence for centrally suppressed specific SFRs in galaxies below the main sequence at , as predicted by compaction, have been found by Morselli et al. (in prep), but this sample lacks the statistics to study true starbursts. Tacchella et al. (2017) present tantalizing evidence for centrally driven radial changes in galaxies above and below the main sequence at , but with a sample of only 10 galaxies, this remains tentative.
Large integral field unit (IFU) galaxy surveys such as the Calar Alto Legacy Integral Field Area (CALIFA, Sánchez et al. 2012), Sydney-Australian-Astronomical-Observatory Multi-object Integral-Field Spectrograph (SAMI, Croom et al. 2012; Allen et al. 2015) and the Mapping Nearby Galaxies and Apache Point Observatory (MaNGA, Bundy et al. 2015) have the potential to revolutionize our ability to map star formation in galaxies and test radial trends in galaxy evolution. In the current work, we seek to use a large IFU sample of galaxies from the MaNGA survey to address the question of where within a galaxy the star formation is being regulated, both above and below the global star forming main sequence. The paper is laid out as follows. In Section 2 we describe our sample selection from the MaNGA galaxy survey, as well as the definition of the SFR offset metric used to quantify the position of a given galaxy relative to the main sequence. In Section 3 we describe the analysis pipeline applied to the IFU data cubes, measurement of spaxel properties, the resolved main sequence in MaNGA star forming spaxels and new metrics developed to quantify the relative enhancement/suppression of star formation and metallicity on a spaxel by spaxel basis. In Section 4 we present the main results of our study – relative star formation profiles as a function of offset from the global main sequence. We discuss our results in Section 5 and summarize in Section 6. We adopt a cosmology in which H0=70 km/s/Mpc, =0.3, =0.7.
2 Sample selection
2.1 MaNGA parent sample
In this work we use the galaxies available in the Sloan Digital Sky Survey (SDSS) Data Release 13 (DR13; Albareti et al. 2017) observed as part of the MaNGA survey. The MaNGA survey is one of three projects within SDSS-IV that will ultimately target 10,000 galaxies evenly sampled above a stellar mass log (M⋆/M (Bundy et al. 2015). All of the MaNGA targets are selected from the SDSS main galaxy sample, offering the benefit of previously determined global properties such as metallicities, morphologies, SFRs and stellar masses (e.g. Kauffmann et al. 2003b; Brinchmann et al. 2004; Salim et al. 2007; Simard et al. 2011; Mendel et al. 2014). By bundling together the individual 2 fibres of the twin Baryon Oscillation Spectroscopic Survey (BOSS) spectrographs into hexagonal IFUs, and employing a dithering strategy to fill in the gaps between fibres, a continuous spectral map of the galaxy can be obtained (Law et al. 2015). The IFUs vary in diameter from 12 (19 fibres) to 32 (127 fibres) and are selected to cover any given galaxy out to 1.5 effective radii for 2/3 of the sample. The remainder of the sample is selected at slightly higher redshifts in order to achieve coverage out to 2.5 effective radii.
A query of all the publically available data in the MaNGA DR13 sample yields 1390 datacubes, including a minority of duplicate observations of the same target galaxy. In this work, we will make use of several extant catalogs of derived galaxy properties, primarily based on the SDSS DR7. These include measurements of stellar mass (Kauffmann et al. 2003b), star formation rates (Brinchmann et al. 2004; Salim et al. 2007), galaxy half light (effective) radius in the -band (, Simard et al. 2011), bulge fractions measured in the -band (Simard et al. 2011), bulge fractions as determined from the stellar mass (Mendel et al. 2014) and AGN classification (Kauffmann et al. 2003a). We therefore require that to be included our sample, a galaxy in the DR13 must also be included in all of these aforementioned data catalogs, for which we require a positional match within 2. There are 1157 unique galaxies in the DR13 that are matched to the DR7 catalogs within this tolerance.
2.2 Star forming galaxies
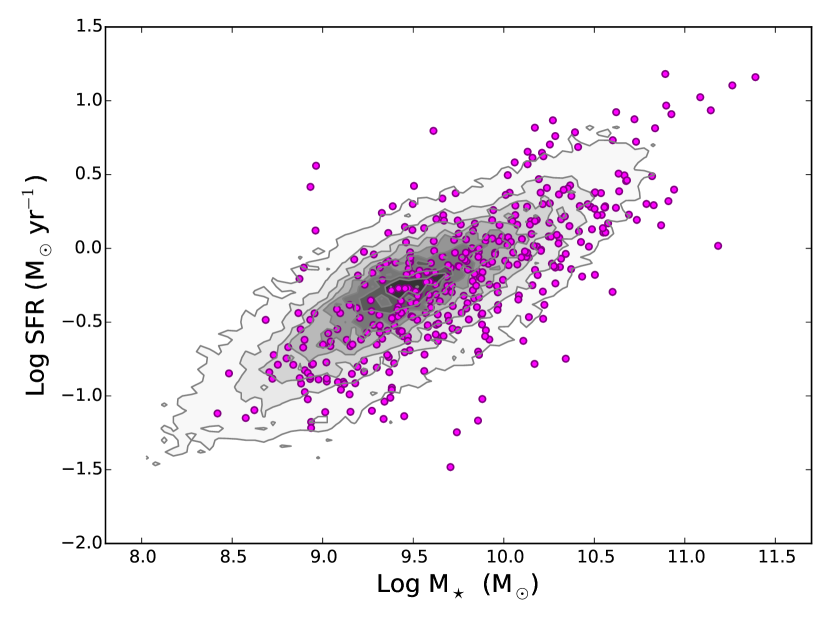
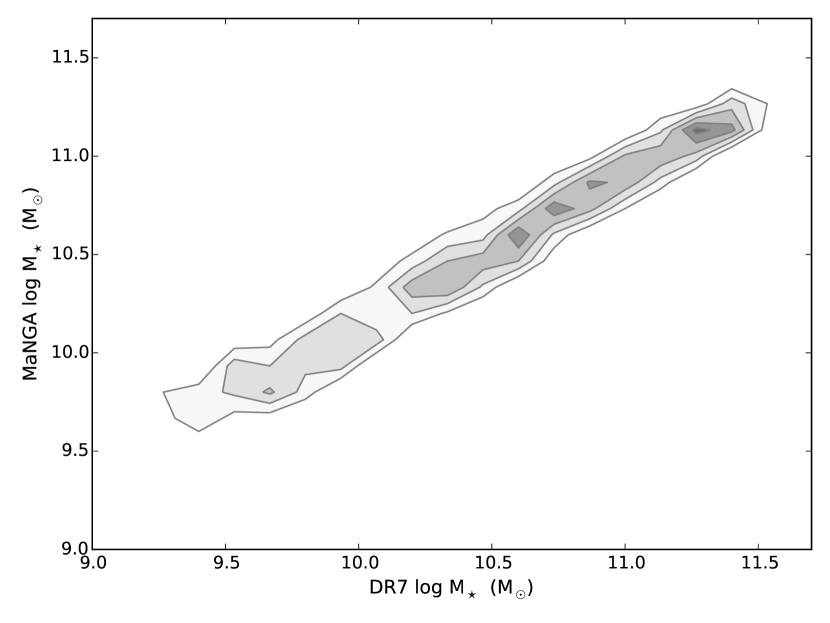
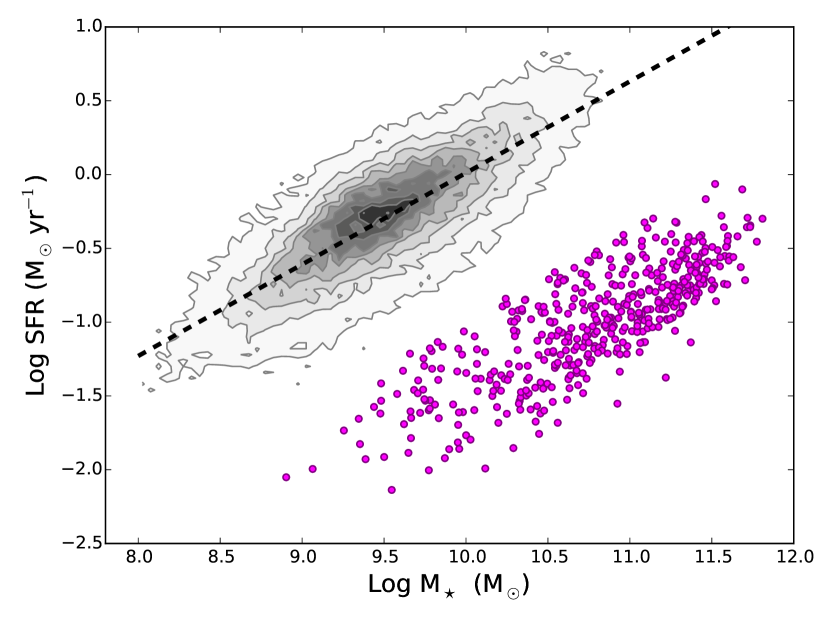
Our study will distinguish star-forming and quenched (passive) galaxies. Star forming galaxies were selected according to the following criteria: a stellar mass and total SFR must be available from the MPA/JHU catalog (Kauffmann et al. 2003b; Brinchmann et al. 2004; Salim et al. 2007) and the galaxy must be classified as star-forming according to the emission line ratio criteria of Kauffmann et al. (2003a), with a minimum S/N=3 required for all relevant emission lines in the DR7 spectrum. There are 156,000 galaxies in the DR7 that fulfill the criteria required for our star forming sample, of which 394 are part of the MaNGA DR13. In Fig. 1 we show the distribution of SFR and M⋆ of the 394 star forming MaNGA galaxies as magenta points. For reference, the DR7 distribution (restricted to galaxies with for display purposes, in order to represent the dominant redshift range of the MaNGA sample) is shown in grey contours.
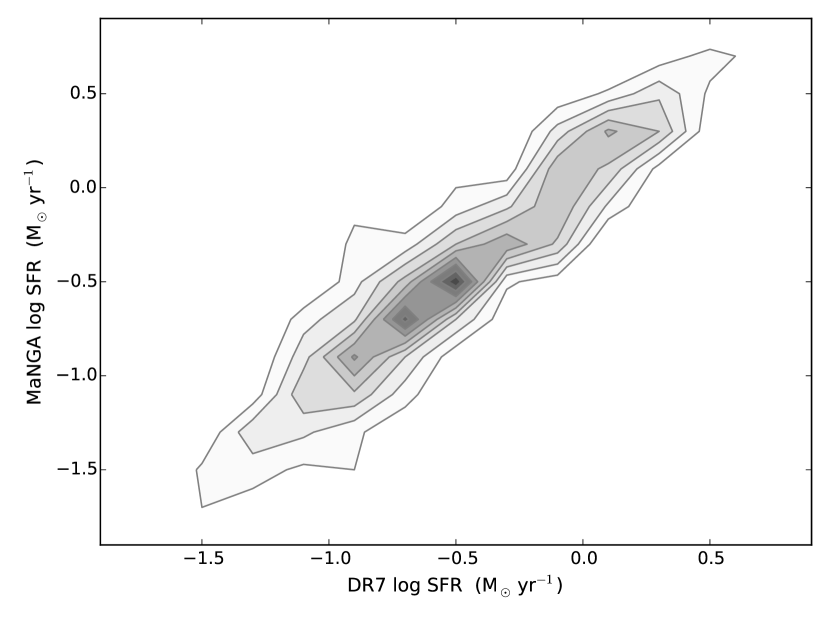
We note that total SFRs and stellar mass estimates can also be computed for the MaNGA sample by integrating across all the spaxels in the IFU. However, in this work (see Section 2.3) we will be computing galaxy offsets from the star forming main sequence (SFR), by comparing the SFRs of MaNGA galaxies to the full sample of SDSS DR7 galaxies at fixed M⋆, redshift and local galaxy density. In order to have consistent galaxy stellar mass and SFR measurements for the SFR calculation, we adopt the DR7 measurements of these values from the MPA/JHU catalogs. Using only the MaNGA galaxies to define the control samples leads to a poor statisical matching (very few matches at the extremes of stellar mass and density). However, we have checked that for the MaNGA galaxies the stellar mass and SFR values from the MPA/JHU catalog correlate with the integrated MaNGA values. The mean difference between the MPA/JHU and integrated MaNGA values is 0.0007 dex for stellar mass and 0.03 dex for SFR, with scatter of 0.3 and 0.4 dex respectively (consistent with comparisons in other papers, e.g. Spindler et al. 2017), see Appendix A.
2.3 Star formation rate offsets from the main sequence
The main goal of this work is to investigate the spatial profiles of galaxies that exhibit different global levels of star formation. It is therefore necessary to quantify whether (and by how much) a galaxy is forming stars at a higher or lower rate than expected, given its other various properties. In order to quantify how enhanced or suppressed the SFR is in a given galaxy, relative to the ‘norm’, we define a SFR offset (SFR). Qualitatively, SFR is the difference (on a logarithmic scale) between the observed SFR of a given galaxy and its expected SFR (defined quantitatively below). Hence a SFR = 1 indicates a galaxy whose SFR is elevated above the expected value on the main sequence by a factor of 10. A further benefit of computing a differential measure of star formation is that it helps to mitigate biases in sample selection and parameter determination, such as aperture effects (e.g. Richards et al. 2016; Duarte Puertas et al., 2017).
Since the main factor that regulates a galaxy’s SFR is its stellar mass, a simple approach would be to fit a relation to the main sequence or simply to compare to the peak SFR at a given M⋆ (e.g. Renzini & Peng 2015; Magdis et al. 2016; Morselli et al. 2017). However, other factors may also modulate the global galactic SFR, hence it is desirable to account for additional parameters. Firstly, since local galaxy density has been shown to affect star formation (e.g. Lewis et al. 2002; Gomez et al. 2003), it is desirable to match on some environmental metric. Following our previous work, we adopt the quantity
| (1) |
where is the projected distance in Mpc to the nearest neighbour within 1000 km s-1. Normalized densities, , are computed relative to the median within a redshift slice 0.01.
Secondly, we match on galaxy redshift. Matching on redshift is potentially important for two reasons. First, if any fibre based quantity is used in the analysis, aperture corrections will evolve significantly over the redshift range of the DR7 sample. This should not be a significant effect in our analysis of SFRs, since we use aperture corrected values (e.g. Brinchmann et al. 2004; Salim et al. 2007). The second reason to match in redshift is to account for a true evolution of sample properties. As noted in the Introduction, it is well known that the star forming main sequence increases its normalization towards higher redshifts (e.g. Whitaker et el. 2012; Speagle et al. 2014). Even within the relatively narrow redshift range of the SDSS DR7 (where the maximum redshift is ), the main sequence normalization changes by approximately 0.2 dex.
In order to compute the SFR of a given galaxy (SFRgal), we construct a sample of control star forming galaxies that are matched in stellar mass, redshift and local galaxy density (environment) that are drawn from the DR7 parent sample of 156,000 star-forming galaxies described above. The baseline tolerance used for matching is 0.1 dex in stellar mass, 0.005 in redshift and 0.1 dex in . We require at least five comparison galaxies in the matched sample; if this is not achieved then the mass, redshift and local density tolerances are grown in further increments of 0.1 dex, 0.005 and 0.1 dex respectively, until the minimum size criterion of five matched controls is achieved. In practice, 95 per cent of galaxies are successfully matched to at least five controls without the need to grow the tolerances. The remaining five percent require only one ‘grow’ in order to reach the requirement of five matched controls. In general, the number of matched controls far exceeds the minimum requirement of five, with an average of 110 matches per galaxy.
The SFR of the control star forming sample (SFRcontrol) is taken as the median of the aperture-corrected ‘total’ SFRs determined from the SDSS spectra (Brinchmann et al. 2004; Salim et al. 2007).The SFR offset is then defined as:
| (2) |
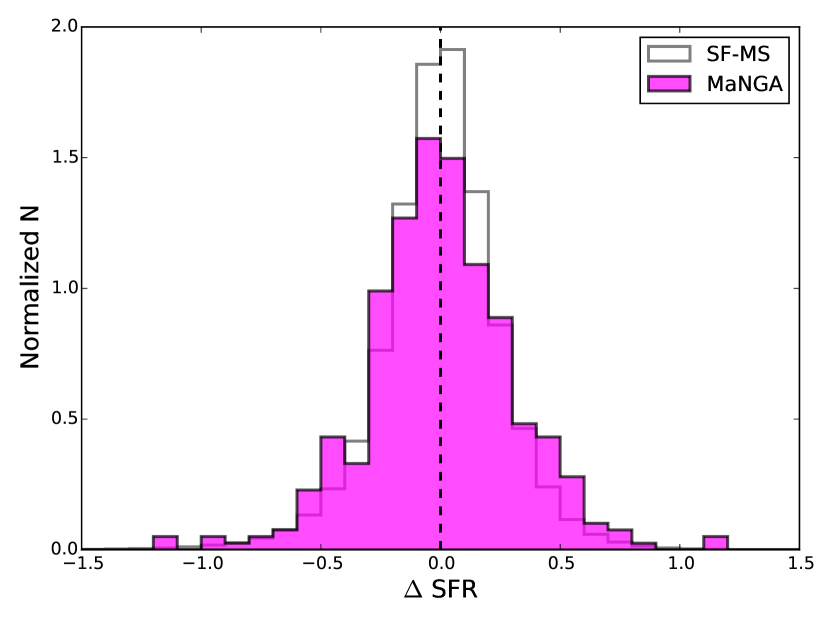
In Fig. 2 we show the distribution of SFR for the galaxies in the star forming MaNGA and DR7 galaxies presented in Fig. 1. By construction, the DR7 sample is symmetric around zero. The MaNGA sample is also broadly symmetric, spanning a wide range of SFR, including galaxies that exhibit SFRs up to 10 times above or below their matched control samples. In order to cleanly distinguish the star forming sample of MaNGA galaxies (Sec. 2.2) from the passive MaNGA galaxies (Sec. 2.4) we impose a cut on the SFR of the former sample, requiring that SFR . This excludes two galaxies from the original 394 in the MaNGA star-forming sample; these two galaxies are instead considered as part of the passive galaxy sample.
2.4 Passive galaxies
In addition to the star forming galaxy sample, we select galaxies from the MaNGA DR13 parent sample that are classified as ‘passive’ (sometimes also referred to as ‘quenched’; indeed, we will use the two terms interchangeably in this work). Passive galaxies are no longer actively forming stars and fall significantly below the main sequence. Following Bluck et al. (2016) we defined passive galaxies as those which lie at least one dex below the main sequence, i.e. have SFRs at least 10 times lower for their stellar mass. In the parlance of the previous sub-section, passive galaxies have SFR. However, since the SFRs of passive galaxies (which are determined from a measurement of the 4000 Å break, Brinchmann et al. 2004) have large uncertainties (e.g. Rosario et al. 2016) we do not use the SFR metric for their selection. Instead, we determine the best fit to the star forming main sequence and then identify passive MaNGA galaxies as those whose SFRs are at least a factor of 10 below the fit, without further quantifying how far below this threshold they lie. In this way, we acknowledge that the exact SFRs of the passive galaxies are uncertain, but simply use their approximate location relative to the main sequence to identify their passive nature. As described above, the main sequence can vary even within the redshift range of the DR7 sample. We therefore use the 64,505 star-forming galaxies with (typical of the MaNGA sample) from the SDSS DR7 to fit the main sequence, as shown by the grey contours in Fig. 3 (note the different axis ranges compared with Fig. 1). The magenta points in Fig. 3 show the 470 MaNGA galaxies that are classified as passive.
3 Data cube processing and spaxel quantities
3.1 Spectral fitting with pipe3d
Pipe3D is a software package designed to fit the stellar continuum and measure the emission line fluxes of IFU data (Sánchez et al. 2016a, 2016b). The Pipe3D code is used in this work to determine all of the spaxel emission line fluxes, surface densities of star formation () and stellar mass ().
The current implementation of Pipe3D adopts the GSD156 library of simple stellar populations (SSPs, Cid-Fernandes et al. 2013), that comprises 156 templates covering 39 stellar ages (from 1 Myr to 14.1 Gyr), and 4 metallicities (Z/Z⊙=0.2, 0.4, 1, and 1.5). These templates have been extensively used within the CALIFA collaboration (e.g. Pérez et al. 2013; González Delgado et al. 2014), and for other surveys (e.g. Ibarra-Medel et al. 2016). Details of the fitting procedure, dust attenuation curve for the stellar population, and uncertainties on the processing are given in Sánchez et al. (2016a, 2016b), but we provide a brief summary here.
A spatial binning is first performed in order to reach a S/N of 50 measured in the range 5590 – 5680 Åaccross the entire field of view (FoV) for each datacube. A stellar population fit of the coadded spectra within each spatial bin is then computed. The fitting procedure involves two steps: first, the stellar velocity and velocity dispersion are derived, together with the average dust attenuation affecting the stellar populations (AV,ssp). In the second step, a multi-SSP linear fitting is performed, using the library described before and adopting the kinematics and dust attenuation derived in the first step. This second step is repeated including perturbations of the original spectrum within its errors; this Monte-Carlo procedure provides the best coefficients of the linear fitting and their errors, which are propagated for any further parameter derived for the stellar populations.
We estimate the stellar population model for each spaxel by re-scaling the best fit model within each spatial bin to the continuum flux intensity in the corresponding spaxel, following Cid-Fernandes et al. (2013) and Sánchez et al. (2016a). These model spectra are then subtracted from the original cube to create a gas pure cube comprising only the ionised gas emission lines (and the noise). Individual emission line fluxes were then measured spaxel by spaxel using both a single Gaussian model for each emission line and spectrum, and a weighted momentum analysis, as described in Sánchez et al. (2016b). Dust extinction is computed on a spaxel-by-spaxel basis using the H/H ratio. An intrinsic value of 2.86 is assumed for this ratio. Corrections for extinction are made to emission line fluxes in each spaxel by assuming a Galactic extinction law following Cardelli, Clayton & Mathis (1989), with RV=3.1.
The star formation rate surface densities were derived using all the H intensities for all the spaxels with detected ionized gas. The intensities are transformed to luminosities (using the adopted cosmology) and corrected for dust attenuation as described above. Finally we apply the Kennicutt (1998) calibration to obtain the spatially-resolved distribution of the SFR surface density. Initially, SFRs are computed for all the spaxels irrespective of the origin of the ionization. By doing so, we take into account the point spread function (PSF) wings in the star-forming regions, that may present equivalent widths (EWs) below the cut applied in Sánchez et al. (2017a) and Cano-Díaz et al. (2016). However, we describe below that only star-forming spaxels are used in the science analysis.
3.2 The resolved star forming main sequence
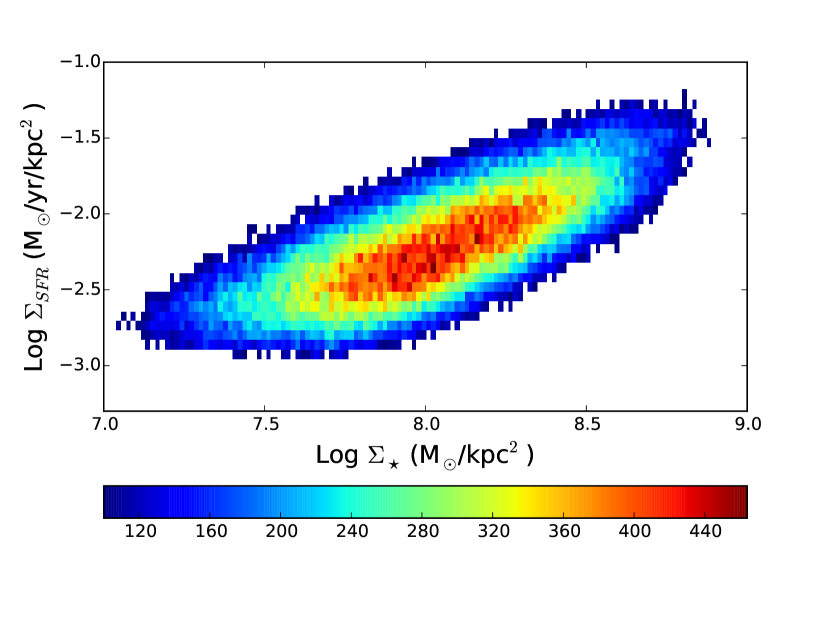
Multi-wavelength imaging and IFU surveys alike have revealed that the relationship between SFR and stellar mass that is known on global scales also exists on local (kpc) scales. This so-called ‘resolved’ star forming main sequence manifests as a tight correlation between and , with a slope that matches that of the global star-forming main sequence, both locally (e.g. Sánchez et al. 2013; Cano-Díaz et al. 2016; González-Díaz et al. 2016; Abdurro’uf & Akiyama 2017; Maragkoudakis et al. 2017; Hsieh et al. 2017) and at high redshift (e.g. Wuyts et al 2013; Magdis et al. 2016).
In Fig. 4 we show the ‘resolved’ star forming main sequence derived from star-forming spaxels in the MaNGA DR13 datacubes. Spaxels are considered as star-forming if they have a measured value of and , are designated as star-forming by the Kauffmann et al. (2003a) emission line criteria and have S/N3 in all 4 diagnostic emission lines used therein. Out of 2 million spaxels with measured by PIPE3D, there are 487,000 star-forming spaxels in the MaNGA DR13 sample according to the above criteria. We note that these star forming spaxels can be taken from any galaxy, including galaxies not classified as star-forming based on their global spectroscopy, as long as the spaxel itself is classified as star-forming. The S/N criteria that we impose result in an effective sensitivity down to log (Fig 4). We have experimented with both relaxing and tightening the spaxel S/N requirement and although it does impact the effective threshold, it does not qualitatively alter the conclusions of this work. Further discussion of selection biases is presented in Sec. 4.2.
We use the resolved star forming main sequence as a starting point for our investigation of where star formation is quenched or boosted. Hsieh et al. (2017) have recently shown that star forming spaxels in quiescent galaxies observed with MaNGA lie below the resolved main sequence; here we extend that work by looking at a radial dependence of that suppression.
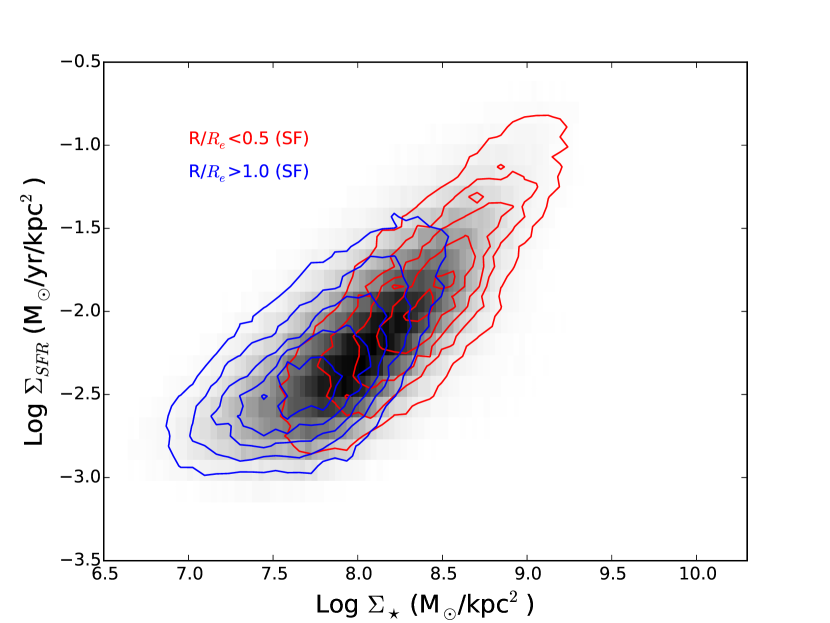
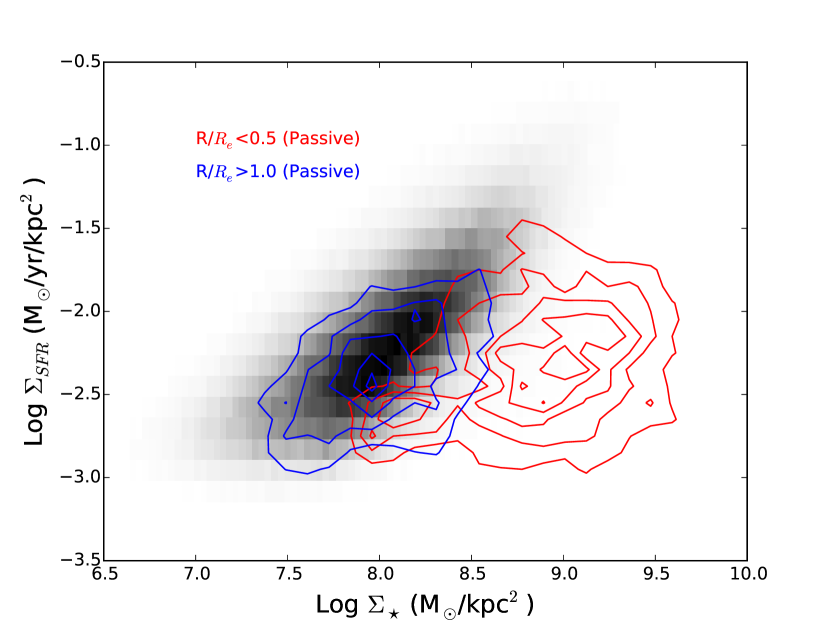
In Fig. 5 we again show the distribution of all 487,000 star forming spaxels in the MaNGA DR13 sample. In addition, we show in the distributions of spaxels for just the star forming galaxies (upper panel) and just the passive galaxies (lower panel) split into two radial subsamples of and in red and blue contours respectively (where is measured from the IFU centre). As expected from known mass profiles (e.g. González Delgado et al. 2014, 2015), both galaxy samples are dominated by high at low radii and low at large radii. The star forming galaxies do not show any obvious offset from the resolved main sequence as a function of radius. This is perhaps not surprising as the star forming galaxy sample contains galaxies both above and below the main sequence (Fig. 2), such that opposing trends are likely to be present. The main result of Fig. 5 is conveyed in the lower panel in which it is seen that spaxels at in passive galaxies lie far below the resolved main sequence, with almost an order of magnitude lower than expected for their . Conversely, the outer spaxels of passive galaxies appear to lie mostly on the main sequence, with only a minority (as shown by the outer blue contour in the lower panel of Fig. 5) filling the region between the sequence and the sample sensitivity. Fig. 5 therefore provides evidence that the inner regions of passive galaxies are experiencing a preferential suppression of star formation, or ‘inside-out’ quenching. However, a more detailed radial decomposition of offsets from the resolved main sequence is needed in order to reveal the full nature of star formation quenching and boosting. In the next sub-section, we will quantify the metric developed for this task.
3.3 offsets for spaxels
The existance of a local-scale star forming main sequence means that it is possible to compute the offset between each spaxel’s measured and that of a set of matched control spaxels to yield a , in an analogous way to our calculation of a global SFR. The pool of spaxels used to construct the bespoke control sample for any given spaxel includes all 487,000 star-forming spaxels (defined above).
In computing the global SFR, we made our control sample by matching in stellar mass, redshift and local density, under the assumption that these parameters could modulate changes in the galactic total SFR. For the spaxel calculation, we must again assess the relevant matching parameters. By definition, an offset from the resolved main sequence must at least be matched in , for which we adopt a matching tolerance 0.1 dex. To account for higher order (i.e. not simply related to exponential profiles, e.g. González Delgado et al. 2014, 2015; Sánchez et al. 2017b) radial gradients we additionally match in the spaxel position, which we quantify via the radial distance, , from the IFU centre in units of -band half light (effective) radius (, taken from Simard et al. 2011). The radial distance of a given spaxel is matched to controls within 0.1 . We note, however, that this radial matching does not appear to play a significant role as we recover qualitatively similar results without radial matching.
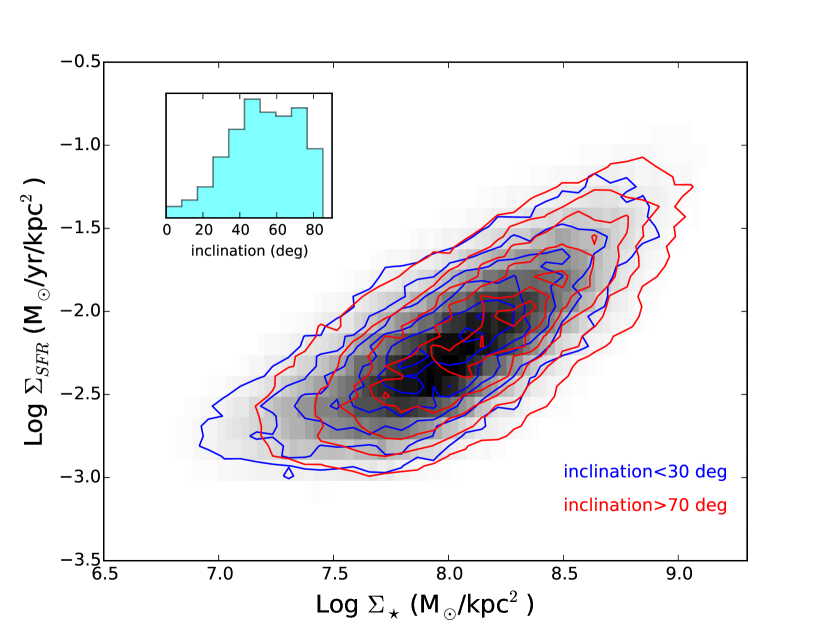
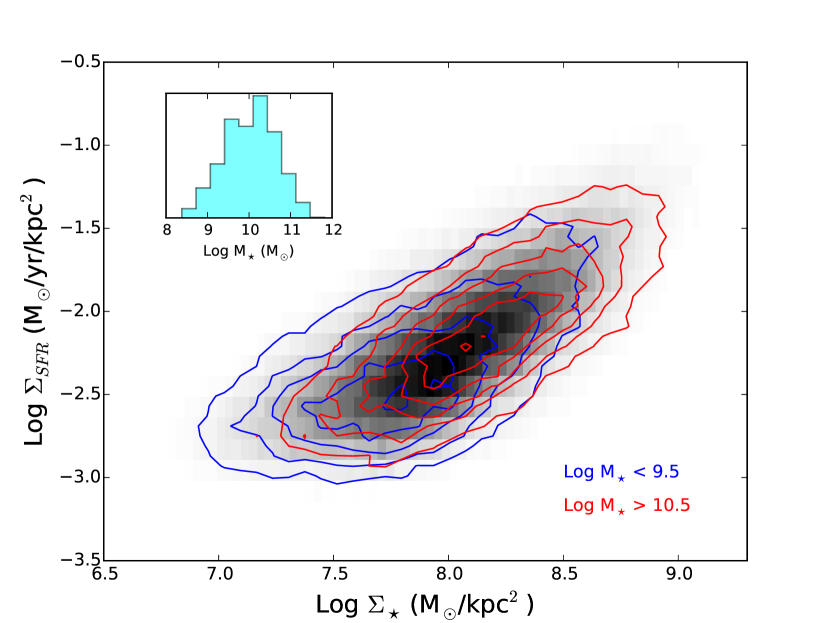
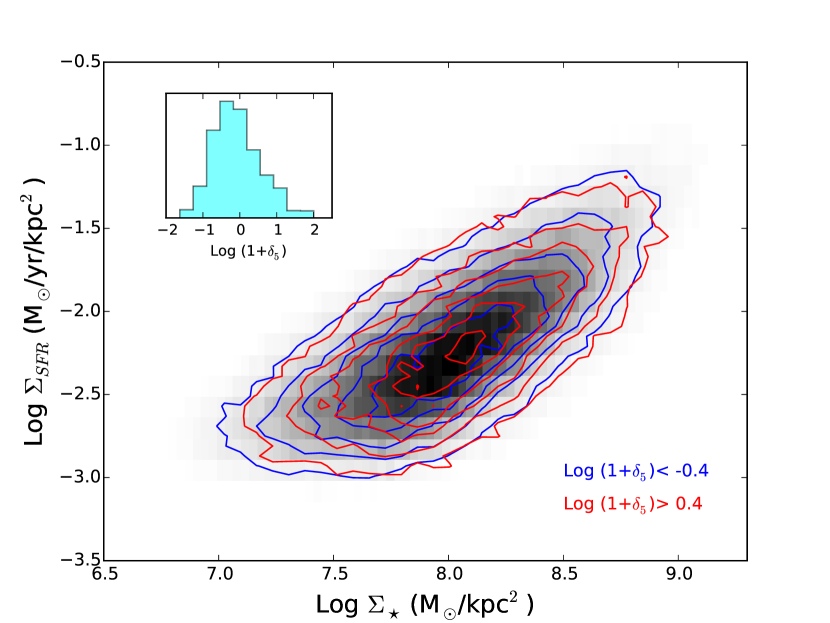
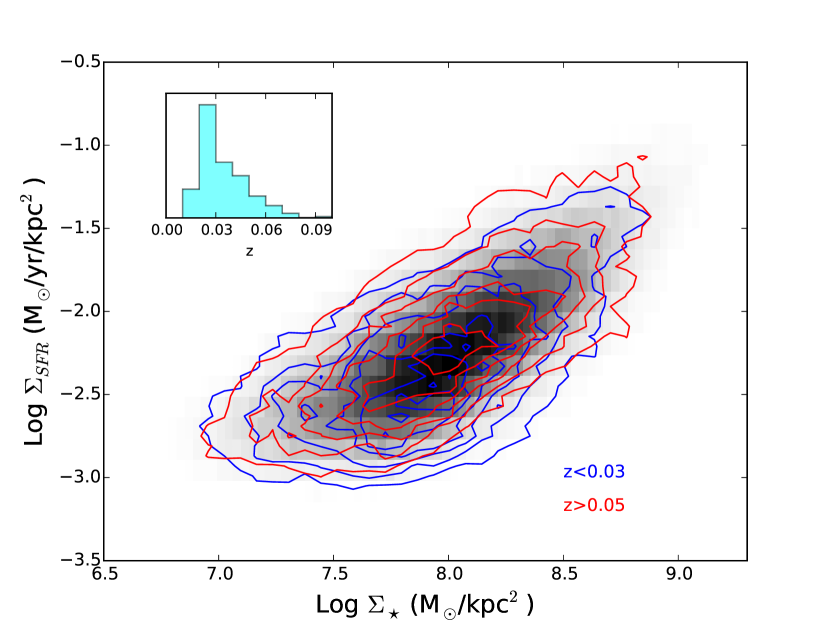
We investigate the need to match on global galaxy parameters by looking for a dependence on the resolved star forming main sequence within these parameters. In Fig. 6 we show the main sequence for the full sample of star-forming spaxels in the grey 2-d histogram and in coloured contours the distribution for two bins of inclination (top left panel), total stellar mass (top right panel), environment (bottom left panel) and redshift (bottom right panel). No dependence of the resolved main sequence is found for any of the tested properties, leading us to conclude that, for the range of properties in our sample, the resolved main sequence is invariant to changes in these properties.
One galaxy property that has been previously shown to impact the resolved main sequence is morphology, wherein galaxies with higher bulge fractions tend to exhibit lower for their (e.g. González Delgado et al. 2016; Maragkoudakis et al. 2016). However, we do not match in galaxy B/T in our calculation for several reasons. First, our sample is dominated by galaxies with B/T 0.4, a regime in which morphology does not strongly affect the resolved main sequence. Second, Pan et al. (in prep) have shown that truly star forming spaxels, selected using emission line diagnostics in a similar way to our procedure described above, show relatively little dependence on bulge fraction. Instead, Pan et al. (in prep) conclude that resolved main sequence offsets for high B/T galaxies are dominated by spaxels ionized by other processes. Finally, the global main sequence shows a similar dependence on structure, in which bulge dominated galaxies tend to have low SFR for their M⋆ and have a higher quenched fraction (e.g. Wuyts et al. 2011b; Bluck et al. 2014). In this sense, the global main sequence is once again an extension of the kpc-scale relationships. We therefore do not match spaxels based on their parent galaxy’s morphology, since morphology itself appears to correlate with SFR, but return to investigate the dependence on B/T explicitly in Section 4.1.
The assembly of the control spaxels thus entails matching on and distance from the galaxy centre (in units of ) and is computed as:
| (3) |
As for the global SFR, is taken as the median value of all of the matched control spaxels. As for the calculation of SFR, we again require at least 5 spaxels to be matched in order to consider the control matching successful. If fewer than five spaxels are matched the tolerances are iteratively grown by a further 0.1 dex and 0.1 in and respectively. However, in practice the very large control pool of star-forming spaxels means that 99 percent of spaxels have the required limit of 5 matched spaxels without the need to grow the matching tolerances. The mean number of matched control spaxels to any given spaxel is 6000.
In closing this section, we note that theoretically captures the same relative difference in star formation as profiles of spaxel specific SFR (sSFR, e.g. González Delgado et al. 2015; Belfiore et al. 2017b; Spindler et al. 2017; Morselli et al. in prep), since both measure a SFR relative to a mass. However, there are two reasons we adopt instead of sSFR in this work. First, with the metric we are able to additionally control for any extra parameters of interest; in our definition of we control for radius as well as mass surface density. Second, a differential analysis, which computes a relative to a matched control, mitigates spaxel selection biases. Due to the S/N criterion of our star forming spaxel sample, we are incomplete for low at low . Consequently, the mean spaxel sSFR is biased to high values at low which preferentially occur at large radii, and subsequently alter the radial profiles. Further issues related to spaxel selection biases are discussed in Section 4.2.
3.4 O/H offsets for spaxels
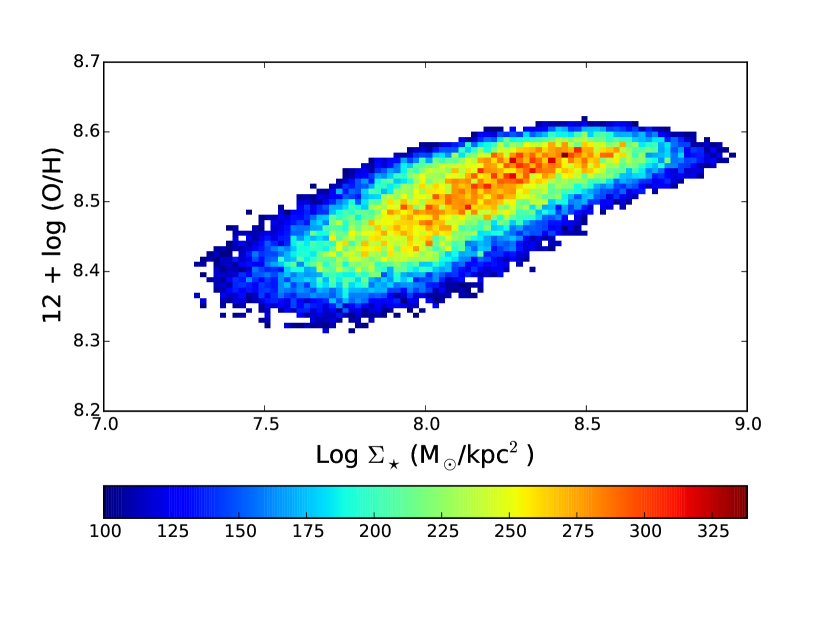
Just as the star forming main sequence is a global rendering of the resolved relation (Fig 4), the global mass metallicity relation (MZR, e.g. Tremonti et al. 2004; Ellison et al. 2008b) is recovered on local scales (Moran et al. 2012; Rosales-Ortega et al. 2012; Barrera-Ballesteros et al. 2016). Following Barrera-Ballesteros et al. (2016), the gas phase metallicities are computed for each spaxel using the calibration of Marino et al. (2013), which is based on a large compilation of direct electron temperature () abundance measurements. In particular, the Marino et al. (2013) calibration extends previous efforts to calibrate abundances against strong emission lines (e.g. Pettini & Pagel 2004) by including Hii regions that extend to higher metallicity. Based on a fit to 603 Hii region abundances and their ratios of [Oiii], [Nii], H and H lines, Marino et al. (2013) find a best fitting relation:
| (4) |
where
| (5) |
Metallicities are computed for all of the star forming spaxels in our sample using equations 4 and 5 using the extinction corrected fluxes, as described in Sec. 3.1. The resulting resolved mass metallicity relation for the star forming spaxels in our MaNGA sample is shown in Fig. 7 (as previously found by Barrera-Ballesteros et al. 2016).
Having established the local MZR for the MaNGA spaxels, we can now compute a spaxel metallicity offset in an analogous way to the calculation of the spaxel , matching each spaxel to a control in a narrow tolerance of and . Thus, the metallicity offset is defined as:
| (6) |
Once again, this differential approach mitigates biases and selection effects. In the case of metallicity calibrations, it is well known (e.g. Kewley & Ellison 2008) that different strong line diagnostics can yield abundances that differ by almost an order of magnitude. However, relative abundances, within a given calibration, are quite robust.
4 Star formation profiles as a function of main sequence offset
The main goal of the present work is to investigate the radial profiles of star formation as a function of the global galaxy main sequence offset (SFR), in order to gain insight into the mechanisms that modulate star formation. Since galaxies fundamentally show radial gradients in star formation (e.g. González Delgado et al. 2016), we can’t use the profiles alone to assess where, and by how much, star formation is particularly boosted or suppressed. On the other hand, since controls (for each spaxel) for both (hence the expected ) and radial position in the galaxy, it removes the underlying star formation rate gradient. Therefore, is a measure of how much extra (or less) star formation is in a given spaxel compared to the ‘norm’ for its and radial distance from the centre.
4.1 Radial profiles
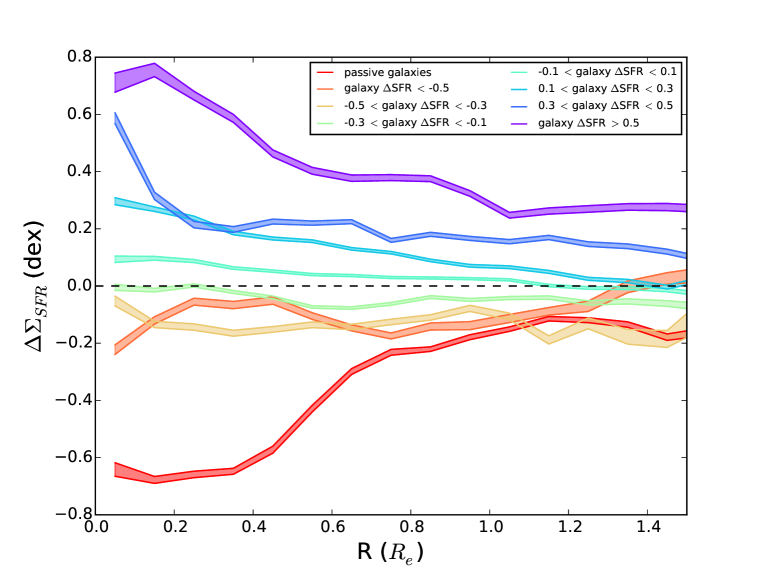
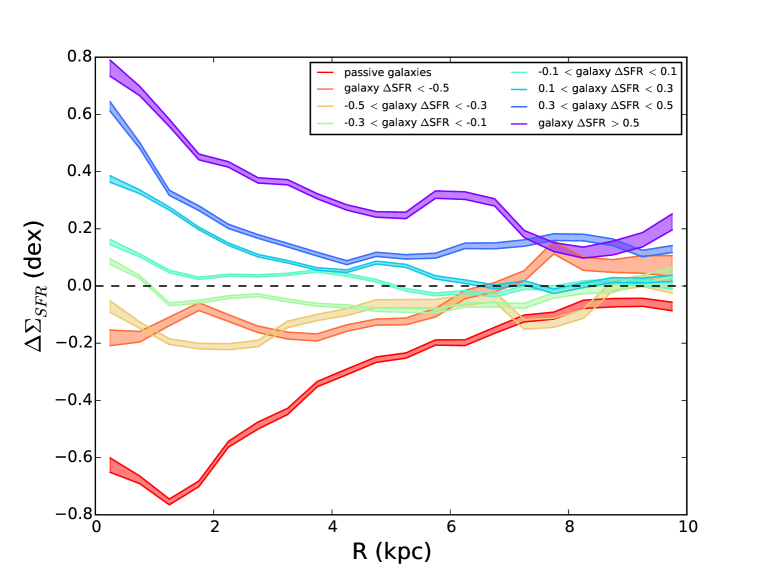
In Fig. 8 we present median profiles of in bins of SFR in units of both (top panel) and kpc (bottom panel). For reference, the average half light radius in the sample is 6 kpc. The median PSF of MaNGA observations (2.5 arcsec) corresponds to 1.5 kpc at the median redshift of the sample (), such that the radial profiles are well resolved. Fig. 8 shows that galaxies that lie above the global star-forming main sequence (positive SFR) exhibit elevated out to at least 1.5 times the galactic half light radius ( 10 kpc), with the average enhancement proportional to the global SFR. Moreover, the values increase towards smaller radii, indicating that galaxies above the main sequence are particularly prodigious in their star formation within the inner 0.5 ( 3 kpc). The radial profiles of shown in Fig. 8 indicate that boosts in star formation are apparently regulated from the inside out.
Turning now to galaxies located below the main sequence. In contrast with the significant (several tenths of a dex) galaxy-wide enhancement of star formation in positive SFR galaxies, star forming galaxies below the main sequence exhibit modest suppression of . Even in our most extreme bin of SFR , the radial average profile of does not drop below dex. There is also no strong radial dependence of in star-forming galaxies that lie below the main sequence. Our results are therefore consistent with Belfiore et al. (2017b) whose sample of ‘green valley’ galaxies, which show fairly uniformly suppressed sSFRs and are qualitatively similarly to our ‘below main sequence star forming’ galaxies. However, the passive galaxy population (whose equivalent SFR ) does show a strong radial profile. At large radii (beyond the half light radius) the suppression of star formation is mild, only 0.2 dex and consistent with star forming galaxies that are only a factor of a few below the main sequence. However within 0.5 ( 3 kpc) the star formation is suppressed by a factor of 4, a suppression which mirrors the enhancement seen in the galaxies located in the highest slice above the main sequence. The strong central SFR suppressions in the passive population are qualitatively similar to the ‘centrally suppressed’ galaxies studied by Spindler et al. (2017).
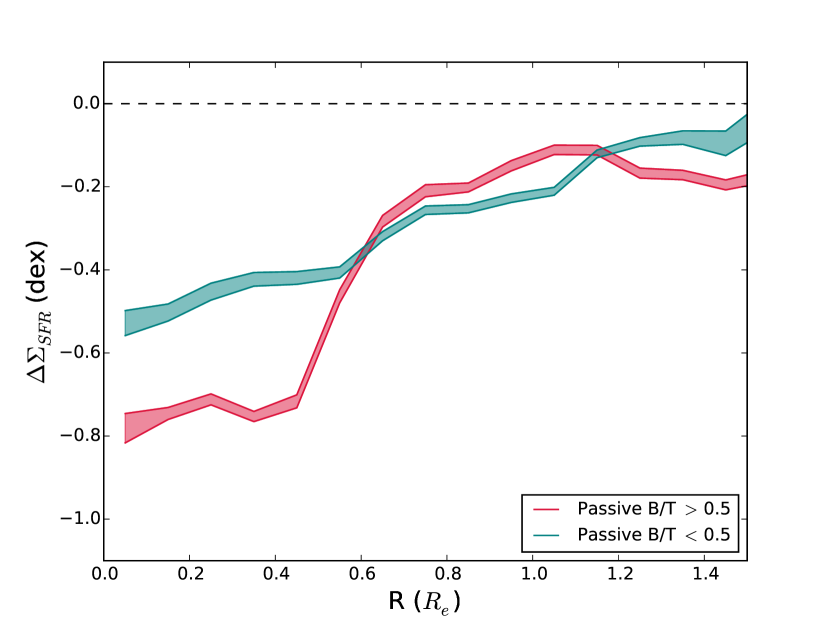
The trends in profiles for star-forming galaxies in Fig. 8 are not driven by variations in bulge fraction. González Delgado et al. (2016) have shown that the profiles of disk dominated galaxies show little dependence on their detailed morohology (bulge fraction). For the star-forming sample studied here, 85 per cent of galaxies have -band B/T0.4. However, the passive sample has a broader range of B/T; approximately 2/3 of the 470 galaxies in that sample have B/T 0.5. In Fig. 9 we separate the passive population into bulge dominated (B/T0.5) and disk dominated (B/T0.5) sub-samples. As discussed in Tachella et al. (2015b), radial dependences on bulge fraction can be potentially misleading when B/T is measured in optical light. We have therefore defined our bulge fractions in mass, using the bulge and disk mass catalog of Mendel et al. (2014). From Fig. 9 it can be seen that the passive galaxies in both morphological bins show similar profiles beyond 0.6 . However, passive galaxies that have assembled a significant bulge have a factor of two lower central , compared with disk dominated passive galaxies. The profiles of passive galaxies therefore appear to be dependent on the presence of a bulge.
4.2 Spaxel selection biases
We have checked that the profile for passive galaxies is not an artefact of the spaxel selection process, in which we have imposed a S/N limit of 3, which in turn limits the threshold of the sample (Fig 4). A particular concern may be that, at low (typically found in the outer disk) our selection preferentially excludes low spaxels and could hence bias the profile to large values at large radii. This effect should be largely mitigated by our differential approach of a matched comparison sample, in which control spaxels are subject to the same bias. Nonetheless, we have repeated the profile analysis with a less aggressive S/N threshold, requiring only that the spaxel be below the Kewley et al. (2001) demarcation, H EW exceeds 6Å and that the H and H S/N 1. The combination of the Kewley et al. (2001) AGN criterion with an H EW cut has previously been used as a more inclusive selection for star forming spaxels (e.g. Sánchez et al. 2014; Pérez-Montero et al. 2016; Sánchez-Menguiano et al. 2016). Relaxing the S/N threshold effectively extends the threshold of the resolved main sequence by almost 1 dex, such that the lowest star formation rate surface densities extend to . Despite this effective increase in sensitivity to low the profiles of remain qualitatively unchanged. Importantly, the values at large radii are robust. The main difference in the profiles when we adopt an H EW limit is that the suppression of star formation in passive galaxies at small radii is reduced from dex to dex. This is because the H EW is equivalent to a specific SFR, such that a cut at H EW = 6 Å is approximately a cut of log sSFR yr-1. Therefore, an H EW cut introduces a bias against spaxels with low sSFR surface density and spaxels signficantly below the main sequence (such as those at small radii in passive galaxies, as shown by the red contours in Fig 5). For the purposes of our analysis, a spaxel selection based on S/N cut is therefore more sensitive to the central suppresion of star formatin than a combination of the Kewley et al. (2001) threshold and an H EW cut.
As another test of possible selection bias, we have also repeated the profile analysis including only spaxels above log = 8 M⊙/kpc2, above which the selection on the resolved main sequence should be fairly complete (see Fig. 4). Again, the profile shape for the passive galaxies is qualitatively similar. Finally, we refer the reader back to Fig. 5 in which the spaxels at large in passive galaxies (blue contours in the lower panel) are mostly on the main sequence, even though the parameter space is sensitive to lower values of . We conclude that the positive gradient in for passive galaxies in Fig. 8 is not a result of selection biases, but reflects a true relative decrease in the star formation towards the centres of galaxies that lie well below the main sequence.
5 Discussion
The main goal of the current work has been to quantify the radial profile of star formation rate regulation at . We have made a careful definition of a galaxy’s global star formation rate relative to the ‘norm’, by computing a SFR relative to stellar mass, redshift and local environment average. We also introduce a new metric, , which measures a spaxel-based star formation enhancement or deficit relative to the resolved main sequence, permitting a radial assessment of where star formation is boosted or quenched. We now review our results in the context of the mechanisms that regulate the radial star formation profiles and other work in the literature.
5.1 Positive offsets from the main sequence - where do star bursts happen?
In terms of galaxies that lie above the global main sequence, the primary result of this paper is that elevated is present throughout the galaxy, with the greatest enhancements in the central regions (purple and blue profiles in Fig 8). Our result is consistent with the SDSS study of Morselli et al. (2017) who use bulge and disk photometry of SDSS galaxies to conclude that galaxies above the main sequence require both star forming disks and star forming bulges.
Several recent studies at moderately high redshifts have similarly concluded that elevated star formation is widespread in galaxies that lie above the main sequence. Magdis et al. (2016) have shown that correlates with main sequence offset at , although they do not investigate the radial dependence of the elevation. Nelson et al. (2016) further showed that the elevation in star formation for galaxies lying above the main sequence at these redshifts was roughly constant (a factor of 2) throughout the disk on scales of 2–6 kpc (see also Morselli et al., in prep), and is reproduced by simulations of galaxies with burtsy histories (Orr et al. 2017). These results are consistent with our result in Fig 8 that show elevated out to at least 10 kpc. However, we additionally find that the profile of star formation enhancement increases further in the central 3 kpc (0.5 ). Although the Nelson et al. (2016) sample is at considerably higher redshift than ours, another possible reason for the apparent discrepancy between the relative SFR enhancements in the central region could be the role of dust, which is unaccounted for in the Nelson et al. (2016) study. Galaxies above the main sequence are characterized by elevated levels of both star formation and dust (Wuyts et al. 2011b; Whitaker et al. 2012). Hence, the uncorrected H fluxes may under-estimate the total SFR (Wuyts et al. 2011a,b), which may be a particular issue in the central regions of highly star forming galaxies. Finally, a high redshift ( 2) analog of our results is presented by Tacchella et al. (2017) who find that galaxies above the main sequence have higher sSFRs in the inner 3 kpc than at larger radii, consistent with expectations of gas inflow models (Tacchella et al. 2016a,b).
5.1.1 The role of mergers
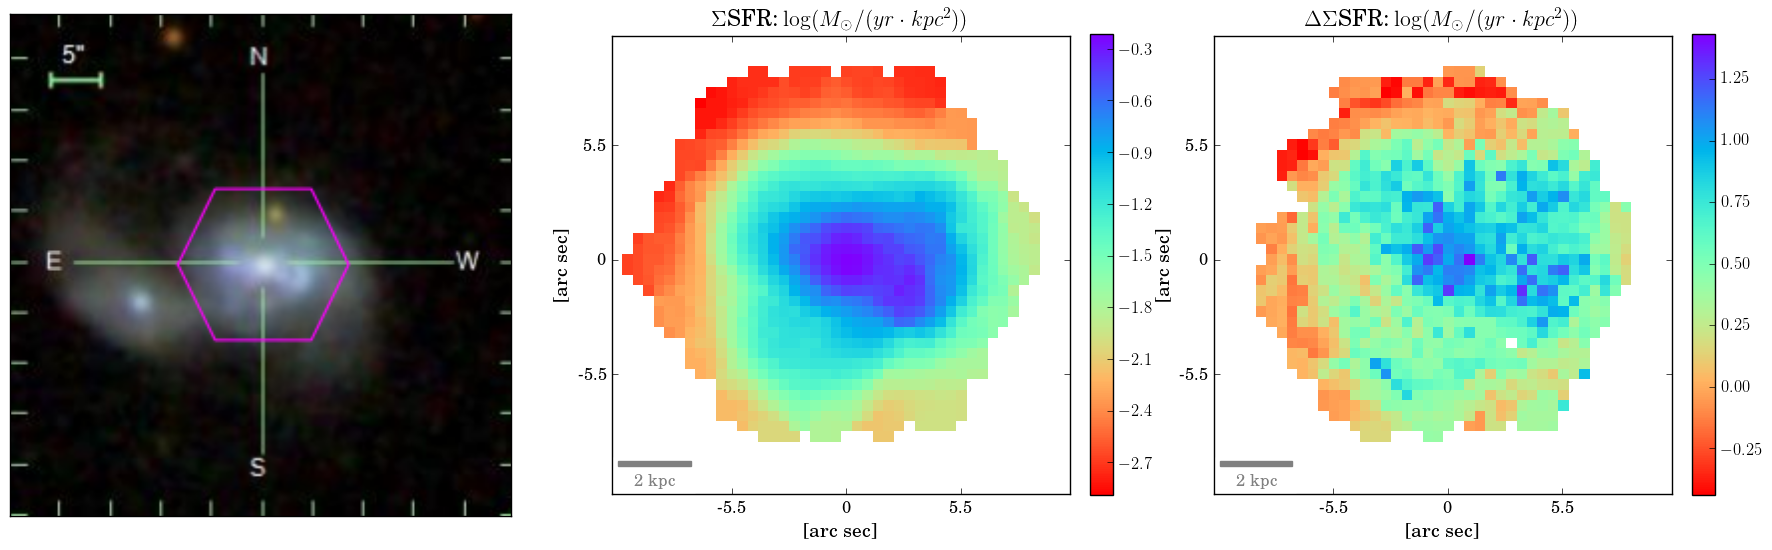
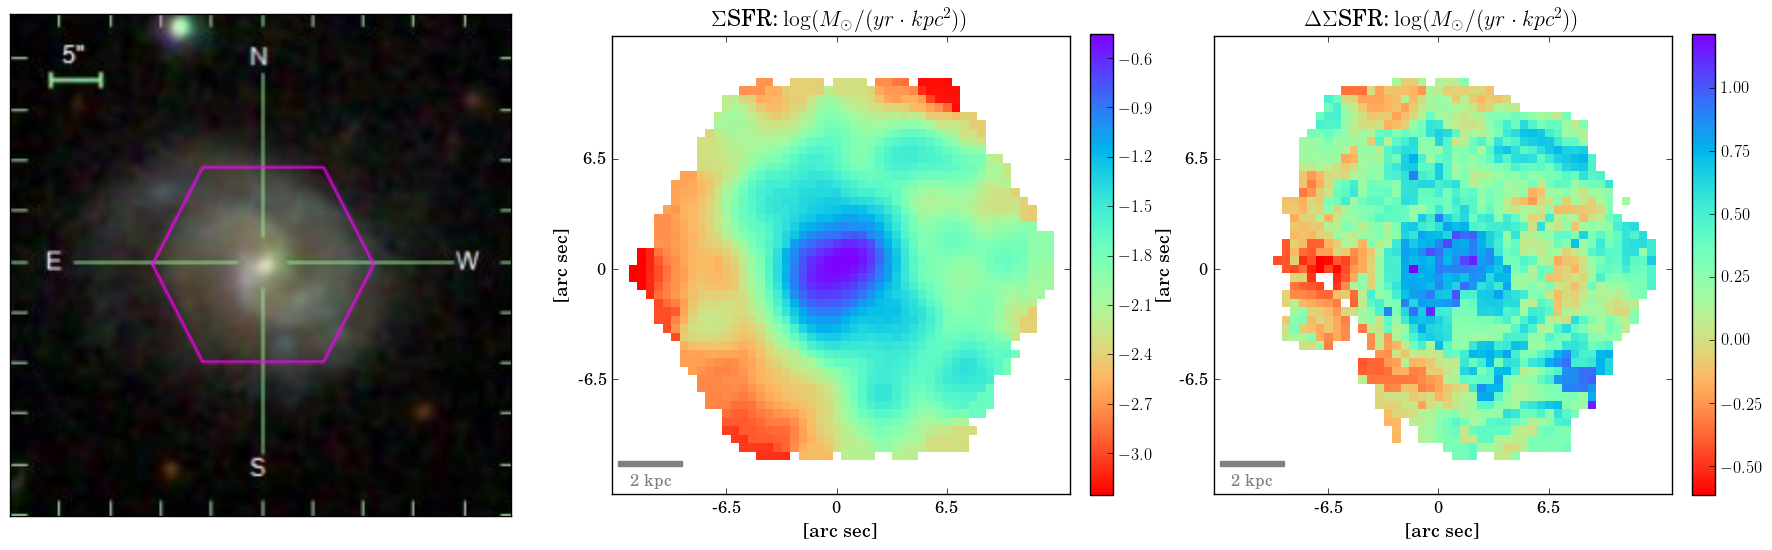
The observation of enhanced in the central regions of galaxies is consistent with theoretical expectations of triggered star formation in galaxy mergers (e.g. Barnes & Hernquist 1991; Mihos & Hernquist 1994, 1996; Torrey et al. 2012; Moreno et al. 2015). Indeed, observations with both single fibre (e.g. Ellison et al. 2013) and IFU data (Barrera-Ballesteros et al. 2015; Cortijo-Ferrero et al. 2017a,b) have confirmed that SFR enhancements in galaxy mergers can be widespread, but are statistically centrally located. This is further supported by CO observations of merging galaxies that find compact central molecular gas disks from which the starburst is fed (e.g. Ueda et al. 2014; Yamashita et al. 2017). A visual inspection of the galaxies with the largest SFR enhancements above the global main sequence reveals that some are clearly galaxy mergers. In Fig. 10 we show two such examples. Panels in the upper row show the SDSS image, map of and map of (from left to right) of a galaxy with a close companion (outside of the MaNGA footprint, shown by the magenta hexagon), whose SFR is +1.11 dex, one of the highest main sequence offsets in our sample. The lower panels in Fig 10 represent the same quantities for another galaxy merger with SFR = +0.39 dex. Evidence for an interaction with a much fainter companion can be seen outside of the MaNGA footprint towards the north east. The maps (right panels) for both galaxies clearly show that the central regions exhibit the greatest star formation rate enhancements. A study focusing specifically on the star formation rate profiles of galaxies in mergers will be presented in a forthcoming work.
Despite the presence of mergers in the MaNGA sample, overall they are in the minority. We performed a visual classification of galaxies that either have a close companion or show obvious signs of interaction (including postmergers: single galaxies with signs of disturbance). Of the 392 star forming MaNGA galaxies used in this work, only 50 have an obvious companion or are classified as a post-merger We have repeated our analysis of profiles excluding galaxies that have either been identified as a possible merger by our visual classification, or with a strict merger vote fraction cut (pMerger0.05) based on Galaxy Zoo (Lintott et al. 2008; Darg et al. 2010). There is no significant change in our results when spaxels located in galaxies engaged in an interaction are excluded, indicating that (in general) other processes drive the centrally enhanced profiles in Fig. 8. Nonetheless, it remains possible that the accretion of external gas still plays an important role in triggering centrally concentrated star formation, since minor mergers, interactions with dwarf satellites and smooth accretion would be difficult to identify visually (and are likely much more frequent than major mergers). For example, Chen et al. (2016) have inferred the accretion of external gas in nine blue galaxies in the MaNGA sample from their counter-rotating gas kinematics. These galaxies are characterized by high central SFRs, but without any obvious sign of an on-going or recent merger.
5.1.2 In the context of the compaction model
Simulations of high redshift galaxies have recently been used to conclude that a variety of processes can lead to intense gas inflow events leading to compact central star formation (e.g. Dekel & Burkert 2014; Zolotov et al. 2015; Tacchella et al. 2016 a, b), including mergers of varying mass ratios, streams and tidal compression. Although the process of compaction is expected to operate most dramatically at high redshifts, where both the merger rate and disk gas fractions are higher than the present day, our results qualitatively match the expected centrally peaked star formation in galaxies above the main sequence (e.g. Fig. 11 of Tacchella et al. 2016a). However, the compaction model predicts the centrally enhanced star formation to be accompanied by a reduction (or at most, consistent) star formation in the extended disk (e.g. Tacchella et al. 2016b). This is not seen in our observations: galaxies that lie above the global main sequence have elevated (i.e. positive ) throughout the disk. We note that since we are radially averaging the profiles (e.g. in Fig. 8) the star formation enhancements in the disk regime are not necessarily uniform. Indeed, the positive beyond are often due to clumps of enhanced star formation at a few specific sites within the disk, similar to clumps in higher redshift galaxies (e.g. Wisnioski et al. 2011; Wuyts et al. 2012, 2013). Averaged together radially, these localized sites of enhanced star formation manifest as an elevated platform of star formation, similar to that seen in galaxies (Nelson et al. 2016).
The inflow of gas that precedes the central starburst in a ‘wet compaction’ event might be expected leave an imprint on the gas phase metallicity of the galactic interstellar medium (ISM). Most of the mechanisms that trigger the gas inflow are expected to lower the central metallicity. For example, mergers and disk instabilities channel gas from the outer, more metal-poor disk towards the centre (Rupke, Kewley & Barnes 2010; Perez, Michel-Dansac & Tissera 2011; Sillero et al. 2017). Accretion of satellites (or minor mergers) and intergalactic streams are also expected to deliver relatively metal-poor gas (e.g. Finlator & Davé 2008). Such inflow models may explain the dependence of the mass metallicity relation on SFR (e.g. Ellison et al. 2008b) and the dependence of galaxy metallicity gradients on specific SFR (Stott et al. 2014).
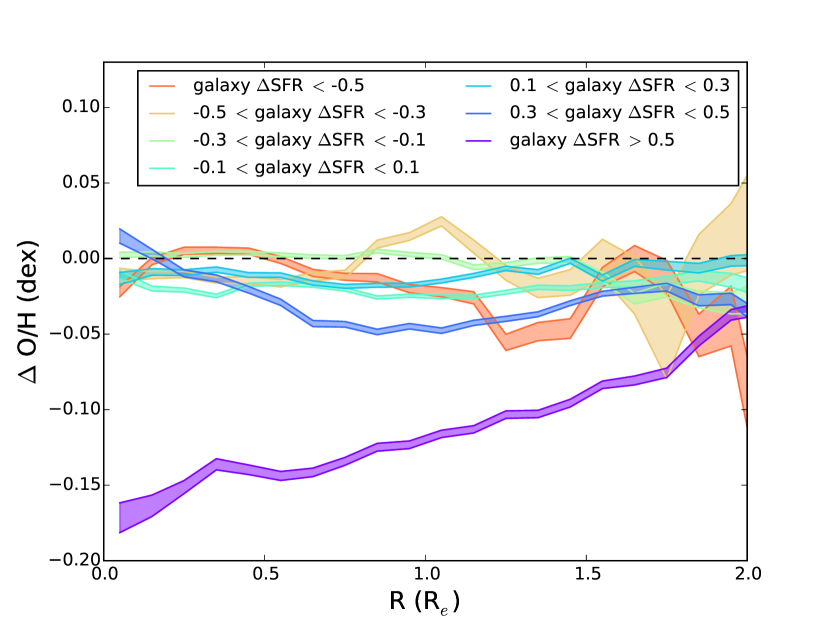
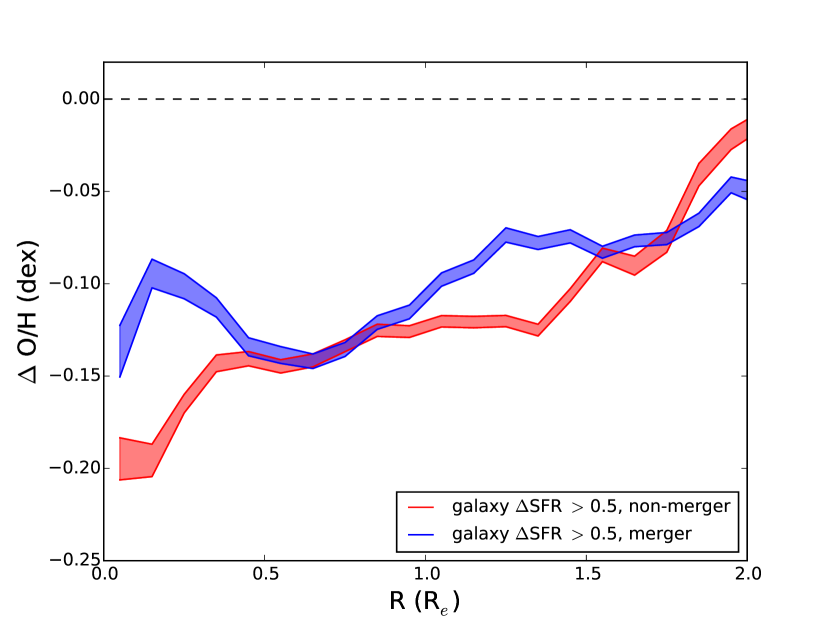
For the star-forming galaxies in our sample, in the top panel of Fig. 11 we plot the radial distribition of O/H in bins of SFR. This plot is analogous to the profiles of in Fig. 8. The expected central dilution of metallicity is clearly present in the galaxies that are furthest offset above the main sequence (by at least a factor of three, purple line in the top panel Fig. 11). The metallicity dilution shows a steady radial profile, increasing from dex in the central region to an almost ‘normal’ metallicity at 2 . This widespread dilution indicates that if these galaxies are diluted as a result of metal-poor gas inflow, the source of that gas must either be external, or originating from beyond 2 . Of the 21 galaxies in this highest SFR bin, 6 have either a close companion (including the example in the top row of Fig. 10) or show tidal features indicative of a recent merger, a process previously reported to lead to central metallicity dilution (e.g. Kewley et al. 2010; Rich et al. 2012; Cortijo-Ferrero et al. 2017a). In order to test whether the positive metallicity gradients seen in the highest SFR bin of Fig. 11 is driven by merging galaxies, in the lower panel of that figure we distinguish the mergers and non-mergers in the SFR bin. Both the mergers and non-mergers show similar dilution profiles, indicating that a process other than a recent (major) merger can be responsible for both the starburst and metallicity dilution of these high SFR galaxies. Based on their simulations, Sillero et al. (2017) conclude that it is the efficiency of gas delivery, whether due to a merger or other process, that sets the relation between diluted central metallicity and enhanced SFR. Fig. 11 also shows that there is no significant dilution for the rest of the star-forming galaxies, including those elevated above the main sequence by factors of 2–3. Apparently, these galaxies have modestly enhanced their global SFRs either without the influx of metal-poor gas, or they have already re-enriched their ISM. Our results are consistent with those of Stott et al. (2014) who found that galaxies above the main sequence have flatter abundance gradients, an effect that is most evident for specific SFRs at least a factor of five in excess of the main sequence expectation.
Barrera-Ballesteros et al. (2016) have recently found that low mass galaxies (log (M⋆/M⊙) 9.2) exhibit central metallicities that are systematically below the resolved mass-metallicity relation by 0.1 dex. Of the 21 galaxies in the SFR bin in Fig. 11, six have masses log (M⋆/M⊙) 9.2. Computing the O/H gradients only for galaxies with total stellar mass above this threshold does not significantly alter our results, and the centrally diluted metallicity for galaxies with SFR 0.5 persists.
The compaction model predicts that galaxies with positive SFR should not only have high central , but also high gas fractions and surface densities. (e.g. Tacchella et al. 2016a). High global molecular gas fractions have indeed been measured for SDSS galaxies above the main sequence (e.g. Saintonge et al. 2012, 2016; Sargent et al. 2014; Violino et al. 2017). At more moderate redshifts, galaxies with positive SFR also appear to be dustier than their main sequence counterparts (Whitaker et al. 2012). The gas and dust channeled towards the inner parts of the galaxy could potentially fuel not only central star formation, but also a dust-obscured AGN. Mid-IR selected AGN do indeed seem to exhibit elevated SFRs both locally and at moderately high redshifts (Juneau et al. 2013; Cowley et al. 2016; Ellison et al. 2016; Azadi et al. 2017).
However, to move beyond these indirect elements of support for the connection between a central excess of gas and the compaction scenario, it is desirable to directly map, on kpc scales, the distribution of cold gas as a function of main sequence offset. Unfortunately, to achieve this for a significant fraction of MaNGA galaxies is presently unrealistic observationally. One possible alternative would be to obtain such gas and dust maps indirectly. For example, Brinchmann et al. (2013) present a technique to use optical emission lines to infer total gas surface densities. Applying this technique on a spaxel-by-spaxel basis to the extant MaNGA data, whereby excesses of gas and star formation in the same data set could be mapped on kpc scales, would be of great interest.
5.2 Negative offsets from the main sequence - where is star formation quenched?
The topic of galaxy quenching has been extensively discussed in the literature and several papers have used radial profiles of the specific SFR or its equivalent to conclude that quenching occurs from the inside out (e.g. González Delgado et al. 2016; Belfiore et al. 2017a; Sánchez et al. 2017b; Morselli et al. in prep). In Fig. 8 we confirm the same trend in in passive galaxies - a radially dependent deficit of star formation that is largest in the inner few kpc. However, our results also demonstrate that galaxies below the main sequence (including the passive population) have suppressed star formation throughout their disks. Our results are consistent with other recent MaNGA investigations which have found that galaxies with suppressed star formation tend to show reduced sSFR at all radii (e.g. Belfiore et al. 2017b; Spindler et al. 2017).
Much of the discussion in the literature concerning the cessation of star formation has focussed on the link between the tendency of a galaxy to be passive (or quenched) and its inner stellar density, either implied through structural parameters (e.g. Wuyts et al. 2011b; Bluck et al. 2014; Lang et al. 2014; Omand et al. 2014) or through measurements of within the central 1 kpc (e.g. Cheung et al. 2012; Fang et al. 2013; Barro et al. 2013; Woo et al. 2015; Whitaker et al. 2017). Moreover, it is observed that quiescent galaxies have a higher central for their M⋆ (e.g. Fang et al. 2013; Barro et al. 2017) possibly indicating that galaxies’ central mass growth is a pre-cursor to quenching. The connection between quiescence and central mass concentration, and inside out quenching has also been observed at high redshifts, out to 2 – 3 (Tacchella et al. 2015a; Barro et al. 2017; Brennan et al. 2017). These observations provide complementary evidence that quenching is linked to mechanisms operating in the central galactic regions which in turn lead to an inside out shut-down of star formation.
The exact cause of this inside-out quenching is still debated, and could include the exhaustion of gas in the central regions, AGN feedback or through the increasing stability of the gas disk (e.g. Dekel & Burkert 2014). The first of these scenarios might be expected to lead to low gas fractions in galaxies following the starburst phase. However, measurements of the molecular gas fraction in post starburst galaxies show that they can still harbour significant gas reservoirs (French et al. 2015; Rowlands et al. 2015; Suess et al. 2017). Similarly, galaxy mergers, which can cause boosted central SFRs and represent one of the mechanisms for ‘wet compaction’, show no depletion in their neutral gas content (Braine & Combes 1993; Ellison et al. 2015) and even have elevated molecular gas fractions (Combes et al. 1994; Violino et al. 2017; Sargent et al. in prep). Finally, there is abundant evidence that early type galaxies (which have little or no on-going star formation) frequently contain significant atomic and molecular gas reservoirs (Young et al. 2011; 2014; Serra et al. 2012; Davis et al. 2016). Combined, these observations indicate that galaxy-wide gas exhaustion may not be the primary reason for quenching. However, measurements of the global gas content can conclude little about whether the central gas reservoir is depleted. In the absence of large samples of resolved molecular gas maps, estimates of gas surface density from dust attenuation (Brinchmann et al. 2013) may provide some insight. Sánchez et al. (2017b) have recently used this approach to infer depleted gas reservoirs in the centres of passive galaxies.
An alternative inside-out quenching mechanism that can leave the gas reservoir largely intact is the increased stability of the gas disk following the growth of the central stellar bulge. This process has become known as ‘morphological quenching’ (Martig et al. 2009). Indeed, there is now a wealth of observational evidence that links the prominence of the bulge/central mass surface density to the quenched fraction (e.g. Wuyts et al. 2011b; Bluck et al. 2014; Omand et al. 2014; Woo et al. 2015). Morphological quenching is also supported by observations of lower star formation efficiency of bulge dominated/early type galaxies (Saintonge et. al 2012; Martig et al. 2013; Davis et al. 2014). González Delgado et al. (2016) have similarly proposed that morphological quenching could explain the increasingly suppressed inner sSFR profiles as a function of morphological type.
However, the link between bulges and quenching has also been interpreted as possible evidence for AGN driven feedback (e.g. Bluck et al. 2014; Teimoorinia, Bluck & Ellison 2016), a process that might also be expected to operate from the inside out. Indeed, simulations whose quenching prescriptions are based on AGN feedback show very similar trends of passive fraction with morphology as seen in observations (Bluck et al. 2016; Brennan et al. 2017). Even more compelling evidence for an AGN-quenching scenario is the tendency for passive galaxies to host central supermassive black holes that are more massive at fixed galactic stellar mass than star-forming galaxies (Savorgnan et al. 2016; Terrazas et al. 2016).
Overall, our results support a model in which galaxies both boost and quench their star formation from the inside out. Indeed, there is a remarkable symmetry in the profiles of galaxies far above and below the main sequence (Fig. 8). Our results are consistent with the framework of the compaction scenario in which galaxies first experience a centrally concentrated star burst which builds central mass and is then followed by depletion/feedback which similarly acts from the centre outwards (e.g. Tacchella et al. 2016a, b). At moderately high redshifts there exists a population of currently star forming galaxies that are compact, lying on the central – M⋆ relation for quenched galaxies (e.g. Barro et al. 2013, 2014, 2017), possibly indicating that they are the pre-cursors to the quenched population.
6 Summary
We have investigated the spatial dependence of enhanced/suppressed star formation for galaxies that lie above/below the global star forming main sequence using IFU observations obtained from the MaNGA survey (Section 2). Our sample consists of 392 star-forming galaxies (Fig. 1, Section 2.2) whose SFRs extend an order of magnitude above and below the global main sequence (Fig. 2, Section 2.3). We additionally include a sample of 470 passive galaxies, defined as having SFRs more than a factor of ten below the main sequence (Fig. 3, Section 2.4). The relative star formation in a given spaxel () is quantified with reference to the resolved main sequence (Fig. 4, Section 3.2) by matching to comparison spaxels with similar and radial distance from the galaxy centre (Section 3.3). We also compute metallicity offsets ( O/H) for spaxels, relative to the resolved MZR (Fig. 7, Sec. 3.4).
Our principal result is presented in Fig. 8, in which we quantify radial profiles of star formation excess/deficit () as a function of the galaxy’s position on the global main sequence. Galaxies whose total star formation rates place them at least a factor of a few above the global main sequence have, on average, elevated out to at least 1.5 ( 10 kpc). However, is particularly enhanced within 0.5 ( 3 kpc), indicating a preferential boost in the star formation in the central regions. Moreover, galaxies that lie at least a factor of three above the main sequence exhibit metallicities that are diluted relative to the resolved MZR. These galaxies have positive O/H profile gradients that have central values dex, and approximately normal metallicities at 2 (Fig. 11). Passive galaxies mirror the star formation profiles of the galaxies above the main sequence - their profiles are depressed throughout, with the most significant star formation deficit in the central 0.5 . The profile of passive galaxies is morphology dependent; although all passive galaxies have similar profiles beyond 0.6 , galaxies with a significant bulge fraction (B/T0.5, as measured in the mass) have a factor of two lower in their central regions (Fig. 9).
Taken together, our results add to a growing body of empirical evidence that star formation activity in galaxies is dominated by changes in the central regions. This is consistent with the emerging model of ‘galaxy compaction’ (e.g. Dekel & Burkert 2014; Zolotov 2015; Tacchella et al. 2016a,b), in which galaxies undergo (one, or a series of) gas inflow events which lead to a central star burst. Such ‘wet compaction’ events can be triggered by a variety of processes including mergers, bars, disk instabilities or streams (e.g. Scudder et al. 2012; Ellison et al. 2011). Although galaxies above the main sequence exhibit elevated star formation throughout the disk (Nelson et al. 2016; Morselli et al. 2017; Magdis et al. 2016) the enhancement is greatest in the centre. In turn, this leads to inside out mass growth (Nelson et al. 2012, 2016; Wuyts et al. 2012; Pérez et al. 2013) and eventual quenching, either from gas depletion, AGN feedback (e.g. Teimoorinia et al. 2016; Bluck et al. 2016; Terrazas et al. 2016), or an increased stability in the disk (Martig et al. 2009). The quenching process propogates from the central regions outwards (González Delgado et al. 2016; Belfiore et al. 2017a; Sanchez et al. 2017b) following these episodes of compact star formation (Barro et al. 2013, 2014, 2017).
Acknowledgements
SLE acknowledges stimulating discussions with, and valuable comments on the manuscript draft from Franceso Belfiore, Asa Bluck, Alice Concas, Rosa González Delgado, Lihwai Lin, Laura Morselli, Erica Nelson, Dave Patton, Paola Popesso and the anonymous referee. BA gratefully acknowledges financial support from the MITACS Globalink program which funded his participation in this project. SFS and HIM acknowledge the following grants for their support: CONACyt CB-180125, DGAPA-UNAM IA100815 and IA101217.
Funding for the Sloan Digital Sky Survey IV has been provided by the Alfred P. Sloan Foundation, the U.S. Department of Energy Office of Science, and the Participating Institutions. SDSS-IV acknowledges support and resources from the Center for High-Performance Computing at the University of Utah. The SDSS web site is www.sdss.org.
SDSS-IV is managed by the Astrophysical Research Consortium for the Participating Institutions of the SDSS Collaboration including the Brazilian Participation Group, the Carnegie Institution for Science, Carnegie Mellon University, the Chilean Participation Group, the French Participation Group, Harvard-Smithsonian Center for Astrophysics, Instituto de Astrofísica de Canarias, The Johns Hopkins University, Kavli Institute for the Physics and Mathematics of the Universe (IPMU) / University of Tokyo, Lawrence Berkeley National Laboratory, Leibniz Institut für Astrophysik Potsdam (AIP), Max-Planck-Institut für Astronomie (MPIA Heidelberg), Max-Planck-Institut für Astrophysik (MPA Garching), Max-Planck-Institut für Extraterrestrische Physik (MPE), National Astronomical Observatories of China, New Mexico State University, New York University, University of Notre Dame, Observatário Nacional / MCTI, The Ohio State University, Pennsylvania State University, Shanghai Astronomical Observatory, United Kingdom Participation Group, Universidad Nacional Autónoma de México, University of Arizona, University of Colorado Boulder, University of Oxford, University of Portsmouth, University of Utah, University of Virginia, University of Washington, University of Wisconsin, Vanderbilt University, and Yale University.
References
- [Abdurro’uf & Akiyama, Masayuki (2017)] Abdurro’uf & Akiyama, M., 2017, MNRAS, 469, 2806
- [Albareti et al. (2017)] Albareti, F. D., et al., 2017, ApJS, accepted
- [Allen et al. (2015)] Allen, J. T., et al., 2015, MNRAS, 446, 1567
- [Azadi et al. (2017)] Azadi, M., et al., 2017, ApJ, 835, 27
- [Barnes & Hernquist (1991)] Barnes, J. E., & Hernquist, L., 1991, ApJ, 370, L65
- [Barrera-Ballesteros et al. (2015)] Barrera-Ballesteros, J. K., et al., 2015, A&A, 579, 45
- [Barrera-Ballesteros et al. (2016)] Barrera-Ballesteros, J. K., et al., 2016, MNRAS, 463, 2513
- [Barro et al. (2013)] Barro, G., et al., 2013, ApJ, 765, 104
- [Barro et al. (2014)] Barro, G., et al., 2014, ApJ, 791, 52
- [Barro et al. (2017)] Barro, G., et al., 2017, ApJ, 840, 47
- [Belfiore et al. (2017a)] Belfiore, F., et al., 2017a, MNRAS, 466, 2570
- [Belfiore et al. (2017b)] Belfiore, F., et al., 2017b, MNRAS, submitted, arXiv:1710.05034
- [Bluck et al. (2016)] Bluck, A. F. L., et al., 2016, MNRAS, 462, 2559
- [Bluck et al. (2014)] Bluck, A. F. L., Mendel, J. T., Ellison, S. L., Moreno, J., Simard, L., Patton, D. R., Starkenburg, E., 2014, MNRAS, 441, 599
- [Braine & Combes (1993)] Braine, J., & Combes, F., 1993, A&A, 269, 7
- [Brennan et al. (2017)] Brennan, R., et al., 2017, MNRAS, 465, 619
- [Brinchmann et al. (2013)] Brinchmann, J., Charlot, S., Kauffmann, G., Heckman, T., White, S. D. M., Tremonti, C., 2013, MNRAS, 432, 2112
- [Brinchmann et al. 2004] Brinchmann, J., Charlot, S., White, S. D. M., Tremonti, C., Kauffmann, G., Heckman, T., Brinkmann, J.,2004, MNRAS, 351, 1151
- [Bundy et al. (2015)] Bundy, K., et al., 2015, ApJ, 798, 7
- [Cano-Díaz et al. (2016)] Cano-Díaz, M., et al., 2016, ApJ, 821, L26
- [Cano-Diaz et al. (2012)] Cano-Díaz, M., Maiolino, R., Marconi, A., Netzer, H., Shemmer, O., Cresci, G., 2012, A&A, 537, L8
- [Cardelli, Clayton & Mathis (1989)] Cardelli, J. A., Clayton, G. C., & Mathis, J. S., 1989, ApJ, 345, 245
- [Carniani et al. (2016)] Carniani, S., et al., 2016, A&A, 591, 28
- [Chen et al. (2016)] Chen, Y.-M., et al., 2016, NatCo, 713269
- [Cheung et al. (2012)] Cheung, E., et al., 2012, ApJ, 760, 131
- [Cid-Fernandes et al. (2013)] Cid-Fernandes, R., et al., 2013, A&A, 557, 86
- [Combes et al. (1994)] Combes, F., Prugniel, P., Rampazzo, R., Sulentic, J. W., 1994, A&A, 281, 725
- [Concas et al. (2017)] Concas, A., Popesso, P., Brusa, M., Mainieri, V., Erfanianfar, G., Morselli, L., 2017, A&A, 606, 36
- [Cortijo Ferrero et al (2017a)] Cortijo-Ferrero, C., et al., 2017a, MNRAS, 467, 3898
- [Cortijo Ferrero et al (2017b)] Cortijo-Ferrero, C., et al., 2017b, A&A, in press
- [Cowley et al. (2016)] Cowley, M. J., et al., 2016, MNRAS, 457, 629
- [Crenshaw et al. (2010)] Crenshaw, D. M., Schmitt, H. R., Kraemer, S. B., Mushotzky, R. F. Dunn, J. P., 2010, ApJ, 708, 419
- [Croom et al. (2012)] Croom, S. M., et al., MNRAS, 2012, 421, 872
- [Daddi et al. (2007)] Daddi, E., et al., 2007, ApJ, 670, 156
- [Darg et al. (2010a)] Darg, D. W., et al., 2010, MNRAS, 401, 1552
- [Davis et al. (2014)] Davis, T. A., et al., 2014, MNRAS, 444, 3427
- [Davis et al. (2016)] Davis, T. A., Greene, J., Ma, C.-P., Pandya, V., Blakeslee, J. P., McConnell, N., Thomas, J., 2016, MNRAS, 455, 214
- [Dekel & Burkert (2014)] Dekel, A., & Burkert, A., 2014, MNRAS, 438, 1870
- [Duarte Puertas et al. (2017)] Duarte Puertas, S., Vilchez, J. M., Iglesias-Paramo, J., Kehrig, C., Parez-Montero, E., Rosales-Ortega, F. F., 2017, A&A, 599, 71
- [Ellison et al., (2015)] Ellison, S. L., Fertig, D., Rosenberg, J. L., Nair, P., Simard, L., Torrey, P., Patton, D. R., 2015, MNRAS, 448, 221
- [Ellison et al. (2013)] Ellison, S. L., Mendel, J. T., Patton, D. R., Scudder, J. M., 2013, MNRAS, 453, 3627
- [Ellison et al. (2011)] Ellison, S. L., Nair, P., Patton, D. R., Scudder, J. M., Mendel, J. T., Simard, L., 2011, MNRAS, 416, 2182
- [Ellison et al. (2008)] Ellison, S. L., Patton, D. R., Simard, L., McConnachie, A. W., 2008a AJ, 135, 1877
- [Ellison et al. (2008)] Ellison, S. L., Patton, D. R., Simard, L., McConnachie, A. W., 2008b, ApJ, 672, L107
- [Ellison et al. (2016)] Ellison, S. L., Teimoorinia, H., Rosario, D. J., Mendel, J. T., 2016, MNRAS, 458, L34
- [Fang et al. (2013)] Fang, J. J., Faber, S. M., Koo, D. C., Dekel, A., 2013, ApJ, 776, 63
- [Finlator & Dave (2008)] Finlator, K., & Davé, R., 2008, MNRAS, 385, 2181
- [French et al. (2015)] French, K. D., Yang, Y., Zabludoff, A., Narayanan, D., Shirley, Y., Walter, F., Smith, J.-D., Tremonti, C. A., 2015, ApJ, 801, 1
- [Genzel et al. (2015)] Genzel, R., et al., 2015, ApJ, 800, 20
- [Gomez et al. (2003)] Gomez, P., et al., 2003, ApJ, 584, 210
- [González Delgado et al (2014)] González Delgado, R., et al., 2014, A&A, 562, 47
- [González Delgado et al (2015)] González Delgado, R., et al., 2015, A&A, 581, 103
- [González Delgado et al (2016)] González Delgado, R., et al., 2016, A&A, 590, 44
- [Harrison et al. (2014)] Harrison, C. M., Alexander, D. M., Mullaney, J. R., Swinbank, A. M., 2014, MNRAS, 441, 3306
- [Hsieh et al. (2017)] Hsieh, B. C., et al., 2017, ApJ, submitted
- [Ibarra et al. (2016)] Ibarra-Medel, H. J., et al., 2016 MNRAS, 463, 2799
- [Juneau et al. (2013)] Juneau, S., et al., 2013, ApJ, 764, 176
- [Kauffmann et al. (2003)] Kauffmann, G., et al., 2003a, MNRAS, 346, 1055
- [Kauffmann et al. (2003)] Kauffmann, G., et al., 2003b, MNRAS, 341, 33
- [Kennicutt (1998)] Kennicutt, R.C., 1998, ApJ, 498, 541
- [Kewley et al. (2001)] Kewley, L. J., Dopita, M. A., Sutherland, R. S., Heisler, C. A., Trevena, J., 2001, ApJ, 556, 121
- [Kewley & Ellison (2008)] Kewley, L. J., & Ellison, S. L., 2008, ApJ, 681, 1183
- [Kewley et al (2010)] Kewley, L. J., Rupke, D., Jabran Z. H., Geller, M. J., Barton, E. J., 2010, ApJ, 721, L48
- [Knobel et al. (2015)] Knobel, C., Lilly, S. J., Woo, J., Kovac, K., 2015, ApJ, 800,24
- [Lang et al. (2014)] Lang, P., et al., 2014, ApJ, 788, 11
- [Law et al., (2015)] Law, D. R., et al., 2015, 150, 19
- [Lewis et al (2002)] Lewis, I., et al. 2002, MNRAS, 334, 673
- [Lian et al., (2017)] Lian, J., Yan, R., Blanton, M., Kong, X., 2017, MNRAS, in press
- [Lintott et al. (2008)] Lintott, C. J., et al., 2008, MNRAS, 389, 1179
- [Magdis et al. (2016)] Magdis, G. E., et al., 2016, MNRAS, 456, 4533
- [Maragkoudakis et al. (2017)] Maragkoudakis, A., Zezas, A., Ashby, M. L. N., Willner, S. P., 2017, MNRAS, 466, 1192
- [Marino et al. (2013)] Marino, R. A., et al., 2013, A&A, 559A, 114
- [Martel et al., (2013)] Martel, H., Kawata, D., Ellison, S. L., 2013, MNRAS, 431, 2560
- [Martig et al. (2009)] Martig, M., Bournaud, F., Teyssier, R., Dekel, A., 2009, ApJ, 707, 250
- [Martig et al. (2013)] Martig, M., et al., 2013, MNRAS, 432, 1914
- [McElroy et al. 2015] McElroy, R., Croom, S. M., Pracy, M., Sharp, R., Ho, I.T., Medling, A. M., 2015, MNRAS, 446, 2186
- [Mendel et al. (2014)] Mendel, J. T., Palmer, M. J. D., Simard, L., Ellison, S. L., Patton, D. R., 2014, ApJS, 210, 3
- [Mendel et al. (2013)] Mendel, J. T., Simard, L., Ellison, S. L., Patton, D. R., 2013, MNRAS, 429, 2212
- [Mihos & Hernquist (1994)] Mihos, C., & Hernquist, L., 1994, ApJ, 425, L13
- [Mihos & Hernquist (1996)] Mihos, C., & Hernquist, L., 1996, ApJ, 464, 641
- [Moran et al. (2012)] Moran, S. M., et al., 2012, ApJ, 745, 66
- [Moreno et al. (2015)] Moreno, J., Torrey, P., Ellison, S. L., Patton, D. R., Bluck, A. F. L., Bansal, G., Hernquist, L., 2015, MNRAS, 448, 1107
- [Morselli et al. (2017)] Morselli, L., Popesso, P., Erfanianfar, G., Concas, A., 2017, A&A, 597, 97
- [Nelson et al. (2012)] Nelson, E. J., et al., 2012, ApJ, 747, 28
- [Nelson et al. (2016)] Nelson, E. J., et al., 2016, ApJ, 828, 27
- [Noeske et al. (2007)] Noeske, K. G., et al., 2007, ApJ, 660, L43
- [Omand et al. (2014)] Omand, C. M. B., Balogh, M. L., Poggianti, B. M., 2014, MNRAS, 440, 843
- [Orr et al. 2017)] Orr, M., et al., 2017, ApJL, in press
- [Patton et al. (2013)] Patton, D. R., Torrey, P., Ellison, S. L., Mendel, J. T., Scudder, J. M., 2013, MNRAS, 433, L59
- [Peng et al. (2012)] Peng, Y., Lilly, S. J., Renzini, A., Carollo, M., 2012, ApJ, 757, 4
- [Pérez et al. (2013)] Pérez, E., et al., 2013, ApJ, 764, L1
- [Perez et al. (2011)] Perez, J., Michel-Dansac, L., Tissera, P. B., 2011, MNRAS, 417, 580
- [Pérez-Montero et al. (2016)] Pérez-Montero, E., et al., 2016, A&A, 595, 62
- [Pettini & Pagel (2004)] Pettini, M., & Pagel, B. E. J., 2004, MNRAS, 348, L59
- [Renzini & Peng (2015)] Renzini, A., & Peng, Y., 2015, ApJ, 801, L29
- [Rich et al. (2012)] Rich, J. A., Torrey, P., Kewley, L. J., Dopita, M. A., Rupke, D. S. N., 2012, ApJ, 753, 5
- [Richards et al. (2016)] Richards, S. N., et al., 2016, MNRAS, 455, 2826
- [Rosales-Ortega et al. (2012)] Rosales-Ortega, F. F., et al., 2012, ApJ, 756, L31
- [Rosario et al., (2016)] Rosario, D. J., Mendel, J. T., Ellison, S. L., Lutz, D., Trump, J. R., 2016, MNRAS, 457, 2703
- [Rowlands et al. (2015)] Rowlands, K., Wild, V., Nesvadba, N., Sibthorpe, B., Mortier, A., Lehnert, M., da Cunha, E., 2015, MNRAS, 448, 258
- [Rupke, Kewley & Barnes (2010)] Rupke, D. S. N., Kewley, L. J., Barnes, J. E., 2010, ApJ, 710, L156
- [Saintonge et al. (2012)] Saintonge, A., et al., 2012, ApJ, 758, 73
- [Saintonge (2016)] Saintonge, A., et al., 2016, MNRAS, 462, 1749
- [Salim et al. (2007)] Salim, S., et al, 2007, ApJS, 173, 267
- [Sánchez et al. (2012)] Sánchez, S. F., et al., 2012, A&A, 538, 8
- [Sánchez et al. (2013)] Sánchez, S. F., et al., 2013, A&A, 554, 58
- [Sánchez et al. (2014)] Sánchez, S. F., et al., 2014, A&A, 563, 49
- [Sánchez et al. (2016a)] Sánchez, S. F., et al., 2016a, RMxAA, 52, 21
- [Sánchez et al. (2016b)] Sánchez, S. F., et al., 2016b, RMxAA, 52, 171
- [Sánchez et al. (2017a)] Sánchez, S. F., et al., 2017a, MNRAS, 469, 2121
- [Sánchez et al. (2017b)] Sánchez, S. F., et al., 2017b, RMxAA, submitted, arXiv:1709.05438
- [Sánchez-Menguiano et al. (2016)] Sánchez-Menguiano, L., et al., 2016, A&A, 587, 70
- [Sargent et al. (2014)] Sargent, M. T., Daddi, E., Bethermin, M., Aussel, H., Magdis, G., Hwang, H. S., Juneau, S., Elbaz, D., da Cunha, E., 2014, ApJ, 793, 19
- [Savorgnan et al. (2016)] Savorgnan, G. A. D., Graham, A. W., Marconi, A., Sani, E., 2016, ApJ, 817, 21
- [Schreiber et al. (2015)] Schreiber, C., et al., 2015, A&A, 575, 74
- [Scott & Kaviraj (2014)] Scott, C., & Kaviraj, S., 2014, MNRAS, 437, 2137
- [Scudder et al. (2012b)] Scudder, J. M., Ellison, S. L., Torrey, P., Patton, D. R., Mendel, J. T., 2012, MNRAS, 426, 549
- [Serra et al. (2012)] Serra, P., et al., 2012, MNRAS, 422, 1835
- [Shimizu et al. (2015)] Shimizu, T. T., Mushotzky, R. F., Melendez, M., Koss, M., Rosario, D. J., 2015, MNRAS, 452, 1841
- [Sillero et al. (2017)] Sillero, E., Tissera, P. B., Lambas, D. G., Michel-Dansac, L., MNRAS, in press
- [Simard et al. (2011)] Simard, L., Mendel, J. T., Patton, D. R., Ellison S. L., McConnachie, A. W., 2011, ApJS, 196, 11
- [Speagle et al., (2014)] Speagle, J. S., Steinhardt, C. L., Capak, P. L., Silverman, J. D., 2014,ApJS, 214, 15
- [Spindler et al. (2017)] Spindler, A., et al., 2017, MNRAS, submitted, arXiv:1710.05049
- [Stierwalt et al., 2015] Stierwalt, S., Besla, G., Patton, D., Johnson, K., Kallivayalil, N., Putman, M., Privon, G., Ross, G., 2015, ApJ, 805, 2
- [Stott et al. (2014)] Stott, J. P., et al., 2014, MNRAS, 443, 2695
- [Suess et al. (2017)] Suess, K. A., Bezanson, R., Spilker, J. S., Kriek, M., Greene, J. E., Feldmann, R., Hunt, Q., Narayanan, D., 2017, ApJ, in press
- [Tacchella et al. (2015a)] Tacchella, S., et al., 2015a, Sci, 348, 314
- [Tacchella et al. (2015b)] Tacchella, S., et al., 2015b, ApJ, 802, 101
- [Tacchella et al. (2017)] Tacchella, S., et al., 2017, ApJ, submitted, arXiv:1704.00733
- [Tacchella et al. (2016a)] Tacchella, S., Dekel, A., Carollo, C. M., Ceverino, D., DeGraf, C., Lapiner, S., Mandelker, N., Primack, J. R., 2016a, MNRAS, 457, 2790
- [Tacchella et al. (2016b)] Tacchella, S., Dekel, A., Carollo, C. M., Ceverino, D., DeGraf, C., Lapiner, S., Mandelker, N., Primack, J. R., 2016b, MNRAS, 458, 242
- [Tacconi et al. (2013)] Tacconi, L. J., et al., 2013, ApJ, 768, 74
- [Tacconi et al. (2017)] Tacconi, L. J., et al., 2017, ApJ, submitted, arXiv:1702.01140
- [Teimoorinia, Bluck & Ellison (2016)] Teimoorinia, H., Bluck, A. F. L., & Ellison, S. L., 2016, MNRAS, 457, 2086
- [Terrazas et al. (2016)] Terrazas, B. A., Bell, E. F., Henriques, B. M. B., White, S. D. M., Cattaneo, A., Woo, J., 2016, ApJ, 830, L12
- [Torrey et al. (2012)] Torrey, P., Cox, T. J., Kewley, L. J., Hernquist, L., 2012, ApJ, 746, 108
- [Tremonti et al. 2004] Tremonti, C., et al., 2004, ApJ, 693, 898
- [Ueda et al. (2014)] Ueda, J., et al. 2014, ApJS, 214, 1
- [Violino et al. (2017)] Violino, G., Ellison, S. L., Sargent, M., Coppin, K. E. K., Scudder, J. M., Mendel, J. T., Saintonge, A., 2017, MNRAS, submitted
- [Wang et al. (2012)] Wang, J., et al., 2012, MNRAS, 423, 3486
- [Willett et al. (2015)] Willett, K. W., et al., 2015, MNRAS, 449, 820
- [Wisnioski et al. (2011)] Wisnioski, E., et al., 2011, MNRAS, 417, 2601
- [Whitaker et al. (2012)] Whitaker, K. E., van Dokkum, P. G., Brammer, G., Franx, M., 2012, ApJ, 754, L29
- [Whitaker et al. (2017)] Whitaker, K. E., et al., 2017, ApJ, 838, 19
- [Woo et al. (2013)] Woo, J., et al., 2013, MNRAS, 428, 3306
- [Woo et al. (2015)] Woo, J., Dekel, A., Faber, S. M., Koo, D. C., 2015, MNRAS, 448, 237
- [Woo et al. (2016)] Woo, J.-H., Bae, H.-J., Son, D., Karouzos, M., 2016, ApJ, 817, 108
- [Woo et al. (2017)] Woo, J.-H., Son, D., Bae, H.-J., 2017, ApJ, 839, 120
- [Wuyts et al. (2011)] Wuyts, S., et al., 2011a, ApJ, 738, 106
- [Wuyts et al. (2011)] Wuyts, S., et al., 2011b, ApJ, 742, 96
- [Wuyts et al. (2012)] Wuyts, S., et al., 2012, ApJ, 753, 114
- [Wuyts et al. (2013)] Wuyts, S., et al., 2013, ApJ, 779, 135
- [Yamashita et al. (2017)] Yamashita, T., et al., 2017, ApJ, 844, 96
- [Young et al. (2011)] Young, L. M., et al., 2011, MNRAS, 414, 940
- [Young et al. (2014)] Young, L. M., et al., 2014, MNRAS, 444, 3408
- [Zolotov et al. (2015)] Zolotov, A., et al., 2015, MNRAS, 450, 2327
Appendix A Comparison of MaNGA and DR7 masses and star formation rates
In Fig. 12 we compare the integrated (full IFU) MaNGA star formation rates and stellar masses of all galaxies in the parent DR13 sample with the values in the MPA/JHU DR7 catalogs. Values are corrected for the different cosmologies and initial mass functions used in the two catalogs. Both the SFRs and stellar masses trace each other well; as noted in Sec. 2.2 the mean difference between the MPA/JHU and integrated MaNGA values is 0.0007 dex for stellar mass and 0.03 dex for SFR, with scatter of 0.3 and 0.4 dex respectively. Importantly, we note that any difference between the MaNGA and DR7 values will not affect our analysis, due to the comparative nature of the methodology that we have adopted, such that comparisons are always made consistently within a given sample.