On the UV/optical variation in NGC 5548: new evidence against the reprocessing diagram
Abstract
The reprocessing scenario is widely adopted in literature to explain the observed tight inter-band correlation and short lags in the UV/optical variations of active galactic nuclei (AGNs). In this work we look into the color variability of the famous Seyfert galaxy NGC 5548 with high quality Swift multi-band UV/optical light curves. We find the color variation of NGC 5548 is clearly timescale-dependent, in a way that it is more prominent at shorter timescales. This is similar to that previously detected in quasar samples, but for the first time in an individual AGN. We show that while a reprocessing model with strict assumptions on the driving source and the disk size can apparently match the observed light curves and inter-band lags, it fails to reproduce the observed timescale dependency in the color variation. Such discrepancy raises a severe challenge to, and can hardly be reconciled under the widely accepted reprocessing diagram. It also demonstrates that the timescale dependency of the color variation is uniquely powerful in probing the physics behind AGN UV/optical variations.
1 Introduction
It has long been known that the ultraviolet (UV) and optical continuum radiation in active galactic nuclei (AGNs) are variable (e.g., Ulrich et al., 1997). Such variation, as a characteristic feature of AGNs, is useful in many aspects of AGN studies. It can be used to separate AGNs from stars/galaxies (e.g., Sesar et al., 2007; Boutsia et al., 2009; Schmidt et al., 2010; MacLeod et al., 2011; Butler & Bloom, 2011; Ruan et al., 2012; Graham et al., 2014; Peters et al., 2015). It is also essential to the reverberation mapping of AGNs (e.g., Peterson, 1993, 2014). Thanks to the advancement of observational techniques and equipment, the variation studies of AGNs have increasingly attracted more and more attention, particularly in the current age of time domain astronomy. However, the origin of and the physics behind the variation itself remains poorly understood.
A remarkable feature of AGN’s UV/optical variability is that the light curves of different bands are well coordinated, with wavelength-dependent time delays (long wavelength light curves lag those short wavelength ones; Krolik et al., 1991; Stirpe et al., 1994; Ulrich et al., 1997; Collier et al., 1998; Nandra et al., 1998; Peterson et al., 1998; Kriss et al., 2000; Collier et al., 2001). A reprocessing scenario, in which the accretion disk is illuminated by a central variable source and thus produces variable reprocessed UV/optical emission (Guilbert & Rees, 1988), is commonly invoked in literature to explain such coordinated variability and short time delays. In this scenario, the variability origin should be traced back to the central radiation source, which is suspected to be the presumed ‘corona’ (e.g., Haardt & Maraschi, 1991; Chakrabarti & Titarchuk, 1995), and the delay corresponds to the light travel time. Refer to Section 3 and Section 5 for a detailed description and discussion on the reprocessing diagram.
Another prominent feature of the variability is that the variation amplitude is wavelength dependent in the sense that shorter bands vary more significantly (Ulrich et al., 1997). AGNs thus generally appear bluer when they brighten up. Such “bluer-when-brighter” (BWB) trend has been confirmed in numerous papers (e.g., Schmidt et al., 2012; Ruan et al., 2014; Guo & Gu, 2016). Recently, it is found that such BWB trend is timescale-dependent for quasars (luminous AGNs), in the way that shorter term variation is even bluer, as revealed by SDSS observations in optical bands (Sun et al., 2014) and GALEX data in ultraviolet bands (Zhu et al., 2016). As demonstrated with Monte-Carlo simulations, such timescale dependence of the BWB trend potentially links the UV/optical variation in quasars to thermal fluctuations of the accretions disk (Cai et al., 2016). However, note that such inhomogeneous disk model with completely independent thermal fluctuations is unable to explain the inter-band lags generally observed in Seyfert galaxies.
It is known that in less luminous AGNs, such as Seyfert galaxies, X-ray contributes to a larger fraction of bolometric luminosity (Lusso et al., 2010; Strateva et al., 2005; Grupe et al., 2010) and reprocessing is expected to play a more dominant role. Do Seyfert galaxies show timescale-dependent color variation similar to their luminous analogs, i.e., quasars? If yes, is such timescale-dependent color variability compatible with the widely adopted reprocessing diagram?
Recent multi-band monitoring campaigns of the well known Seyfert galaxy NGC 5548 have provided high quality light curves from far UV to optical (Mehdipour et al., 2015; Fausnaugh et al., 2016). Historically, this source has been studied over and over on its optical/UV variation and the lags within the reprocessing diagram (Krolik et al., 1991; Chiang et al., 2000; Uttley et al., 2003; Suganuma et al., 2006; Gaskell et al., 2007; McHardy et al., 2014; Fausnaugh et al., 2016; Starkey et al., 2016). In this work, to address the aforementioned questions, we present a case study using Swift multi-band light curves of NGC 5548. We give a brief description of the photometric light curves gathered by Swift in Section 2. In Section 3, we construct a reprocessing model to simulate multi-band light curves. The artificial multi-band light curves appear well matched to the observed ones, apparently supporting the reprocessing diagram. As shown in Section 4, NGC 5548 exhibits clear timescale dependence in its UV/optical color variation, similar to quasars. However, using simulated light curves we find that the reprocessing diagram is unable to explain the observed timescale dependence, thus is severely challenged. Discussions and conclusions are given in Section 5. Cosmological parameters , , and (Komatsu et al., 2011) are used where necessary throughout this work.
2 Swift light curves
We glean Swift light curves on NGC 5548 presented in Edelson et al. (2015) 111Fausnaugh et al. (2016) also made use of this set of data, and provided multi-band overlapping UV/optical light curves obtained with HST and ground based telescopes. Those light curves however span significantly shorter time intervals, containing no information of color variation at long timescales. In this work we utilize the Swift light curves only. and carry out color variability analysis based on them. The Swift monitored on NGC 5548 in six ultraviolet and optical bands (UVW2 centered at 1928 Å, UVM2 at 2246 Å, UVW1 at 2600 Å, U at 3465 Å, B at 4392 Å, and V at 5468 Å222http://www.swift.ac.uk/analysis/uvot/filters.php). Though the UVW2 light curve is available from Feb. 2012 to Aug. 2014 with cadences as short as 1 to 3 days and only small gaps ( 2 months), for the other 5 bands the light curves span a shorter period between Mar. 2013 to Aug. 2014. Such well sampled multi-band light curves provide an excellent chance to examine whether the color variation is timescale dependent in an individual Seyfert galaxy.
We notice that light curves of the same source have also been analyzed in Mehdipour et al. (2016) with a few more observations included (obtained between the end of Dec. 2014 and early Feb. 2015), but the light curves have been binned with bin size of 2 days, missing precise timing information and heavily affecting the determination of time lags. The source has also been observed a few times by Swift during 2005 and 2007, and it is found that the obscuration property was significantly different back then with X-ray spectral analysis (Mehdipour et al., 2016) and we leave them out in research of color variability to avoid complication. Another reason that we do not include the few observations obtained in 2005, 2007 and 2015 is that there are large gaps between these data sets and the rest major data sets. Including them can mainly contribute to the measurement of color variation on very long timescales but not on shorter timescales, thus may produce bias while comparing the color variation at various timescales. Meanwhile the observations we include are well sampled with small gap, so each observation can contribute to the analyses on all timescales.
3 The reprocessing model
To study whether the reprocessing diagram could produce a timescale-dependent color variation pattern, we first construct a simple irradiated accretion disk model. A standard thin accretion disk is divided into rings with the ratio of the outer to inner radius of each ring fixed. The most inner radius is selected as the inner-most stable circular orbit for a Schwarzschild black hole, that is, , where is the gravitational radius and stands for the mass of the central black hole. Each ring is further azimuthally and equally divided into zones with the same radius but different azimuth. Under the reprocessing scenario, the radiation at radius is determined by both the local viscous heating of the accretion disk, and the radiation received by the disk from the central illuminating source. Based on the Stefan-Boltzmann Law, , the temperature profile of the disk could be expressed as (Cackett et al., 2007)
| (1) |
where is the radius, the azimuth angle, the black hole mass, the accretion rate, the disk albedo, the vertical distance from the central variable source to the disk, the distance from the central variable source to disk elements which equals , and the luminosity of the central variable source, delayed by the light travel time for different regions, , and inclination angle, , between the line of sight and the disk axis. The lag is determined by the position of the disk element and the disk inclination angle with the form
| (2) |
We list necessary parameters for this reprocessing scenario in Table 1. Primary parameters, such as the black hole mass and the bolometric luminosity, are gleaned from past literature on NGC 5548.
Having calculated all the temperature of the disk regions, the disk spectral energy distribution (SED) is simply the sum of the blackbody radiation of the disk regions. With appropriate input radiating light curve, we are able to acquire the variable multiple wavelength light curves driven by the input one, by convolving the SED with transmission files333https://heasarc.gsfc.nasa.gov/docs/heasarc/caldb/data/swift/uvota/index.html of Swift filters.
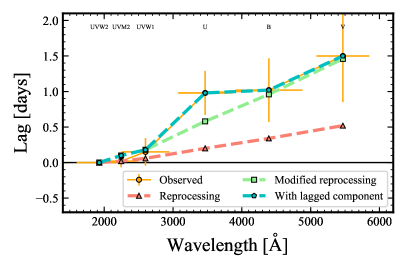
For NGC 5548, the illuminating source seems to be soft X-ray excess or FUV emission from the inner disk, rather than the X-ray corona (Gardner & Done, 2017; Starkey et al., 2017; Edelson et al., 2017, and see Section 5 for details). In this work, we do not associate the illuminating source with any wavelength at all since we do not have any valid information on it. In the disk reprocessing model, only the variability pattern and luminosity of the light curve are needed. We select the ultraviolet light curve collected at the shortest band, UVW2, which is also the most frequently sampled one, to model the variability pattern. It is interpolated using the software package JAVELIN (Zu et al., 2011, 2013) to get better sampling. As the geometry of the disk is already given, we can compute the resultant UVW2 light curve based on the reprocessing model, as well as its time lag relative to the illuminating light curve. The interpolated UVW2 light curve is then shifted backward in time by this lag444For a standard thin accretion disk with parameters listed in Table 1, the lag is 0.21 days. However, since the observed lags are a factor of 3 times larger than the value predicted by the standard thin disk model, we need to modify the disk model (see Figure 1). The shift is computed to be 0.61 days in this modified model. to account for the expected lag between the illuminating source and the observed UVW2 band. Starting from this illuminating light curve, the reprocessed light curve in each band and the predicted inter-band lags can then be derived.
In Figure 1 we plot the observed lags (peak values in ICCF) between other bands and UVW2. The expected values of the disk reprocessing models are over-plotted. To calculate the inter-band lags, we adopt the traditional lag measurement method brought in Peterson et al. (2004), interpolated cross-correlation function (ICCF), and implemented by (Sun et al., 2018)555http://ascl.net/code/v/1868. The light curves have been detrended with a second-order polynomial linear least-squares fit separately before estimating the lags.
The inter-band lags in NGC 5548 were known systematically larger than predicted by the standard thin disk theory (McHardy et al., 2014; Edelson et al., 2015; Fausnaugh et al., 2016). At large radii, within the standard reprocessing accretion disk model, lag measured for a given wavelength follows a theoretical scaling relation of (Fausnaugh et al., 2016)
| (3) |
Assuming that , where is the local ratio of external to internal heating (Fausnaugh et al., 2016), it can be simplified to
| (4) |
namely,
| (5) |
As suggested in Fausnaugh et al. (2016), the observed lags are a factor of 3 times larger than the prediction from standard thin disk theory with proper parameters list in Table 1. Here we simply adjust the of the model to produce lags matching the observed ones, and leave further discussion to Section 5. Lags three times the prediction of standard thin-disk theory, and the above equation, would translate into a factor of 27 times larger. Judging from Figure 1, within the modified model ( enlarged), the lags can better match the observed ones, but deviation for U band is still quite obvious. This could be explained by the contamination from other variable spectral components, including the blended Fe ii emission and Balmer continuum (e.g. Fausnaugh et al., 2016)666Although host galaxy and narrow emission lines also contribute to the total emission, but it would not affect the lag calculation as its flux remains stable for the timescales concerned in this work.. Also, the broad emission line H would contribute to the fluxes of B and V band somewhat. We take these effects into consideration by including an extra variable and lagged component in each of the three bands. 777Line contamination from Mg ii, Fe ii and C iii] to the three ultraviolet bands are neglected. Even taken into consideration, in all cases with different lags assumed (4 to 20 days, with contribution inferred to be less than 2 percent), they do not show any noticeable effect on color variation. With the illuminating light curve serving as ionization source, light curve of the emission line would mimic the variation behavior of the illuminating light curve. The illuminating light curve is first rescaled to have the same mean flux level and standard deviation of the corresponding reprocessed continuum light curve. Then the light curves are shifted and smoothed by 8 days, which is the approximate time delay between the H emission line and the ionization continuum (assumed to be in Fausnaugh et al., 2016). This extra lagged and variable component is added proportionally to the corresponding reprocessed continuum light curves to construct the final simulated light curves for the three bands. To determine the contribution proportion of the extra lagged and variable component, we adjust the proportion until the lags calculated from the final light curves can match observations. The extra lagged and variable component is found to make up 12.5, 1.5 and 1.5 per cent for the U, B and V band, respectively. As we can see from Figure 1, the lag matching is done pretty well now. We note these fractions can not be directly compared with the line flux contributions presented in Fausnaugh et al. (2016) which were obtained through spectral decomposition. This is because: (1) narrow lines are non-variable; (2) we simply assume the lagged variable component has the same variation amplitude (before smoothing) as that of the disk continuum; A larger fraction is needed if the lagged component has smaller variation amplitude. Nevertheless, with this approach, the contamination from broad emission lines and Balmer continuum to the broad band light curves are effectively simulated. We shall explain in the next section that, as we carry out the analysis based on flux differences, these non-variable components, such as narrow emission lines and host galaxy emission, do not affect the results in this work.
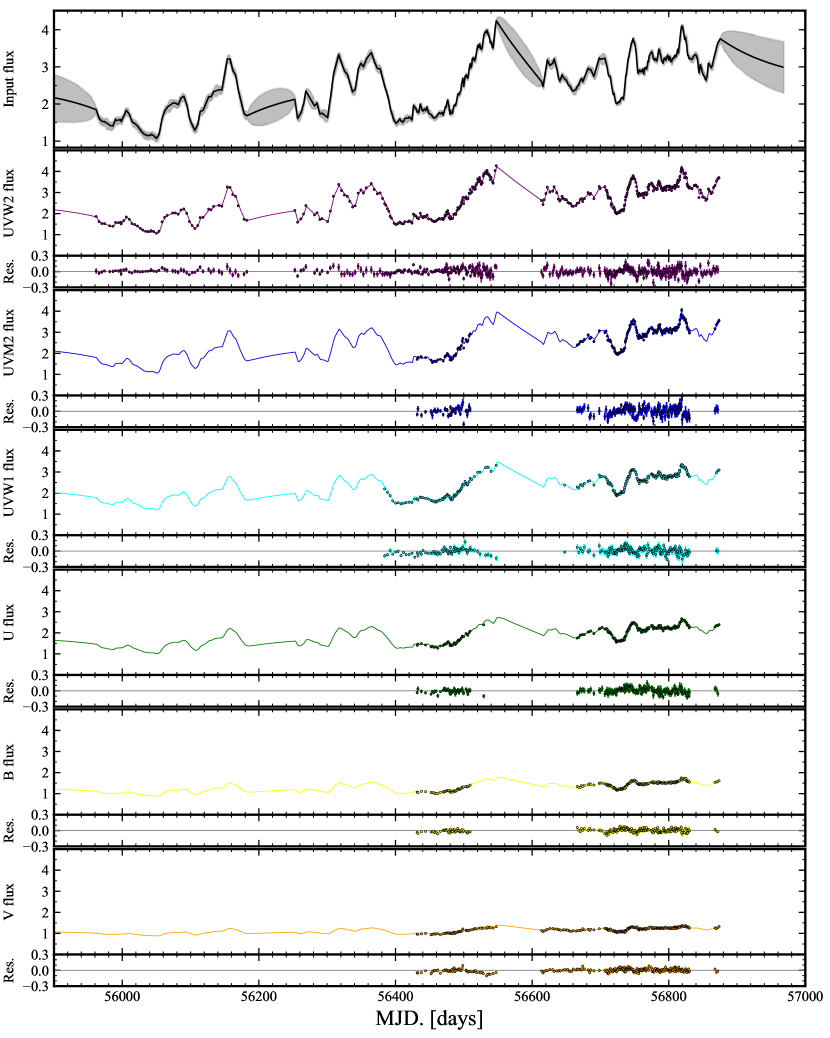
The resultant simulated light curves of the six bands are still not ready to be compared with the observed ones yet. Using the observed light curves as reference, the simulated light curves are shifted and rescaled. The shifting is to account for those non-variable component, such as radiation form the host galaxy and slow-varying narrow emission lines. It will not pose any effect on the flux differences we used in the next section. Rescaling is also necessary. As we do not know the exact wavelength range responsible for the irradiation, we cannot constrain the variability amplitude of the illuminating light curve. As a direct result, variability of the emergent disk radiation of the six bands is also unconstrained. Also, the extinction effect of dust on the observed fluxes are accounted for with the practice of rescaling. Since it is merely a linear transformation on the simulated light curves, rescaling is not timescale dependent, and won’t affect our timescale dependency analysis in the next section. We plot the observed light curves together with the final simulated light curves to make a direct comparison in Figure 2. Two sets of light curves match very well apparently. That is to say, as already demonstrated in previous study (Gardner & Done, 2017), the reprocessing model with fine-tuned parameters seems to be able to well reproduce the observed UV/optical variations in NGC 5548.
4 Timescale-dependent color variability
Generally, color variability can be characterized using the ratio of the flux/magnitude change of two bands (Schmidt et al., 2012). In this work, we follow a similar method. The ratio for any two epochs on light curves of two bands is calculated as:
| (6) |
where and represent the flux measurements in a redder and a bluer band at epoch , respectively. Only ratios with are kept. In addition, pair epochs in which the variation is statistically insignificant () are excluded to avoid possible unrealistic variations contributed by measurement uncertainties (please refer to Sun et al. (2014) for details; the effect of measurement uncertainties can also been seen in Section 4.3). For those falling into a certain timescale bin, the median value of these are taken to mark the color variation amplitude of this timescale. In this way, we can check for the timescale dependency of the color variability.
Ratio calculation done in flux space has the merit of avoiding host galaxy contamination (host galaxy flux would cancel out), which is significant for nearby AGNs, NGC 5548 for example. On the other hand, extinction of intervening dust would instead affect the flux differences. But, as the dust component would remain constant on timescales involved here (less than a year), flux difference would be affected in the same manner for different timescales, and the trend of the curve, which is really what we care about in the following comparison, would remain unaffected.
4.1 Color variability under the reprocessing paradigm
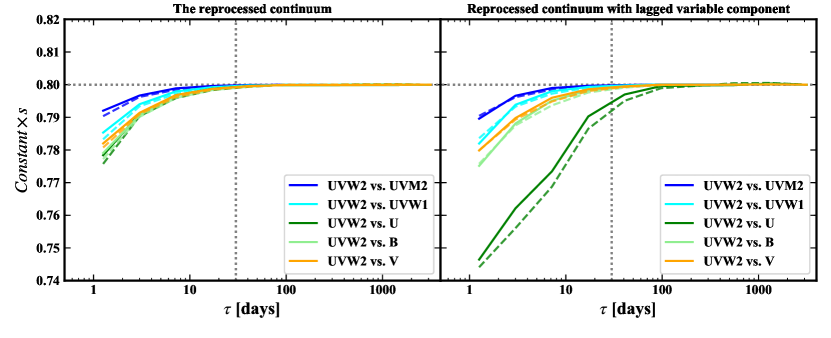
Before set to handle the observed light curves, we first check for the color variability under the simple reprocessing paradigm. To demonstrate if the reprocessing model can produce timescale-dependent color variation in principle, here we generate artificial illuminating radiation light curve lasting 5000 days based on the damped random walk (DRW) model (Kelly et al., 2009), with DRW parameters determined from modeling the UVW2 (see Section 3 and Section 5 for why we choose UVW2 to model the illuminating light curve) light curves with JAVELIN (Zu et al., 2011, 2013). For the DRW model we adopted, the deconvolution timescale, , is 94.8 days, and the variability amplitude, , is with a mean flux of . Note that using different DRW parameters does not alter the results in this work. With the illuminating light curves, we run the reprocessing model, generate artificial light curves in the six Swift bands, and analyze the color variation behavior at different timescales using these light curves. For a simple illustration, we only carry out the color variability calculation between the bluest band UVW2 and the rest five redder bands (UVM2, UVW1, , , ). Our results are presented as solid curves in the left panel of Figure 3.
At very short timescales (less than 10 days), the simulated light curves show some timescale dependence in the color variation (the rising trend of the curve). And the rising trend is more prominent for two bands with larger wavelength difference. Clearly this short term rising trend is related to the inter-band time lags and smoother variation at longer wavelengths. Such effects however are negligible on significantly larger timescales. On timescales larger than about 10 days, the curves appears quite flat, indicating no timescale dependency at all, which contradict the timescale-dependent color variability revealed with both SDSS and GALEX quasar samples (Sun et al., 2014; Zhu et al., 2016).
It should be noted that the choice of the model generating the input illuminating light curve will not have any effect on this conclusion. The timescale independency is barely related to the PSD shape of the illuminating light curve. To better demonstrate this point, we test another illuminating light curve, generated based on the method brought up in Timmer & Koenig (1995), and from the power spectral density (PSD) suggested by Guo et al. (2017). This PSD generally resembles the PSD of DRW model, but has low frequency (less than about ) slope , deviating from the flat slope of the DRW model at the same frequency range. The color variability results are presented as dashed, lighter-colored lines in Figure 3. Their main features are the same as those solid lines, despite the different PSDs of the illuminating light curves.
Also, to demonstrate the effect of emission lines on the timescale independency of color variability, fluxes of them are added as detailed in Section 3 for the three optical bands, , , . These results are plotted in the right panel of Figure 3. Still, on timescales longer than 30 days, the flat color variability curves remain mostly unchanged, except for the band, whose curve shows a mild rising trend on timescales from 30 days to 100 days. This indicates that emission lines do affect the timescale dependency of color variability, when the emission lines are strong enough. For the other two bands suffering the same issue, the timescale independency of color variability, possessed intrinsically by the reprocessing model, remains untouched.
4.2 Color variability of NGC 5548
Bearing the above results in mind, we proceed to check for the observed color variability for NGC 5548 and compare with the reprocessing model.
We carry out the color variability calculation for the two sets of light curves obtained in Figure 2: the observed one and the scaled simulated one. The simulated light curves have been scaled to account for the baseline flux of the host galaxy.
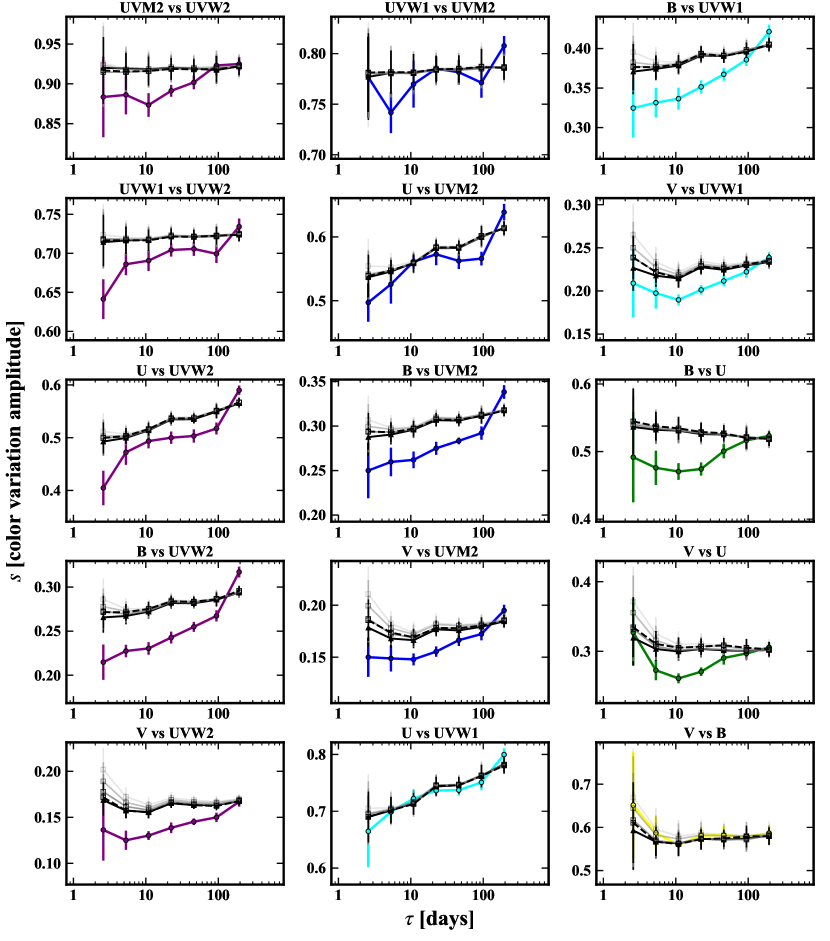
During the calculation, as the observed light curves are not observed strictly simultaneously, the light curves need to be binned with bin size of 0.5 days and, the photometric measurements of two bands are deemed to be observed simultaneously if their observed time difference is less than 0.3 day. To estimate the uncertainties of the observed , we adopt a bootstrap method resembling the one used by Peterson et al. (2004) during the ICCF practice for lags measurement. In each bootstrap realization, random selections are drawn, with replacement (so that the repeatedly selected measurement would have some real effect on the outcome of the realization), from the original photometric measurements in the light curve pairs. New can be calculated from this new pair of light curves. By repeating such realization for 1000 times, we are able to build up a distribution for the observed , and we take the standard deviation to be the measurement uncertainties of . In each sets, as there are six light curves and any two of them can be used to generate a curve. We result in a figure with 15 frames as shown in Figure 4.
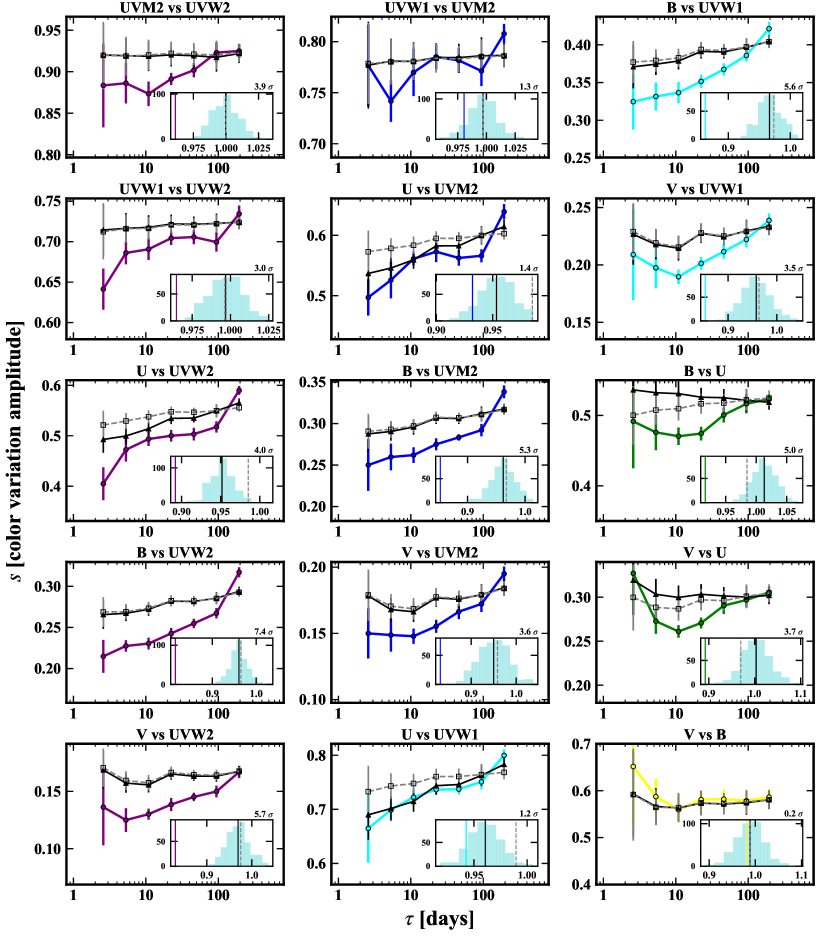
In each frame, the colored curve represents the s calculated using real Swift light curves. The curves are clearly timescale-dependent with the majority of the frames showing a rising trend, similar to those detected in the two aforementioned quasar samples. Note this is the first time that a timescale-dependent color variation is reported in an individual AGN. The fact that the color variability of AGNs show clear timescale dependence can be used to refute certain quasar variability mechanism, as demonstrated in Sun et al. (2014). It also lends support to the inhomogeneous accretion disk model brought up in Dexter & Agol (2011) and revised in Cai et al. (2016).
In the last few frames of Figure 4, the observed curve displays an opposite trend ( slightly decreases with timescale), on the shortest timescales. This signal is mainly connected to the under-estimated photometric uncertainties. On short timescales, variability amplitude is much weaker, especially for these long wavelength bands. Variability signal can be overwhelmed by their measurement uncertainties, leaving the color variability signal noise-dominated. We shall further expand on this point in Section 4.3.
In addition, for those light curve pairs of neighboring filters, such as UVW1 vs. UVM2, and vs. , the rising trend is not so conspicuous. This is likely because the wavelength difference of the two bands is too small to exhibit their different variability behavior. For the rest band pairs that we are concerned, the rising trend is systematically prominent. We shall then compare them with the curve obtained for the simulated light curves.
Although we have already made the conclusion in Section 4.1 that the reprocessing scenario in principle cannot reproduce the observed timescale dependency, observational effects have not been taken into consideration. In view of the possible effect introduced by uneven sampling and photometric uncertainties, we resample the simulated light curves presented in Figure 2 based on the observed ones and add random flux fluctuations based on observed photometric uncertainties. Photometric uncertainties are taken into consideration using the following equations:
| (7) |
where and stand for simulation and observation, respectively, and represents the observed flux uncertainties. We carry out color variability analysis on these resampled light curves. Such resampling procedure are repeated for 400 times so that we can acquire the distribution of the simulated for all the timescale bin concerned. So the observationally affected simulated and their associated uncertainties are chosen to be the mean and variance of the distribution respectively. The color variability calculation for the simulated light curves also incorporates the 3- criterion. Also, the simulated light curves have been scaled to the observed ones to account for the host galaxy contamination. By doing so, we may then make a more direct comparison of the observed relations with those predicted by the reprocessing model. The resulting curves based on the emission line included simulated light curves are presented in each frame of Figure 4 as the solid black lines. We also plot the results based on the emission line free simulated light curves as the dashed gray lines for reference.
To quantitatively compare the steepness/flatness of the curves, we first average the on both relatively shorter (between 4 and 34 days) and longer (above 34 days) timescales. The averaging are done on binned points in Figure 4 rather than ’s distribution to avoid giving too much preference to those bins with more data pairs. Then we compute the ratios of the averaged on shorter timescales to those on relatively longer timescales. So, a ratio value less than unity would indicate a timescale dependency for the color variability, in which the color variability is less conspicuous on longer timescales in comparison with that on shorter timescales. The smaller the ratio is, the more evident the timescale dependency will be. For the simulated curve, we are able to build up the distributions for the ratios, based on the 400 times resampling of the dense simulated light curves. The difference between the observed ratios and the mean values of the simulated ratios can be measured in unit of the variance of the distribution. In this way, we are able to tell if the difference is significant enough between observed and simulated curves, and the distributions of the ratios are also plotted in Figure 4, with the differences in ratios marked on the upper right corner in the sub-plots. By the way, we also carry out the color variability for the emission line free light curves and the results are plotted as the gray dashed lines in each frame.
As shown with the black solid curves in Figure 4, on timescales above 4 days or so, the relations produced under the reprocessing scenario, with observational effects taken into consideration, appear systematically flatter than the observed ones in almost all the 15 frames. This phenomenological conclusion is further buttressed by the ratio differences we calculated above. For the majority of the light curve pairs, the differences are obvious, except for those band pairs involving band. This indicates that the contamination of the lagged emission lines on band can severely impede the interpretation of color variability on short timescales, as we point out in Figure 3.
4.3 The effect of covariance error on color variability
In this section, we further explore the effect of several measurement related effect on the calculation of color variability.
We first look at the possible underestimation of Swift observational uncertainties. We make use of photometric uncertainties in our simulation to take observational effect into consideration. If underestimated, uncertainties would directly affect the color variability of simulated light curves. This effect is assessed by tweaking Equation 7 just a little bit:
| (8) |
where k is chosen to be 1.1, 1.2 and 1.3 in our three trials. The color variability results for these light curves are plotted in Figure 5 as the gray curves, with lighter gray curves representing results calculated using larger k values. It can be seen that, compared with the black curves, all the gray curves show a mild declining trend on short timescales (contrary to observations), with larger k value yielding more prominent upward tilt toward shorter timescales. Therefore underestimated photometric uncertainties (if exist) would even strengthen our conclusions that the reprocessing diagram is unable to reproduce the observed curves.
The possible measurement covariance between any two Swift band photometric observations is another issue. It tends to introduce in-phase deviations to the photometric measurements of two bands at the same time, hence affecting the result of color variability. As it is rather intricate to access the level of the systematic covariance, here we check for their impact on curves by adding them to the simulated light curves:
| (9) |
where is used to indicate the prominence of covariance uncertainties. We adopt 0.3 here as a tryout. The calculation is done the same way for these light curves, and the results are shown as the dashed black curves in Figure 5.
By comparing the dashed black curves and the solid black ones, it can be seen that when considering covariance uncertainties, the curves would also show a mild declining trend on short timescale. Different values for , ranging from 0.1 to 0.5, are also tested, and the short timescale declining trend is found to be more conspicuous with larger . These results indicate that, should there be any covariance signal lurking in the observed flux measurements, it would exert a declining trend, rather than a rising trend, to the observed curves. Again, despite impact of measurement covariance on color variability calculation, it is not responsible for the rising trend of the curves.
To conclude, in NGC 5548, the observed rising trend on the timescale dependency of color variability is not any result of observational effects, and the color variability predicted by the reprocessing scenario cannot match the timescale dependent color variability trend we observed.
5 Discussion
5.1 Known challenges to the reprocessing diagram
The reprocessing model was first brought up by Guilbert & Rees (1988). Though it usually neglects the origin of the intrinsic variability of the driven source, it has the merit of offering an elegant explanation for the variability in UV/optical bands and even in near infrared (Lira et al., 2010, 2011; Fausnaugh et al., 2016). Within the simple reprocessing diagram, the in-phase variability and the inter-band lags can both be nicely interpreted. It is thus widely accepted in literature though it has been constantly invoked and questioned over the past decades. Furthermore, it may also hold the possibility of making AGNs the “standard candle”, as demonstrated in Cackett et al. (2007).
Generally, the central illuminating source is assumed to be X-ray emission from the corona, as a natural physical extension of the prevailing disk-corona model. This is supported by numerous observations showing X-ray variations usually lead UV/optical variations (e.g., Bachev et al., 2009; Breedt et al., 2010; Cameron et al., 2012; Lohfink et al., 2014; Shappee et al., 2014; McHardy et al., 2014; Edelson et al., 2015; Pal et al., 2017). Indeed, recent measurements based on both X-ray reverberation mapping and gravitational microlensing suggest that the corona is quite compact and located in the vicinity (less than 20 ) of the SMBH (Morgan et al., 2012; Reis & Miller, 2013; Mosquera et al., 2013; Cackett et al., 2014; Blackburne et al., 2015), and thus likely to be a natural illuminating source. However, there are still a number of observations showing no clear correlation between X-ray and UV/optical variations (e.g., Maoz et al., 2002; Gaskell, 2006). Specifically, for NGC 5548, based on the reprocessing diagram, Starkey et al. (2017) derived the driving light curve for the UV/optical variations, and found it is poorly correlated with the observed Swift X-ray light curves. Also, as was pointed out by Gardner & Done (2017), disk reprocessing of the hard X-ray light curve produces UV/optical light curves with too much fast variability, comparing with the observed ones. They instead proposed that what is reprocessed is not the hard X-ray emission, but probably soft X-ray/FUV emission from the inner accretion disk with much smoother variation.
The energy budget is another prominent problem if X-ray corona is the driving source in the reprocessing diagram, as the luminosity of X-ray usually makes up only a small portion of the total bolometric luminosity; hence it would be insufficient to drive the variation of the whole disk (Gaskell et al., 2007; Gaskell, 2007). This issue would be especially serious for brighter quasars as the portion of X-ray luminosity is even smaller (Lusso et al., 2010; Strateva et al., 2005; Grupe et al., 2010).
On more issue with the illumination scenario, is that strong Lyman continuum emission would be expected on the spectra (Sincell & Krolik, 1997; Antonucci et al., 1989). However, it has never been observed for AGNs.
The more recent issue revealed for the reprocessing diagram is that the observed lags observed in many sources are systematically larger than predicted by the standard thin disk theory, such as MR 2251-178 (Arévalo et al., 2008), PG 1211+143 (Bachev et al., 2009), AGN 0957+561 (Gil-Merino et al., 2012), NGC 3516 (Noda et al., 2016), Fairall 9 (Pal et al., 2017) and Pan-STARRS quasar sample (Jiang et al., 2017). Typically, it is found that the observed lags are two to three times the lags given by the thin disk model. Efforts have been made in literatures to tackle this problem. For example, Gardner & Done (2017) tried to reconcile this issue by pushing the reprocessing region outward to the broad line region (also see Sun et al., 2018). And as demonstrated in Noda et al. (2016), the accretion flow may form a radiatively inefficient accretion flow, affecting the reprocessing paradigm, as well as the time delays, but this scenario is limited to accretion systems with low Eddington ratio.
5.2 A new evidence against the reprocessing diagram
In this work, we find the UV/optical color variation in NGC 5548 is clearly timescale-dependent, a trend similar to that found in quasars, but for the first time detected in an individual AGN.
We present a simple reprocessing model showing that reprocessing model seems to able to well reproduce the observed UV/optical light curves and the inter-band lags (see Section 5.1 for caveats of the reprocessing model). However, severe inconsistency between the reprocessing model and observations emerges while we look into the timescale dependency of the color variation. The reprocessing model failed to recover the observed timescale-dependent pattern in color variation. This can be further explained as below. In the reprocessing scheme, the reprocessed light curves are smoothed and lagged version of that of the driving source. The lag also corresponds to the smoothing timescale. At timescales considerably longer than the lags, reprocessed light curves in different bands are expected to be rather similar, thus is unable to reproduce a timescale-dependent color variation pattern. Unlike other challenges to the reprocessing diagram we discussed in Section 5.1, such controversy is hard to be reconciled within the reprocessing scheme. Therefore, reprocessing should not be the dominant mechanism in producing the observed UV/optical variation in NGC 5548. This also demonstrates that the timescale dependency of the color variation is a unique and powerful probe in diagnosing the AGN variations.
It is worthwhile to mention that the accretion disk size in high redshift quasars measured through micro-lensing studies is about 4 times that of the standard thin disk model (Pooley et al., 2007; Blackburne & Kochanek, 2010; Morgan et al., 2010; Dai et al., 2010). By splitting the accretion disk into large number of individual zones, and allowing the temperature of each zone fluctuating significantly and independently, Dexter & Agol (2011) found an inhomogeneous disk model is able to resolve such discrepancy in the disk size. More interestingly, a revised version of the inhomogeneous disk model is able to naturally yield a timescale-dependent color variation, consistent with observations (Cai et al., 2016).
However, such inhomogeneous disk model is not yet perfect. In the model, the temperature of each region of the disk varies independently, leading to no correlation between the variation of each individual disk region, thus faces difficulty to explain the observed well coordinated multi band light curves (Kokubo, 2015; Cai et al., 2016). Furthermore, the current model is unable to explain the observed inter-band lags. A further revised inhomogeneous disk model appears able to reproduce the observed inter-band lags and coordination without the need of light echoing (Cai et al., 2018).
Alternatively, both X-ray reprocessing and disk fluctuations might be at work, while the dominance of each might be epoch and timescale-dependent, and vary from source to source. Note some researches (Arévalo et al., 2008; Breedt et al., 2009) have shown that the X-ray reprocessing would work on shorter timescales but fail to explain the variability on longer timescales. Also, Arévalo et al. (2009) noticed that the variability amplitude in optical bands on longer timescale was greater than in X-ray in NGC 3783, thus can not be attributed to X-ray reprocessing. It is likely that reprocessing might play a major role at very short timescales, while disk fluctuation dominate at longer timescales. A dedicated quantitative work is also ongoing to investigate whether such a hybrid model is able to explain all the observations, in terms of inter-band correlations and lags, energy budget, disk size, and timescale-dependent color variation.
To summarize, we show that the color variation in NGC 5548 is clearly timescale-dependent, significantly challenging the widely accepted reprocessing diagram. A revised disk fluctuation model without the need of light echoing (Cai et al., 2018) seems able to well reproduce the observed variation in NGC 5548, including inter-band coordination and lags, and timescale-dependent color variation. Extensive work is also ongoing to investigate a hybrid model including both X-ray reprocessing and disk fluctuations. In addition, we demonstrate the power of timescale dependency of color variability again. It is possible to look into the inner part of the accretion disk with high cadence light curves. The idea of exchanging for physical resolution using temporal resolution is worthy exploring further in the age of temporal astronomy.
Acknowledgment
We are grateful for the anonymous referee’s careful reading and insightful reports, which improve this work a great deal. We also thank M. Mehdipour for kindly providing us their Swift light curves, which were used in our early analyses. Special thanks go to Robert Antonucci for bringing the Lyman continuum issue for illumination scenario to our attention. This work is supported by National Basic Research Program of China (973 program, grant No. 2015CB857005) and National Science Foundation of China (grants No. 11233002, 11421303 11503024). J.X.W. thanks support from Chinese Top-notch Young Talents Program, and CAS Frontier Science Key Research Program QYCDJ-SSW-SLH006. Z.Y.C. acknowledges support from the Fundamental Research Funds for the Central Universities.
.
References
- Antonucci et al. (1989) Antonucci, R. R. J., Kinney, A. L., & Ford, H. C. 1989, ApJ, 342, 64
- Arévalo et al. (2008) Arévalo, P., Uttley, P., Kaspi, S., et al. 2008, Monthly Notices of the Royal Astronomical Society, 389, 1479
- Arévalo et al. (2009) Arévalo, P., Uttley, P., Lira, P., et al. 2009, Monthly Notices of the Royal Astronomical Society, 397, 2004
- Bachev et al. (2009) Bachev, R., Grupe, D., Boeva, S., et al. 2009, Monthly Notices of the Royal Astronomical Society, 399, 750
- Blackburne & Kochanek (2010) Blackburne, J. A., & Kochanek, C. S. 2010, The Astrophysical Journal, 718, 1079
- Blackburne et al. (2015) Blackburne, J. A., Kochanek, C. S., Chen, B., Dai, X., & Chartas, G. 2015, The Astrophysical Journal, 798, 95
- Boutsia et al. (2009) Boutsia, K., Leibundgut, B., Trevese, D., & Vagnetti, F. 2009, Astronomy & Astrophysics, 497, 81
- Breedt et al. (2009) Breedt, E., Arévalo, P., McHardy, I. M., et al. 2009, Monthly Notices of the Royal Astronomical Society, 394, 427
- Breedt et al. (2010) Breedt, E., McHardy, I. M., Arévalo, P., et al. 2010, Monthly Notices of the Royal Astronomical Society, 403, 605
- Butler & Bloom (2011) Butler, N. R., & Bloom, J. S. 2011, The Astronomical Journal, 141, 93
- Cackett et al. (2007) Cackett, E. M., Horne, K., & Winkler, H. 2007, Monthly Notices of the Royal Astronomical Society, 380, 669
- Cackett et al. (2014) Cackett, E. M., Zoghbi, A., Reynolds, C., et al. 2014, Monthly Notices of the Royal Astronomical Society, 438, 2980
- Cai et al. (2016) Cai, Z.-Y., Wang, J.-X., Gu, W.-M., et al. 2016, The Astrophysical Journal, 826, 7
- Cai et al. (2018) Cai, Z.-Y., Wang, J.-X., Zhu, F.-F., et al. 2018, ApJ, 855, 117
- Cameron et al. (2012) Cameron, D. T., McHardy, I., Dwelly, T., et al. 2012, Monthly Notices of the Royal Astronomical Society, 422, 902
- Chakrabarti & Titarchuk (1995) Chakrabarti, S., & Titarchuk, L. G. 1995, Astrophysical Journal v.455, 455, 623
- Chiang et al. (2000) Chiang, J., Reynolds, C. S., Blaes, O. M., et al. 2000, The Astrophysical Journal, 528, 292
- Collaboration et al. (2013) Collaboration, A., Robitaille, T. P., Tollerud, E. J., et al. 2013, Astronomy & Astrophysics, 558, A33
- Collier et al. (2001) Collier, S., Crenshaw, D. M., Peterson, B. M., et al. 2001, The Astrophysical Journal, 561, 146
- Collier et al. (1998) Collier, S. J., Horne, K., Kaspi, S., et al. 1998, The Astrophysical Journal, 500, 162
- Dai et al. (2010) Dai, X., Kochanek, C. S., Chartas, G., et al. 2010, The Astrophysical Journal, 709, 278
- Dexter & Agol (2011) Dexter, J., & Agol, E. 2011, The Astrophysical Journal Letters, 727, L24
- Ebrero et al. (2016) Ebrero, J., Kaastra, J. S., Kriss, G. A., et al. 2016, Astronomy & Astrophysics, 587, A129
- Edelson et al. (2015) Edelson, R., Gelbord, J. M., Horne, K., et al. 2015, The Astrophysical Journal, 806, 129
- Edelson et al. (2017) Edelson, R., Gelbord, J., Cackett, E., et al. 2017, The Astrophysical Journal, 840, 41
- Fausnaugh et al. (2016) Fausnaugh, M. M., Denney, K. D., Barth, A. J., et al. 2016, The Astrophysical Journal, 821, 56
- Gardner & Done (2017) Gardner, E., & Done, C. 2017, Monthly Notices of the Royal Astronomical Society, 470, 3591
- Gaskell (2006) Gaskell, C. M. 2006, AGN Variability from X-Rays to Radio Waves ASP Conference Series, 360, 111
- Gaskell (2007) —. 2007, The Central Engine of Active Galactic Nuclei, 373, 596
- Gaskell et al. (2007) Gaskell, C. M., Klimek, E. S., & Nazarova, L. S. 2007, arXiv:0711.1025
- Gil-Merino et al. (2012) Gil-Merino, R., Goicoechea, L. J., Shalyapin, V. N., & Braga, V. F. 2012, The Astrophysical Journal, 744, 47
- Graham et al. (2014) Graham, M. J., Djorgovski, S. G., Drake, A. J., et al. 2014, Monthly Notices of the Royal Astronomical Society, 439, 703
- Grupe et al. (2010) Grupe, D., Komossa, S., Leighly, K. M., & Page, K. L. 2010, The Astrophysical Journal Supplement, 187, 64
- Guilbert & Rees (1988) Guilbert, P. W., & Rees, M. J. 1988, Monthly Notices of the Royal Astronomical Society (ISSN 0035-8711), 233, 475
- Guo & Gu (2016) Guo, H., & Gu, M. 2016, The Astrophysical Journal, 822, 26
- Guo et al. (2017) Guo, H., Wang, J., Cai, Z., & Sun, M. 2017, arXiv.org, arXiv:1709.05271
- Haardt & Maraschi (1991) Haardt, F., & Maraschi, L. 1991, Astrophysical Journal, 380, L51
- Hunter (2007) Hunter, J. D. 2007, Computing in Science & Engineering, 9, 90
- Jiang et al. (2017) Jiang, Y.-F., Green, P. J., Greene, J. E., et al. 2017, The Astrophysical Journal, 836, 186
- Kelly et al. (2009) Kelly, B. C., Bechtold, J., & Siemiginowska, A. 2009, The Astrophysical Journal, 698, 895
- Kokubo (2015) Kokubo, M. 2015, Monthly Notices of the Royal Astronomical Society, 449, 94
- Komatsu et al. (2011) Komatsu, E., Smith, K. M., Dunkley, J., et al. 2011, arXiv.org, 192, 18
- Kriss et al. (2000) Kriss, G. A., Peterson, B. M., Crenshaw, D. M., & Zheng, W. 2000, The Astrophysical Journal, 535, 58
- Krolik et al. (1991) Krolik, J. H., Horne, K., Kallman, T. R., et al. 1991, Astrophysical Journal, 371, 541
- Lira et al. (2010) Lira, P., Arévalo, P., Uttley, P., McHardy, I., & Breedt, E. 2010, Co-Evolution of Central Black Holes and Galaxies, 267, 90
- Lira et al. (2011) —. 2011, Monthly Notices of the Royal Astronomical Society, 415, 1290
- Lohfink et al. (2014) Lohfink, A. M., Reynolds, C. S., Vasudevan, R., Mushotzky, R. F., & Miller, N. A. 2014, The Astrophysical Journal, 788, 10
- Lusso et al. (2010) Lusso, E., Comastri, A., Vignali, C., et al. 2010, Astronomy & Astrophysics, 512, A34
- MacLeod et al. (2011) MacLeod, C. L., Brooks, K., Ivezić, Ž., et al. 2011, The Astrophysical Journal, 728, 26
- Maoz et al. (2002) Maoz, D., Markowitz, A., Edelson, R., & Nandra, K. 2002, The Astronomical Journal, 124, 1988
- McHardy et al. (2014) McHardy, I. M., Cameron, D. T., Dwelly, T., et al. 2014, Monthly Notices of the Royal Astronomical Society, 444, 1469
- Mehdipour et al. (2015) Mehdipour, M., Kaastra, J. S., Kriss, G. A., et al. 2015, Astronomy & Astrophysics, 575, A22
- Mehdipour et al. (2016) —. 2016, Astronomy & Astrophysics, 588, A139
- Morgan et al. (2010) Morgan, C. W., Kochanek, C. S., Morgan, N. D., & Falco, E. E. 2010, The Astrophysical Journal, 712, 1129
- Morgan et al. (2012) Morgan, C. W., Hainline, L. J., Chen, B., et al. 2012, The Astrophysical Journal, 756, 52
- Mosquera et al. (2013) Mosquera, A. M., Kochanek, C. S., Chen, B., et al. 2013, The Astrophysical Journal, 769, 53
- Nandra et al. (1998) Nandra, K., Clavel, J., Edelson, R. A., et al. 1998, The Astrophysical Journal, 505, 594
- Noda et al. (2016) Noda, H., Minezaki, T., Watanabe, M., et al. 2016, The Astrophysical Journal, 828, 78
- Pal et al. (2017) Pal, M., Dewangan, G. C., Connolly, S. D., & Misra, R. 2017, Monthly Notices of the Royal Astronomical Society, 466, 1777
- Pancoast et al. (2014) Pancoast, A., Brewer, B. J., Treu, T., et al. 2014, Monthly Notices of the Royal Astronomical Society, 445, 3073
- Peters et al. (2015) Peters, C. M., Richards, G. T., Myers, A. D., et al. 2015, The Astrophysical Journal, 811, 95
- Peterson (1993) Peterson, B. M. 1993, Astronomical Society of the Pacific, 105, 247
- Peterson (2014) —. 2014, Space Science Reviews, 183, 253
- Peterson et al. (1998) Peterson, B. M., Wanders, I., Horne, K., et al. 1998, The Publications of the Astronomical Society of the Pacific, 110, 660
- Peterson et al. (2004) Peterson, B. M., Ferrarese, L., Gilbert, K. M., et al. 2004, The Astrophysical Journal, 613, 682
- Pooley et al. (2007) Pooley, D., Blackburne, J. A., Rappaport, S., & Schechter, P. L. 2007, The Astrophysical Journal, 661, 19
- Reis & Miller (2013) Reis, R. C., & Miller, J. M. 2013, The Astrophysical Journal Letters, 769, L7
- Ruan et al. (2014) Ruan, J. J., Anderson, S. F., Dexter, J., & Agol, E. 2014, The Astrophysical Journal, 783, 105
- Ruan et al. (2012) Ruan, J. J., Anderson, S. F., MacLeod, C. L., et al. 2012, The Astrophysical Journal, 760, 51
- Schmidt et al. (2010) Schmidt, K. B., Marshall, P. J., Rix, H.-W., et al. 2010, The Astrophysical Journal, 714, 1194
- Schmidt et al. (2012) Schmidt, K. B., Rix, H.-W., Shields, J. C., et al. 2012, The Astrophysical Journal, 744, 147
- Sesar et al. (2007) Sesar, B., Ivezić, Ž., Lupton, R. H., et al. 2007, The Astronomical Journal, 134, 2236
- Shappee et al. (2014) Shappee, B. J., Prieto, J. L., Grupe, D., et al. 2014, The Astrophysical Journal, 788, 48
- Sincell & Krolik (1997) Sincell, M. W., & Krolik, J. H. 1997, ApJ, 476, 605
- Starkey et al. (2017) Starkey, D., Horne, K., Fausnaugh, M. M., et al. 2017, The Astrophysical Journal, 835, 65
- Starkey et al. (2016) Starkey, D. A., Horne, K., & Villforth, C. 2016, Monthly Notices of the Royal Astronomical Society, 456, 1960
- Stirpe et al. (1994) Stirpe, G. M., Winge, C., Altieri, B., et al. 1994, Astrophysical Journal, 425, 609
- Strateva et al. (2005) Strateva, I. V., Brandt, W. N., Schneider, D. P., Vanden Berk, D. G., & Vignali, C. 2005, The Astronomical Journal, 130, 387
- Suganuma et al. (2006) Suganuma, M., Yoshii, Y., Kobayashi, Y., et al. 2006, The Astrophysical Journal, 639, 46
- Sun et al. (2018) Sun, M., Grier, C., & Peterson, B. 2018, ascl
- Sun et al. (2018) Sun, M., Xue, Y., Cai, Z., & Guo, H. 2018, ArXiv e-prints, arXiv:1803.06090 [astro-ph.HE]
- Sun et al. (2014) Sun, Y.-H., Wang, J.-X., Chen, X.-Y., & Zheng, Z.-Y. 2014, The Astrophysical Journal, 792, 54
- Timmer & Koenig (1995) Timmer, J., & Koenig, M. 1995, Astronomy & Astrophysics, 300, 707
- Ulrich et al. (1997) Ulrich, M.-H., Maraschi, L., & Urry, C. M. 1997, Annual Review of Astronomy and Astrophysics, 35, 445
- Uttley et al. (2003) Uttley, P., Edelson, R., McHardy, I. M., Peterson, B. M., & Markowitz, A. 2003, The Astrophysical Journal, 584, L53
- Zhu et al. (2016) Zhu, F.-F., Wang, J.-X., Cai, Z.-Y., & Sun, Y.-H. 2016, The Astrophysical Journal, 832, 75
- Zu et al. (2013) Zu, Y., Kochanek, C. S., Kozłowski, S., & Udalski, A. 2013, The Astrophysical Journal, 765, 106
- Zu et al. (2011) Zu, Y., Kochanek, C. S., & Peterson, B. M. 2011, The Astrophysical Journal, 735, 80