High-Precision Half-life Measurement for the Superallowed Fermi Emitter 22Mg
Abstract
A high-precision half-life measurement for the superallowed Fermi emitter 22Mg was performed at the TRIUMF-ISAC facility using a 4 proportional gas counter. The result of s is a factor of 3 more precise than the previously adopted world average and resolves a discrepancy between the two previously published 22Mg half-life measurements.
I Introduction
Precision measurements of the values for superallowed Fermi -decay transitions between , isobaric analogue states provide fundamental tests of the electroweak interaction described by the Standard Model Ha15 . These transitions, which in leading order depend only on the vector part of the weak interaction, provide a stringent test of the Conserved-Vector-Current (CVC) hypothesis and a direct measure of the weak vector coupling constant, . In combination with the Fermi coupling constant, , which is obtained from muon decay measurements, the superallowed transitions also currently provide the most precise determination of , the most precisely determined element of the Cabibbo-Kobayashi-Maskawa (CKM) quark mixing matrix Ha15 . Combined with and , the top-row elements of the CKM matrix provide the most precise test of CKM unitarity with the result PDG16 . In addition to precision tests of the Standard Model, the superallowed Fermi transitions also set stringent limits on possible physics scenarios beyond the Standard Model, such as the existence of weak scalar currents Du16 .
Experimentally, the superallowed decay -values are determined via measurements of the half-life, , branching ratio, , and transition energy, , of the analogue transition. In addition to the experimental quantities, several theoretical corrections must be applied in order to obtain nucleus independent values. These “corrected”- values for the superallowed emitters are given by Ha15 :
| (1) |
where GeV-4s is a constant, is a transition-independent radiative correction, and are transition-dependent radiative corrections, and is the isospin-symmetry-breaking correction.
In the most recent survey of the world superallowed data Ha15 , the constancy of the 14 transitions with values measured to a precision of at least 0.4% was used to confirm the CVC hypothesis at the level of . This constancy, and the resulting world-average superallowed value used to determine and , are, however, dependent on the theoretical approach used to calculate the corrections. In the past two decades, many different approaches have been considered Or95 ; Sa96 ; To02 ; To08 ; Mi08 ; Mi09 ; Au09 ; Li09 ; Ca09 ; Sa09 ; To10 ; Gr10 ; Sa11 ; Sa12 , with significant model dependence of the resulting values. Such variations in directly affect the Standard Model tests of the CVC hypothesis, the determination of , and the test of CKM unitarity.
In previous evaluations of the world superallowed data Ha09 ; Ha05 , the model dependence of the -values arising from different theoretical approaches to the corrections was taken into account by assigning a systematic uncertainty to the world average value. In particular, two sets of corrections were considered. In both approaches, is broken into , where accounts for the difference in configuration mixing in the parent and daughter states, and accounts for the imperfect overlap between the daughter and parent radial wavefunctions. The correction is obtained from a Shell Model (SM) calculation with the isospin non-conserving components of the Hamiltonian constrained to reproduce measured coefficients of the isobaric multiplet mass equation (IMME). In the first approach, the correction is calculated using radial wavefunctions derived from a Woods-Saxon (SM-WS) potential To08 whereas in the second approach Hartree-Fock (SM-HF) eigenfunctions are used Or85 ; Ha09 ; Or89 ; Or95 . The model-dependence of the correction was taken into account by averaging the values from the SM-WS and SM-HF calculations, and assigning a systematic uncertainty based on the difference between the two values.
In the most recent evaluation of the world superallowed data Ha15 , however, only the SM-WS correction was used in the calculation and no model dependent systematic uncertainty arising from the correction was assigned to the value. This choice was motivated by the better agreement with the CVC hypothesis obtained with the SM-WS corrections as well as a recent measurement of the 38Ca branching ratio Pa14 which resulted in a better agreement between the experimentally determined ratio of values of the “mirror” superallowed transitions 38Ca K and 38mK 38Ar with the calculated ratio using the SM-WS approach Ha15 .
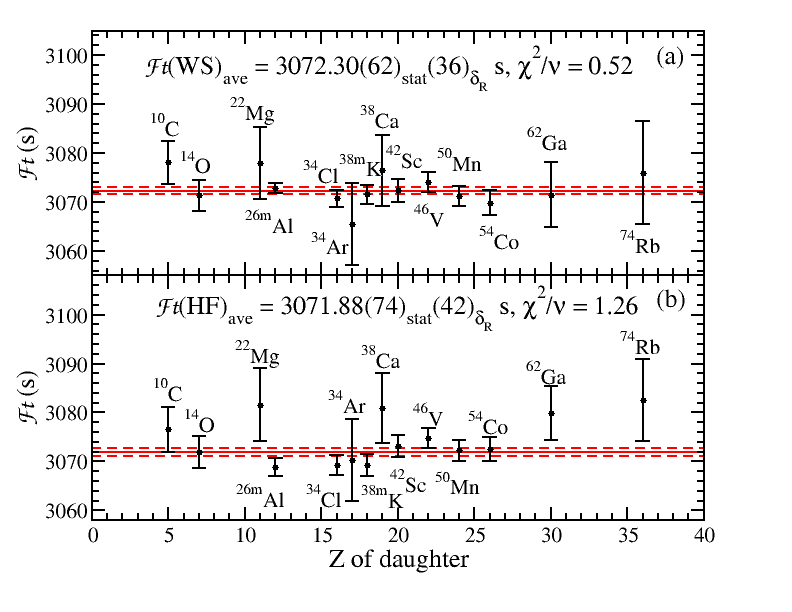
The 14 most precisely measured values from the most recent evaluation Ha15 are plotted for both sets of corrections in Figure 1. Although the SM-WS corrections show better agreement with the CVC hypothesis, with a , the values obtained when the SM-HF corrections Ha09 are used yield a for 13 degrees of freedom, which has a probability of 23% for statistically independent data. Furthermore, as can be seen in Figure 1, the larger obtained when the SM-HF corrections are used originates primarily from four of the least precisely determined values included in the evaluation, namely 22Mg, 38Ca, 62Ga, and 74Rb. If only the 9 transitions with values determined to 0.15% or better are retained, one obtains with and with , both of which are consistent with the CVC hypothesis but with central values differing by 0.77 s, equivalent to the entire statistical uncertainty of the world superallowed dataset. For the high- cases of 62Ga and 74Rb, the uncertainties are dominated by the theoretical corrections, but for the emitters 22Mg, 34Ar, and 38Ca, the uncertainties are currently dominated by the precision of the experimental data. Improved measurements for these emitters are thus crucial for testing the model dependence of the isospin-symmetry-breaking corrections in superallowed Fermi decays.
For the case of 22Mg, the uncertainty in the value is dominated by the experimental uncertainties in the branching ratio and half-life measurements. The currently adopted half-life of 22Mg, s Ha15 , is determined from two measurements, s Ha03 and s Ha75 . The disagreement between these two measurements, with a , leads to an inflation in the uncertainty of the adopted world-average half-life for 22Mg by a factor of 2 Ha15 . In this paper, we report a new measurement of the 22Mg half-life with a precision of 0.02%. This new measurement is in agreement with, but 1.5 times more precise than, the measurement reported in Ref. Ha03 . The agreement of the two high precision measurements excludes the older, less precise, result of Ref. Ha75 and results in an improvement in the precision of the world-average half-life by more than a factor of 3.
II Experiment
The experiment was performed at TRIUMF’s Isotope Separator and Accelerator (ISAC) facility where the Isotope Separation On-Line (ISOL) technique is used to produce radioactive ion beams (RIBs) TRIUMF . A 40 A beam of 480 MeV protons from TRIUMF’s main cyclotron impinged on a SiC target to produce spallation products. The target was coupled to the Ion Guide Laser Ion Source (IGLIS) to produce intense beams of laser-ionized 22Mg, while suppressing surface ionized contaminants, such as 22Na, by a factor of - Ra14 . A high-resolution mass separator was then used to select a beam of singly ionized products which included 22Mg at ions/s and a remaining contaminant of 22Na at ions/s which was delivered to the experimental hall as a 30 keV ion beam.
The half-life measurements were performed using a 4 continuous-flow gas proportional counter which detects particles with near 100% efficiency Du16 . The beam was implanted under vacuum into a thick (17.2 m) Al layer of an aluminized Mylar tape La15 for a duration of - s in order to build up a source of 22Mg, after which the beam was deflected after the mass separator. In order to avoid space charge effects, methane gas was continually flushed through the gas counter at a rate of approximately 0.5 cc/min and the maximum counting rate in the gas counter was limited to kHz by allowing the 22Mg sample to “cool” for 2 s. The tape was then moved into the centre of the gas counter in s and the decay was measured for - s, corresponding to approximately 25 half-lives of 22Mg. The amplified and discriminated pulses from the gas counter were fanned to two LeCroy 222N gate-and-delay generators where two fixed and nonextendible dead-times of approximately 3 s and 4 s were applied. The dead-time affected data were then multiscaled in two multichannel scaler (MCS) modules with a Stanford Research Systems model DS335 temperature stabilized precision clock used to provide the time standard. The two dead-times were interchanged between the two MCS modules throughout the experiment to investigate any potential systematic effects. The 22Mg decay data were binned into 250 channels with channel dwell times of either 0.40 s or 0.36 s. Following the decay, the tape was moved into a tape disposal box in order to remove any long-lived contaminants out of view of the detector. Following the experiment, the frequency of the time standard, set to a nominal value of 100 kHz, was measured to be 99.99978 kHz and was found to be stable to ppm over a period of 24 hours.
III Analysis
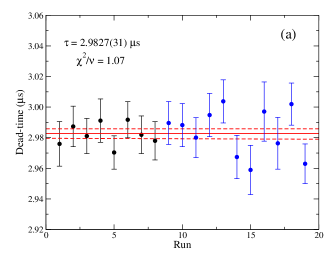
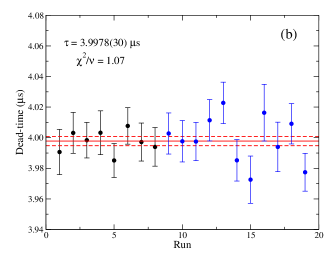
Measurements of the applied dead-time were performed before and after the experiment using the source-plus-pulser technique Ba65 . A plot of the dead-time measurements for each run is shown in Figure 2. Following a small inflation of the statistical uncertainty by for both datasets, the two applied dead-times were determined to be 2.9827(32) s and 3.9978(31) s, respectively.
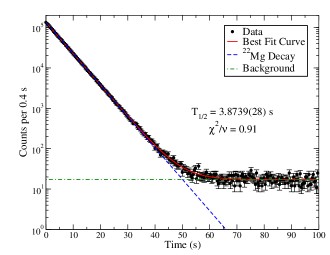
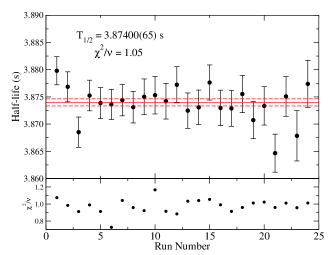
Each cycle of the 22Mg decay data was analyzed individually in order to assess the quality of the data. Cycles with a considerable drop in the total number of counts, corresponding to a drop in the beam intensity due to interruptions of the proton beam, were removed. Cycles in which spurious noise signals in the gas counters occurred were also removed from the analysis. Following the inspection of the individual cycles, a total of 681 good cycles from 24 runs were used in the final analysis corresponding to 97% of the total data acquired during the experiment. The data from the individual cycles were dead-time corrected and, for a given run, the dead-time corrected data from each cycle was summed. These data were then fit using a Poisson log-likelihood function in a Levenberg Marquardt minimization method Gr05 ; Fi11 . The activity was fit to an exponentially decaying function which included the primary 22Mg component and a constant background component. The dead-time corrected data and best fit curve for a typical run is shown in Figure 3. The deduced half-life from each of the MCS modules for a given run was then averaged. The deduced half-lives for each run are shown Figure 4 and yield a weighted average half-life of s with a of 1.05 over the 24 runs.
III.1 Contaminants
Although the IGLIS ion source suppresses the surface ionized 22Na contaminant in the beam by a factor of -, it is still delivered to the experimental station at a rate of approximately ions/s. Since 22Na has a half-life of y 22Na , the activity from 22Na is very well approximated by a constant over the s decay period and is thus accounted for in the constant background component of the fit function. In order to ensure that the 22Na activity has no effect on the deduced 22Mg half-life, the constant background component in the fit was replaced with an exponentially decaying function with the half-life of 22Na. Re-fitting the data with the decay of 22Na results in a change in the 22Mg half-life at the s level and is thus entirely negligible at the level of precision reported here. Similarly, the “grow-in” of 22Na activity as the daughter of 22Mg decay could, in principle, also affect the deduced half-life. The data was thus again re-fit with an additional term corresponding to the grow-in activity of the 22Na daughter. A change in the 22Mg half-life at the s level was obtained and is also entirely negligible relative to the statistical uncertainty.
Contributions from several other potential in-beam isobaric contaminants that would not be resolved by the mass separator were also considered, although with the combination of much lower ionization efficiency for these contaminants as well as the surface ion suppression provided by IGLIS, none were expected to be present in the beam. Potential contaminants included: 22O, 22F, 21Na and 21F (which could, in principle, be delivered at as molecular beams with hydrogen), and 44K2+ (whose charge to mass ratio is 22). During the experimental running time, the RIB was also delivered to the GRIFFIN -ray spectrometer Sv14 ; Ga17 which is located next to the gas counter. A - coincidence -ray energy spectrum, corresponding to a subset of the data taken during the experiment, is shown in Figure 5. The absence of any of the characteristic photopeaks from the decay of contaminants suggests that no additional isobaric contamination was present in the beam. Nonetheless, the -ray data was used to set upper limits on the contribution from each contaminant by fitting photopeaks of fixed full-width half maximum (FWHM) at the expected location of the characteristic -rays from each contaminant. An upper limit on the activity of the contaminant determined in this way was then included in the half-life fitting procedure, with its half-life and initial activity of the contaminant included as fixed parameters in the fit. For the unphysical cases in which the central value of the fitted peak areas was negative, the Gaussian probability distribution was integrated over the physical region of positive counts and the upper limit was deduced by determining the number of counts corresponding to 68% of the area of the positive count region of the probability distribution. The deduced upper limits, as well as the change in the 22Mg half-life when the individual contaminants were included in the fitting procedure, are shown in Table 1. The resulting changes in the 22Mg half-life from the inclusion of each contaminant were added in quadrature yielding a total contribution of 0.00011 s which we assign as a systematic uncertainty.

| Potential | Half-life | Upper Limit | Change in the |
| Contaminant | (s) | on the Activity | 22Mg Half-life |
| NNDC ; Fi17 | Relative to 22Mg | (s) | |
| 22O | 2.250(90) | -0.00010 | |
| 22F | 4.230(40) | ||
| 21Na | 22.448(8) | 0.00004 | |
| 21F | 4.158(20) | 0.00001 | |
| 44K | 1327.8(114) | ||
| Total | 0.00011 |
III.2 Rate Dependent Effects
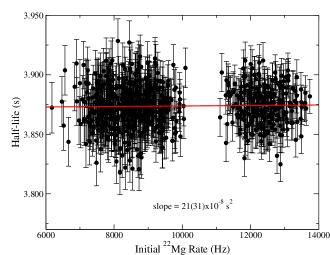
During the experiment the rate in the gas counter was limited to 14 kHz in order to avoid space charge effects which can affect the half-life measurement. Nonetheless, we investigated a possible dependence of the half-life on the count rate in the gas counter. A plot of the half-life deduced from each cycle as a function of the initial rate is shown in Figure 6. A weighted linear regression yields slope of s2. This is consistent with zero, indicating no effect on the deduced half-life over the range of rates in the gas counter used in this experiment.
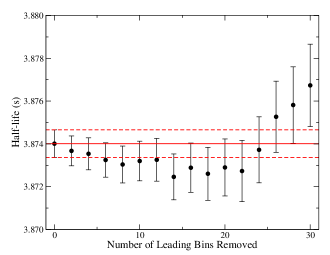
Additional investigation of possible rate dependent effects was performed by systematically removing leading channels from the decay curve and re-fitting the remaining data. The deduced half-life as a function of the number of leading channels removed is shown in Figure 7, with no statistically significant change in the half-life observed.
III.3 Systematic Uncertainties
Since the data used in the analysis are the averages of the data from the two MCS modules, with two different imposed dead-times, both the data from the individual MCS modules and the data with common dead-times were compared. As shown in Figure 8, both of the MCS modules and the two different dead-time values yield half-life results in complete agreement.
Following the completion of each run, the experimental running conditions were varied in order to investigate potential systematic effects arising from the choice of running conditions. The grouping of the data according to the different running conditions, which included different applied bias voltage (2350 V, 2400 V, 2450 V, and 2500 V) on the gas counter and different threshold voltages (70 mV, 85 mV, 100 mV, and 115 mV) are also shown in Figure 8. While the grouping by threshold settings yields , the grouping by bias voltage gives . Although a for three degrees of freedom is expected 23% of the time for statistically independent data, we follow the conservative approach recommended by the Particle Data Group PDG16 and inflate the statistical uncertainty by the largest value. For this analysis, we thus inflate the uncertainty by and assign 0.00043 s as a systematic uncertainty.
Finally, the dead-times were also varied within of their measured values and the data re-fit in order to investigate any variations in the half-life. The resulting change in the half-life of 0.00004 s was included as an additional systematic uncertainty.

The final 22Mg half-life result from this work is thus:
| (2) |
IV Conclusions
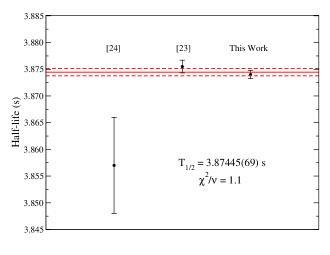
A high-precision half-life measurement for the superallowed emitter 22Mg was performed yielding a half-life of 3.87400 s, which is now the most precise measurement of the 22Mg half-life. As this result is more than a factor of 10 more precise than the value of s reported in Ref. Ha75 , we follow the procedure of Ref. Ha15 and exclude the result of Ref. Ha75 in the final averaging, obtaining a new world-average of s with a of 1.1 from a weighted average of the current measurement and that of Ref. Ha03 , as shown in Figure 9. This represents an improvement in the precision of the world average half-life by more than a factor of 3 and resolves the discrepancy between the two previously published half-life measurements. Including this new half-life measurement, as well as a recent measurement of keV Le17 for the value between the 22Mg and 22Na ground states, with the previously evaluated superallowed data compiled in Ref. Ha15 yields an updated value of s for 22Mg superallowed decay. The uncertainty of the 22Mg value is now completely dominated by the uncertainty of the superallowed branching ratio. An improvement in the precision of this branching ratio will thus be critical to compare the tests of the CVC hypothesis using the SM-HF and the SM-WS corrections for 22Mg.
Acknowledgements.
This research was supported by the Natural Sciences and Engineering Research Council of Canada (NSERC) and the Canada Research Chairs Program. The GRIFFIN spectrometer used for the -ray analysis was jointly funded by the Canada Foundation for Innovation (CFI), TRIUMF, and the University of Guelph. TRIUMF receives federal funding via a contribution agreement through the National Research Council of Canada.References
- (1) J.C. Hardy and I.S. Towner, Phys. Rev. C 91, 025501 (2015).
- (2) C. Patrignani et al. (Particle Data Group), Chin. Phys. C, 40, 100001 (2016).
- (3) M. R. Dunlop et al., Phys. Rev. Lett. 116, 172501 (2016).
- (4) W. E. Ormand and B. A. Brown, Phys. Rev. C 52, 2455 (1995).
- (5) H. Sagawa, N. Van Giai, and T. Suzuki, Phys. Rev. C 53, 2163 (1996).
- (6) I. S. Towner and J. C. Hardy, Phys. Rev. C 66, 035501 (2002).
- (7) I.S. Towner and J.C. Hardy, Phys. Rev. C 77, 025501 (2008).
- (8) G. A. Miller and A. Schwenk, Phys. Rev. C 78 035501 (2008).
- (9) N. Auerbach, Phys. Rev. C 79, 035502 (2009).
- (10) G. A. Miller and A. Schwenk, Phys. Rev. C 80, 064319 (2009).
- (11) H. Liang, N. Van Giai and J. Meng, Phys. Rev. C 79, 064316 (2009).
- (12) A. E. Calik, M. Gerceklioglu, and D. I. Salamov, Z. Naturforsch 64a, 865 (2009).
- (13) W. Satula, J. Dobaczewski, W. Nazarewicz, and M. Rafalski, Phys. Rev. Lett 103, 012502 (2009).
- (14) I. S. Towner and J. C. Hardy, Phys. Rev. C 82, 065501 (2010).
- (15) G. F. Grinyer, C. E. Svensson, and B. A. Brown, Nucl. Instrum. Meth. A 662, 236 (2010).
- (16) W. Satula, J. Dobaczewski, W. Nazarewicz, and M. Rafalski, Phys. Rev. Lett 106, 132502 (2011).
- (17) W. Satula, J. Dobaczewski, W. Nazarewicz, and T. R. Werner, Phys. Rev. C 86, 054316 (2012).
- (18) J. C. Hardy and I. S. Towner, Phys. Rev. C 79, 055502 (2009).
- (19) J. C. Hardy and I. S. Towner, Phys. Rev. C 71, 055501 (2005).
- (20) W. E. Ormand and B. A. Brown, Nucl. Phys. A440, 274 (1985).
- (21) W. E. Ormand and B. A. Brown, Phys. Rev. Lett. 62, 866 (1989).
- (22) H. I. Park et al., Phys. Rev. Lett. 112, 102502 (2014).
- (23) J.C. Hardy, V. E. Iacob, M. Sanchez-Vega, R. G. Neilson, A. Azhari, C. A. Gagliardi, V. E. Mayes, X. Tang, L. Trache, and R. E. Tribble, Phys. Rev. Lett. 91, 082501 (2003).
- (24) J.C. Hardy, H. Schmeing, J. S. Geiger and R. L. Graham, Nucl. Phys. A 246, 61 (1975).
- (25) J. Dilling, R. Krücken, and G. Ball, Hyperfine Interact. 225, 1 (2014).
- (26) S. Raeder, H. Heggen, J. Lassen, F. Ames, D. Bishop, P. Bricault, P. Kunz, A. Mjøs, and A. Teigelhöfer, Rev. Sci. Instrum. 85, 033309 (2014).
- (27) A.T. Laffoley et al., Phys. Rev. C 92, 025502 (2015).
- (28) A.P. Baerg, Metrologia 1, 131 (1965).
- (29) G.F. Grinyer et al., Phys. Rev. C 71, 044309 (2005).
- (30) P. Finlay et al., Phys. Rev. Lett. 106, 032501 (2011).
- (31) M. M. Bé et al., in Table of Radionuclides (Bureau International des Poids et Mesures (BIPM), Sèvres, Cedex, 2004), Vol. 5.
- (32) C. E. Svensson and A. B. Garnsworthy, Hyperfine Interact. 225 127 (2014).
- (33) A. B. Garnsworthy et al., Nucl. Instrum. Methods Phys. Res. A 853 85 (2017).
- (34) M. R. Bhat, Evaluated Nuclear Structure Data File (ENSDF), Nuclear Data for Science and Technology, page 817, edited by S. M. Qaim (SpringerVerlag,Berlin, Germany, 1992). Data extracted using the NNDC On-Line Data Service from the ENSDF database, file revised as of August 1, 2017.
- (35) P. Finlay et al., Phys. Rev. C 96, 025501 (2017).
- (36) K. G. Leach, private communication and to be published (2017).