Underlying Event Measurements at CMS
Rajat Gupta
Panjab University, Chandigarh
Measurements of Underlying Event activity using proton-proton collision data collected by the CMS detector will be presented. To check the energy dependence of the underlying event activity, results are compared with previous measurements from different experiments at different centre-of-mass energies.
PRESENTED AT
Presented at EDS Blois 2017, Prague,
Czech Republic, June 26-30, 2017
1 Introduction
The combination of particle production from multiple parton interactions (MPI) (excluding parton-parton scattering with the highest momentum transfer) and beam-beam remnant (BBR) interactions is commonly called the underlying event (UE). The UE usually produces particles at low transverse momenta that cannot be experimentally distinguished from particles produced from initial (ISR) and final state radiation (FSR). These processes cannot be completely described by perturbative quantum chromodynamics (QCD) calculations, and require phenomenological models, whose parameters are tuned by means of fits to data. The properties of the UE are measured as a function of conventional observables related to the impact parameter of the pp collision, such as the average number of charged particles and the scalar sum of their The data are corrected for detector effects using the iterative D’Agostini method [1] and compared to Monte Carlo (MC) event generators, as well as with earlier results at = 1.96 [2] and 7 TeV [3]. In this paper, we present recent results on measurements of UE activity using events with a leading track and leading jet at a centre-of-mass energy of 13 TeV [4], and measurements of the UE activity using events with a Z boson (with muonic decay) at a centre-of-mass energy of 13 TeV [5]. The UE measurement with Z boson events is complementary to measurements with a leading jet and leading track, which corroborate the universality of the UE.
2 UE measurement using leading charged particle tracks and charged jets
The UE measuerement is performed using leading charged particles as well as leading charged particles jets as reference objects at the centre-of-mass energy of 13 TeV [4]. A leading charged particle or charged particle jet is required to be produced in the central pseudorapidity region ( 2) and with transverse momentum 0.5 ( 1) GeV for the leading charged particle (charged particle jet).
The data used in this analysis are selected from an unbiased sample of events whenever there is a beam crossing in the CMS detector. This corresponds to an integrated luminosity of 281 nb-1.
The UE activity is quantified in terms of the average number of charged particles in an event per unit area (particle density) and the scalar sum of their in an event per unit area ( density), with 2 and 0.5 GeV in the region orthogonal to the azimuthal direction of the leading charged particle or jet, referred to as the transverse region ( 120∘). The transverse region can be split into 2 halves depending on the sign of . The transMAX (transMIN) densities are then defined as the densities in the transverse half with a higher (lower) activity. The transDIF density is then defined as the difference of transMAX and transMIN densities. Adding all sources of uncertainty in quadrature results in a total systematic uncertainty of about 8–9%
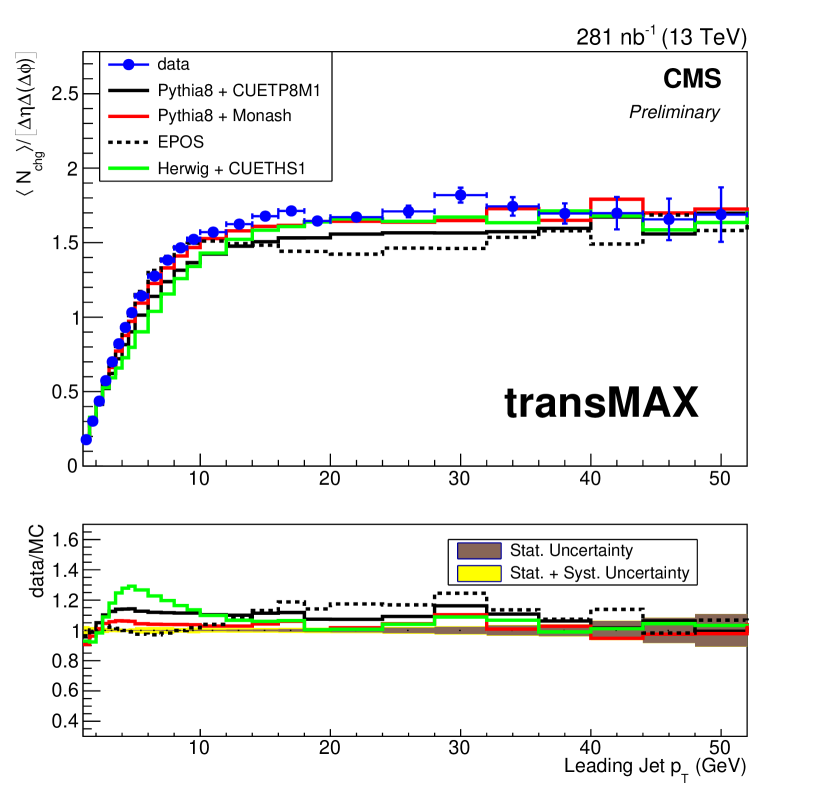
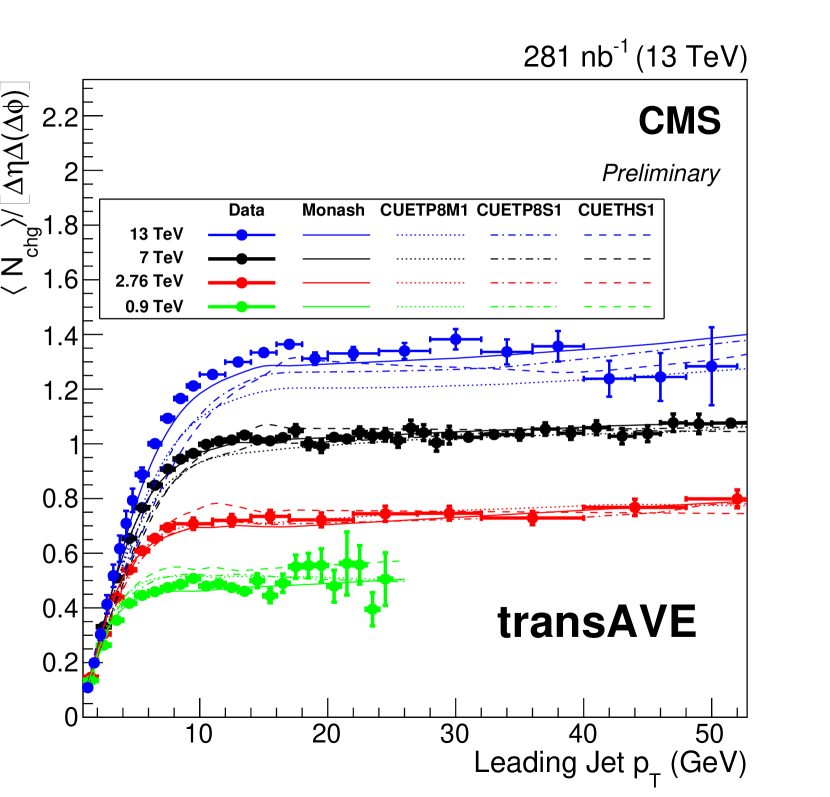
The transMAX particle densities are shown in figure 2, as a function of . The measurements are better described by the Monash tune of PYTHIA8. The PYTHIA8 CUETP8M1 tune describes the measurements within 1020%. The predictions by the CUETHS1 tune of HERWIG fails in the low region. EPOS describes the low rising region well but fails to describe the plateau region by 20%. Distributions for the average densities (not shown) also reveal similar behaviour. In all plots, the densities increase sharply up to 5 (1215) GeV and then rise slowly with increasing (). The level of agreement between simulations and the measurements falls within 1020% in the plateau region but differs in the low region. The sharp rise is interpreted in the MC models as due to an increase in the MPI contribution which reaches a plateau at high . Comparisons between various MC simulated samples and data across centre-of-mass energies of 0.9, 2.76, 7, and 13 TeV are made for transAVE as a function of as shown in figure 2. There is a strong rise in the UE activity as a function of the centre-of-mass energy, as predicted by the MC tunes. The transMIN (not shown) densities exhibit a stronger dependence than the transDIF (not shown) density, indicating that the activity coming from MPI grows more with than that from ISR and FSR.
3 UE measurement using the Z-boson process
A measurement of the UE activity using events with a Z-boson (with muonic decay) at a centre-of-mass energy of 13 TeV [5] is presented. The Z-boson production is experimentally clean and theoretically well understood, allowing a clear identification of the UE activity.
The analysis is performed with a data sample of pp collisions corresponding to an integrated luminosity of 2.1 fb-1 at a centre-of-mass energy of 13 TeV, collected using the CMS detector at the LHC [6]. Events are triggered with the requirement of at least two isolated muon candidates with 17 GeV and 8 GeV for leading and subleading muons respectively.
The offline selection criteria require each event to have at least one well reconstructed primary vertex. Both muons are required to lie within a range of 2.4. The events with two oppositely charged muons are further required to have an invariant mass (Mμμ) in the window of 81–101 GeV. After all the selections, there are about 1.3 million Z candidate events in the data, which is in agreement with simulated samples within 1–2%. Selected events have background contributions, mainly from top-quark and diboson processes, of about 0.3%.
In the selected Z-boson events, all the tracks with 0.5 GeV and 2 are considered for the UE measurements. The track selection efficiencies for data and simulated samples agree within 4–5%.
The UE activity is again quantified in terms of the particle density and their density. These observables are calculated in different phase-space regions defined with respect to the resultant azimuthal direction of the two selected muons, classified as towards region ( 60∘), transverse region ( 120∘), and away region ( 120∘).
For the comparison with predictions from different simulations and tuning of model parameters, the UE distributions are corrected to the stable charged particle level using the iterative D’Agostini method [1], which properly considers the bin-to-bin migrations. The unfolded measured distributions can get biased due to the selection criteria and simulated samples used for the unfolding. The total systematic uncertainty in the particle and densities is about 4.8–7.8%.
The unfolded distributions of the UE activity as a function of are compared with predictions from various simulations. In order to understand the MPI evolution with centre-of-mass energies, measurements are also compared with previous results from Tevatron and LHC.
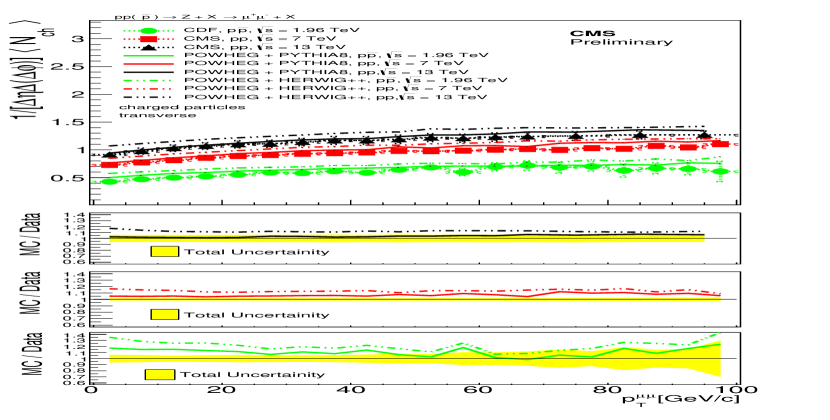
Figure 4 shows the UE activity as a function of at centre-of-mass energies of 1.96, 7, and 13 TeV. The predictions of the powheg event generator with pythia8, as well as with herwig++, are also shown. The ratios of simulations to the measurements are shown in the bottom panel of each plot. The powheg + pythia8 predictions describe the measurements within 10% at centre-of mass energies of 1.96 TeV and 7 TeV, and within 5% at 13 TeV. The combination of powheg and herwig++ describes the measurements within 10–15%, 10–20%, and 20–40% at a centre-of-mass energy of 13 TeV, 7 TeV, and 1.96 TeV respectively.
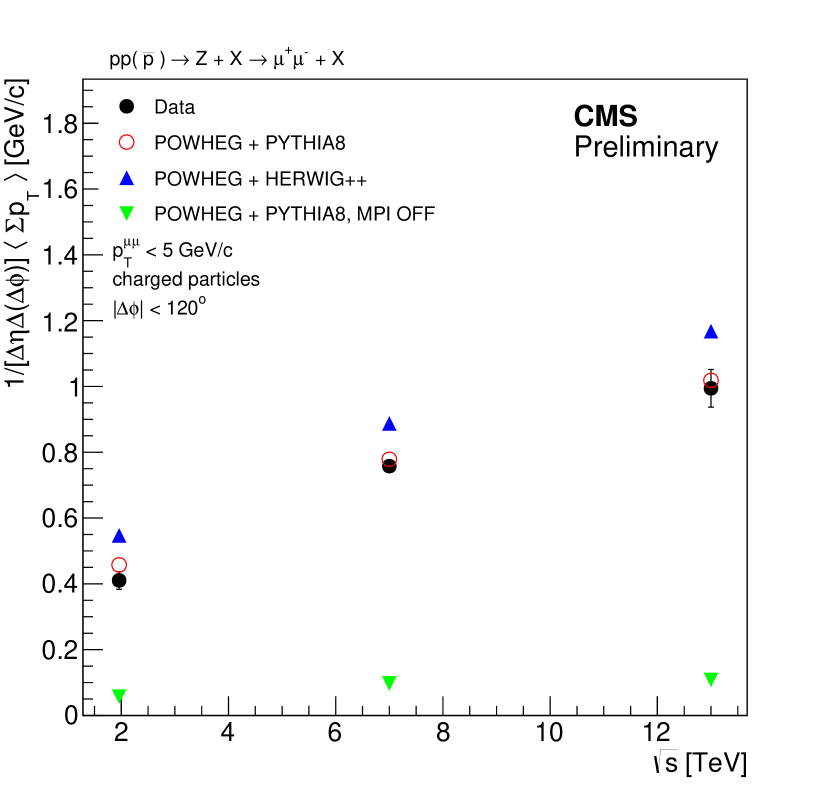
To quantify the energy dependence of the UE activity, events with a smaller than 5 GeV are considered. An upper cut on reduces the radiation contribution and the resulting UE activity comes mainly from MPI. With a requirement of 5 GeV, the UE activity is similar in the towards and transverse regions. Therefore, the UE activity is combined in these two regions. Figure 4 shows the UE activity, after an upper cut of 5 GeV on , as a function of the centre-of-mass energy for data and the simulated samples. The predictions from powheg + pythia8, without MPI, are also shown. It is clear from the comparison of the distributions, with and without MPI, that there is very small contribution from radiation, which increases very slowly with centre-of-mass energy. The energy evolution is better described by powheg events hadronized with pythia8, whereas hadronization with herwig++ overestimates the UE activity at all energies.
4 Summary
Measurements of underlying event activity at 13 TeV using events with inclusive Z bosons and leading jets/tracks at 13 TeV are presented. There is scope of further improvements in the underlying event modeling, especially in the energy dependence. The present measurements, in combination with previous results, will be important for further optimization of the model parameters in various simulations.
References
- [1] G. D’Agostini, “A multidimensional unfolding method based on Bayes’ theorem”, Nucl. Instrum. Meth. A, vol. 362, p. 487, 1995.
- [2] CDF Collaboration,“Studying the Underlying Event in Drell-Yan and High Transverse Momentum Jet Production at the Tevatron”, Phys. Rev. D 82, 034001 (2010)
- [3] CMS Collaboration,“Measurement of the underlying event in the Drell-Yan process in proton-proton collisions at TeV”, Eur. Phys. J. C 72, 2080 (2012)
- [4] CMS Collaboration,“Underlying Event Measurements with Leading Particles and Jets in pp collisions at ”, \urlhttps://cds.cern.ch/record/2104473, CMS-PAS-FSQ-15-007, 2015.
- [5] CMS Collaboration, “Measurement of the underlying event using the Drell-Yan process in proton-proton collisions at ”, \urlhttp://cds.cern.ch/record/2238518, CMS-PAS-FSQ-16-008, 2016.
- [6] CMS Collaboration, “The CMS experiment at the CERN LHC”, JINST, vol. 3, p. S08004, 2008.