Subsequent Nonthermal Emission due to the Kilonova Ejecta in GW 170817
Abstract
The ejected material at the binary neutron star merger GW 170817 was confirmed as a kilonova by UV, optical, and IR observations. This event provides a unique opportunity to investigate the particle acceleration at a mildly relativistic shock propagating in the circumbinary medium. In this paper, we simulate the nonthermal emission from electrons accelerated by the shock induced by the kilonova ejecta with a time-dependent method. The initial velocity and mass of the ejecta in the simulations are obtained from the kilonova observations in GW 170817. If the ambient density is high enough (), radio, optical/IR, and X-ray signals will be detected in a few years, though the off-axis short gamma-ray burst models, accounting for the X-ray/radio counterpart detected at days after the merger, implies low ambient density. We also demonstrate that the additional low-mass () component with a velocity of – can reproduce the early X-ray/radio counterpart. This alternative model allows a favorably high density to detect the nonthermal emission due to the kilonova ejecta. Even for a low ambient density such as , depending on the microscopic parameters for the electron acceleration, we can expect a growth of radio flux of mJy in a few years.
Subject headings:
binaries: close — gamma-ray burst: individual (GRB 170817A) — gravitational waves — radiation mechanisms: nonthermalInstitute for Cosmic Ray Research, The University of Tokyo, 5-1-5 Kashiwanoha, Kashiwa, Chiba 277-8582, Japan; tosho@icrr.u-tokyo.ac.jp, asanok@icrr.u-tokyo.ac.jp
1. Introduction
The binary neutron star merger detected as gravitational-wave event GW 170817 by the Advanced LIGO and Virgo (Abbott et al., 2017c) accompanied a weak short gamma-ray burst, GRB 170817A (Abbott et al., 2017b). Furthermore, follow-up observations with UV, optical, and infrared telescopes found a kilonova (Abbott et al., 2017a; Arcavi et al., 2017; Coulter et al., 2017; Cowperthwaite et al., 2017; Smartt et al., 2017; Tanaka et al., 2017; Valenti et al., 2017) emitting from the mildly relativistic ejecta (Lattimer & Schramm, 1974; Rosswog et al., 1999; Hotokezaka et al., 2013) as expected in advance (Li & Paczyński, 1998; Metzger et al., 2010; Tanaka & Hotokezaka, 2013). The ejected material will form a shock propagating in the circumbinary medium (CBM), and electromagnetic signals on a timescale of a few years have been predicted (Nakar & Piran, 2011; Piran et al., 2013; Rosswog et al., 2013; Takami et al., 2014; Hotokezaka & Piran, 2015; Hotokezaka et al., 2016). Electrons are accelerated at the shock and emit nonthermal synchrotron photons from the radio to X-ray range, which is the mildly relativistic counterpart to the emission from the supernova remnant (nonrelativistic) or the gamma-ray burst (GRB) afterglow (ultrarelativistic). Hereafter we call this possible phenomenon “kilonova afterglow,” while the previous studies focused mainly on radio emission.
GW 170817 is well localized, and its distance ( Mpc; Im et al., 2017) is exceptionally close. The physical properties of the ejecta are also well constrained by the kilonova observations. Therefore, this is a golden opportunity to verify whether electrons are efficiently accelerated even in mildly relativistic cases as seen in ultrarelativistic shocks of GRB afterglows. In the late phase of the GRB afterglow, the shock speed may be mildly relativistic. However, the radio emission at this stage may be dominated by the emission from the remnant electrons accelerated at the relativistic stage.
The flux of the kilonova afterglow largely depends on the CBM density . In the context of the off-axis GRB afterglow model, the X-ray and radio counterparts of GW 170817 at days after the merger (Alexander et al., 2017; Margutti et al., 2017; Troja et al., 2017) imply a low CBM density of (see also Ioka & Nakamura, 2017). In those models, the late detection of the afterglow is explained by the expansion of the beamed emission cone due to the deceleration. Since a highly relativistic ejecta as implied for typical short GRBs rapidly decelerates, a too-high CBM density results in a too-early onset of the off-axis afterglow. The low density in the off-axis GRB models leads to a very dim flux of the emission from the shocked CBM.
On the other hand, alternative models for the X-ray and radio counterparts have been proposed (e.g. Bromberg et al., 2017; Gottlieb et al., 2017; Kasliwal et al., 2017; Murguia-Berthier et al., 2017). In those models, the emission is due to the mildly relativistic ejecta such as a cocoon or a wide jet. The subsequent rising of the radio and X-ray fluxes as far as days (Mooley et al., 2017; Ruan et al., 2017) further supports the mildly relativistic scenario, in which the onset time of the radio and X-ray emission can agree with the deceleration time of the ejecta by adjusting the initial velocity even with a high CBM density. Although a model with a highly relativistic jet can still reconcile the rising light curves (Lazzati et al., 2017), a very low CBM density () is required to suppress the emission from the ultrarelativistic jet. To confirm the consistency of the off-axis GRB model, future follow-up observations are indispensable.
In this paper, we simulate the kilonova afterglow emission from the shocked CBM with parameter sets constrained by the observations of GW 170817. The evolution of the spectrum and light curves of radio, optical/IR, and X-ray are shown. In the most optimistic case, the radio–X-ray emission will be detected within days after the merger. This is also the first demonstration of the mildly relativistic calculation of our time-dependent numerical code in Fukushima et al. (2017). Another purpose of this paper is to show significant differences in the flux and its evolution between the simple analytic approximation and the numerical simulation following the evolution of the electron energy distribution.
In Section 2, we shortly review our computing method in Fukushima et al. (2017) and show model parameters. The radio, IR/optical, and X-ray light curves obtained from our code are shown in Section 3. Only for a high CBM density case, we expect detections of the kilonova afterglow in a few years. However, in Section 4, we demonstrate that the early X-ray and radio counterparts are explained by another shock component propagating a high CBM density. This alternative model encourages us to search for the kilonova afterglow. The conclusions are summarized in Section 5.
2. Model and Method
We adopt the time-dependent numerical code developed in Fukushima et al. (2017). Our one-zone code can follow the propagation of the spherical shocked shell even for the mildly relativistic speed with the exact shock jump condition. The electron and photon energy distributions in the shell are also calculated taking into account the injection of the nonthermal electrons, radiative cooling, adiabatic cooling, synchrotron self-absorption, and photon escape. The energy and arrival time of photons escaped from the entire shell surface are consistently transformed into those for an observer with the effects of the curvature and relativistic motion of the shell.
We adopt the conventional form of the electron spectrum at the injection: the single power law with a minimum Lorentz factor and high-energy exponential cutoff. Given the shock speed, is calculated with the exact jump condition and standard microscopic parameters for the nonthermal electrons: the energy fraction , number fraction , and power law index (see Fukushima et al., 2017, for details). The evolution of the magnetic field is obtained with the parameter , which is the energy fraction of the magnetic field to the dissipated energy at the shock. The electron maximum energy is calculated considering the balance of the acceleration and radiative cooling with the acceleration time scale , where is the velocity of the shock front in the CBM frame, and is the Larmor radius of the particle..
As shown in Fukushima et al. (2017), the exact evolutions of the shock speed and electron energy distribution lead to earlier peak time of the flux than the analytical formula. The adiabatic cooling significantly affects the electron energy distribution and resultant photon spectrum. The spectral peak flux at the cooling frequency is suppressed compared to the flux obtained with the broken power law approximation (see also Petropoulou & Mastichiadis, 2009; Pennanen et al., 2014; Uhm & Zhang, 2014). The analytical approximation may be optimistic to discuss the detectability of the kilonova afterglow. To discuss the uncertainty of the parameters from observation, the comparison with the numerical results is useful.
The mass and velocity of the ejecta are constrained by the kilonova observations. Here, we refer to the two-component model in Cowperthwaite et al. (2017): fast component (mass and velocity ) and slow component ( and ). The model implies a total mass of and kinetic energy of erg, which seems close to the highest value estimated in the numerical simulations (Hotokezaka et al., 2013). If the two components are distinctly decoupled, the slow ejecta will not catch up with the fast ejecta before the start of its deceleration. In this case, we can neglect the contribution of the slow ejecta to the shock dynamics in the early stage. Hereafter, we consider two cases: (1) only the fast ejecta is taken into account (decoupled case), and (2) the two components are well mixed so that the average velocity is adopted as the initial velocity for the mixed single ejecta (mixed case). In the mixed case, we adopt as the initial velocity for the ejecta of .
| Model | () | Ejecta | ||
|---|---|---|---|---|
| A | Decoupled | |||
| A’ | Decoupled | |||
| B | Decoupled | |||
| B’ | Mixed | |||
| C | Decoupled | |||
| C’ | Decoupled |
Then, the remaining model parameters are the CBM density and the microscopic parameters , , , and . Here, we fix the index as 2.3, which is the typical value in the GRB afterglow. The parameter is optimistically taken as . We summarize the parameters in Table 1 for each model. Basically, we focus on the cases of (all electrons are accelerated) and with the decoupled ejecta assumption, but we discuss the cases changing those parameters (model name with prime mark) as well.
3. Light Curves
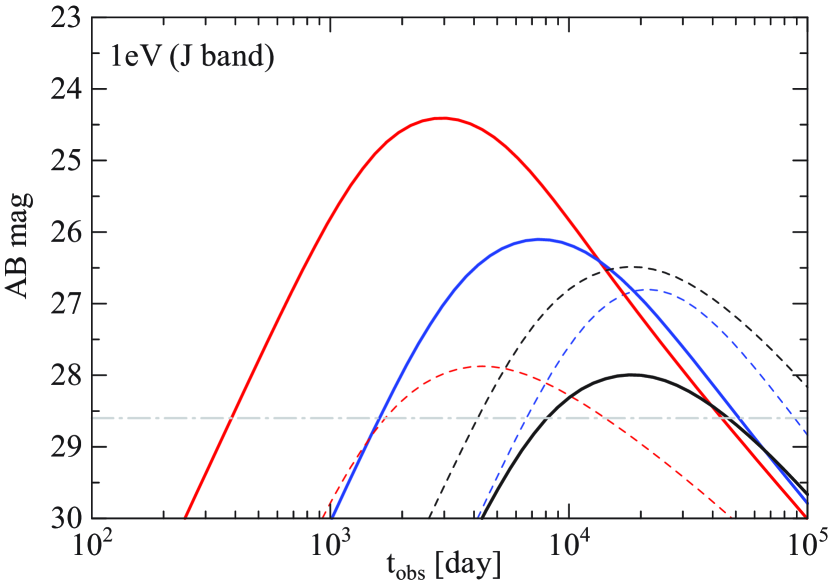
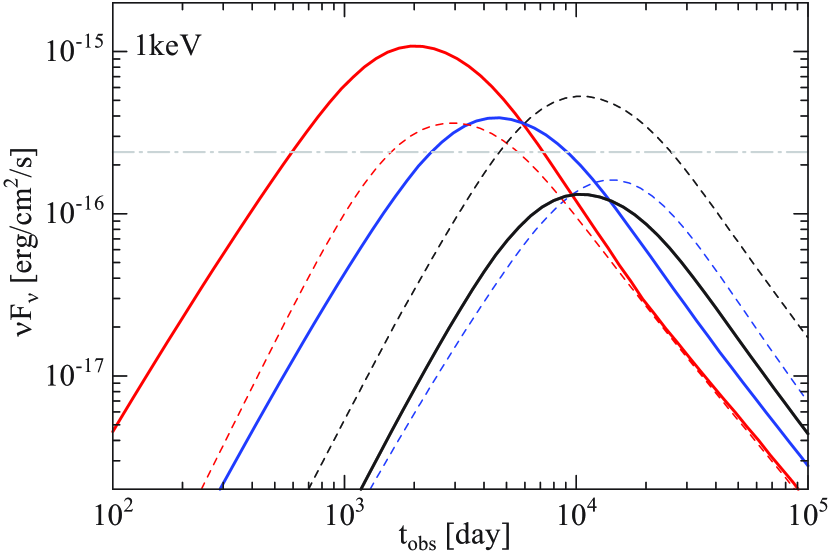
Figures 1–3 show the radio (1.4 GHz), IR ( band), and X-ray (1 keV) light curves, respectively. The peak time roughly corresponds to the onset of the shock deceleration. Note that after the peak time the slow ejecta may contribute to the shock dynamics for the decoupled models. In such a case, the flux decay can be shallower after the peak time. As the density decreases (see solid lines from models A to C), the peak time is delayed, and the peak flux is suppressed (Nakar & Piran, 2011). The analytical formula in Piran et al. (2013) provides the peak time
| (1) | |||||
| (2) |
where the ejecta mass , , and the initial velocity . In the numerical results, the peak time slightly shifts earlier for a higher frequency. In model A, the peak time in X-ray is days, while those for band and radio are and days, respectively. From the analytical formula, we obtain a peak flux of mJy at 1.4GHz for model A, which is brighter than the result in Figure 1. The cooling break energy at the peak time is analytically obtained as eV for model A (Takami et al., 2014). Then, the peak fluxes are estimated as 22.4 mag at band and at 1 keV, respectively.
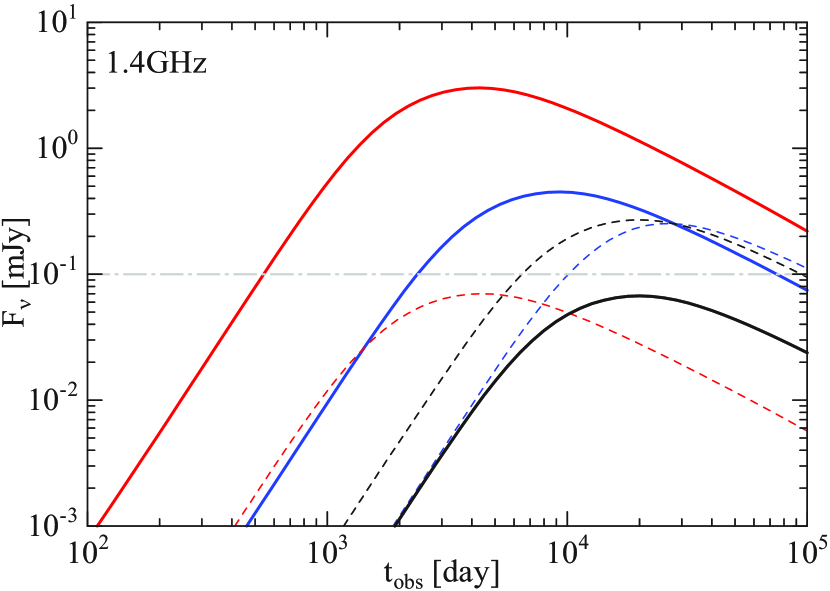
If we seriously accept the limit on the CBM density by the off-axis GRB model (Ioka & Nakamura, 2017; Margutti et al., 2017) based on the X-ray counterparts at days after the merger, only model C (and C’) is within the allowed parameter space. However, the fluxes in model C seem too dim to detect in a few years at any wavelength in spite of its close distance and large energy.
If the density is higher than the model constraint, the radio, IR/optical, and X-ray fluxes can be as high as current instruments can detect as shown in Figures 1–3. Especially in the most optimistic model A, the radio flux grows as mJy at days and Jy at 1 yr. The IR/optical flux becomes brighter than 26 in AB magnitude at days. The X-ray flux also reaches the detectable level () at days.
A smaller value of suppresses the synchrotron flux as shown in the light curves of model A’. However, in the X-ray energy band, where the radiative cooling effect is significant, the flux suppression due to low is not so prominent compared to those in the other bands. The X-ray peak flux in model A’ is comparable to that in the high- case (model A).
In the mixed ejecta case, the suppression of the initial velocity extends the peak time. As a result, the flux at the early stage is drastically suppressed (compare model B with model B’ in Figures 1–3), though the total kinetic energy is larger than that in the decoupled case. The mixed ejecta is a pessimistic assumption to detect the kilonova afterglow.
If the number fraction of the accelerated electrons is lower than unity, the average electron energy is boosted, which implies higher emissivity. Even for , the model with (model C’) leads to detectable fluxes at their peak time, yr. Even at days, the radio flux can be Jy for , which is encouraging for the follow-up observation.
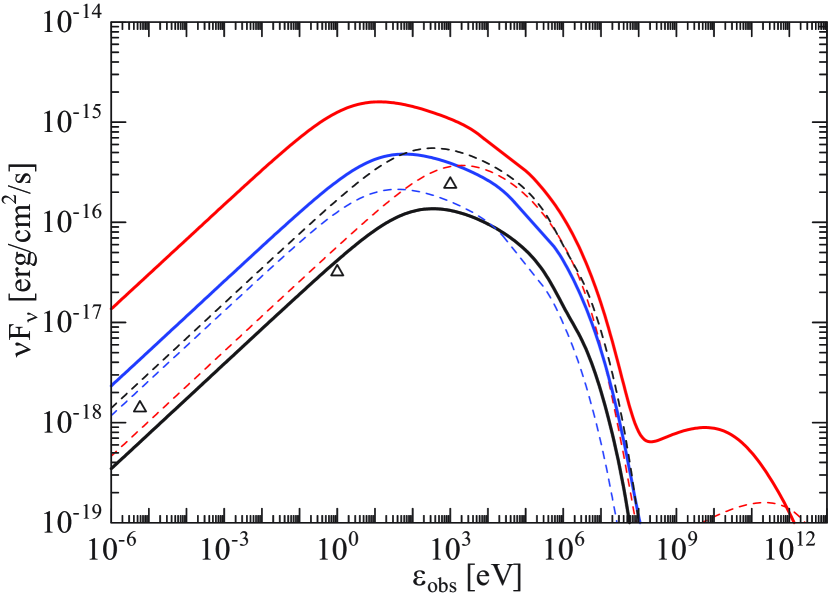
The photon spectra at the X-ray peak time are summarized in Figure 4. In the radio band, the spectrum is consistent with . The peak energies correspond to the cooling frequency, which is typically in UV or X-ray band. Synchrotron self-Compton emission is expected in GeV–TeV range. However, as shown in the spectra, the flux level is far below the detection limit of the current instruments (Fermi-LAT and MAGIC/H.E.S.S. require flux and , respectively) even at the X-ray peak time.
4. Spherical Model for the Early X-Ray and Radio Emission
As shown in the previous section, the low-density cases () implied from the off-axis GRB models seem discouraging for detecting the kilonova afterglow. However, the off-axis model in Murguia-Berthier et al. (2017) adopts a density of . The spherical/wide-angle cocoon models of Kasliwal et al. (2017); Bromberg et al. (2017); Gottlieb et al. (2017) are alternative options to explaining the low-luminosity GRB in GW 170817. In such models, the early X-ray and radio emissions detected at days are not due to the decelerating relativistic jet, and the constraint for the CBM density may be relaxed. In this section, we assume other ejecta expanding spherically with a faster speed than the kilonova ejecta and try to explain the early X-ray and radio emission for a high-density case with the same numerical method.
| Parameter | Fast | Slow |
|---|---|---|
| CBM density | ||
| Kinetic energy | erg | erg |
| Ejected mass | ||
| Initial velocity | ||
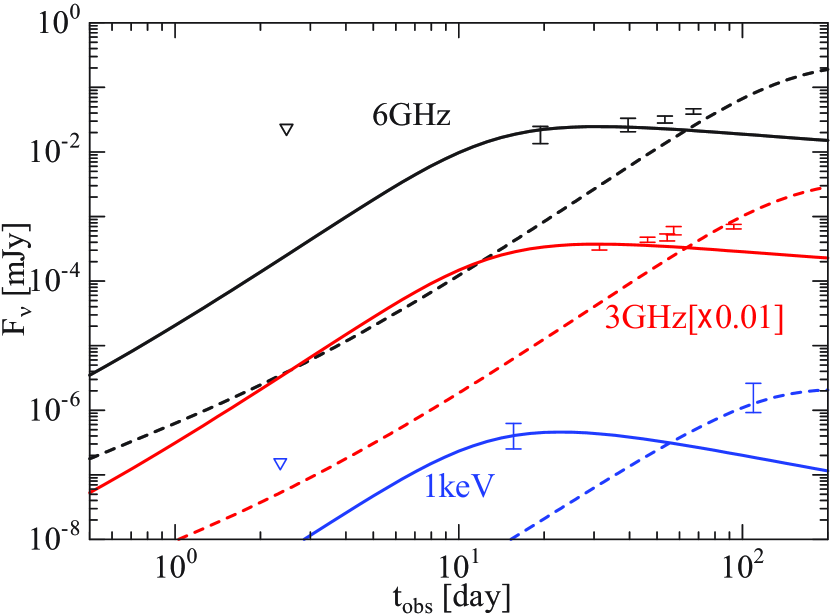
First, we adopt a “fast” ejecta with the initial velocity (; see Table 2 for the other parameters). This agrees with the onsets of the X-ray and radio emission even with a high density of as shown with solid lines in Figure 5. While Murguia-Berthier et al. (2017) also tested a similar model, the initial velocity in our model is significantly slower ( in Murguia-Berthier et al., 2017). The energy scale, mass, and velocity are similar to those in the cocoon model of Bromberg et al. (2017) and the shock-heated ejecta in the model of Kyutoku et al. (2014). Therefore, this low-mass additional component other than the kilonova ejecta is a reasonable assumption.
Mooley et al. (2017) and Ruan et al. (2017) reported the continuous rising of the radio and X-ray light curves as far as days. While Mooley et al. (2017) fitted the radio data by a mildly relativistic ejecta with a power law velocity distribution (), our simple model with a second “slow” component (see Table 2 and dashed lines in Figure 5) also agrees with the observed light curves. Lazzati et al. (2017) claimed that an off-axis GRB model with a structured jet can reconcile the rising light curves with a low density (). The future observation of the kilonova afterglow may determine the CBM density as discussed in the previous section.
The low-mass components discussed in this section may not contribute to the kilonova emission itself, but they generate the delayed emission as shown in Figure 5. In this high-density scnario, the kilonova ejecta will catch up with the low-mass component as it decelerates and generate the kilonova afterglow as shown in model A in Figures 1–3. While the cocoon or wide-jet models have structure as shown in Bromberg et al. (2017), our simple spherical model succeeds in reproducing the light curves. It is difficult to find signatures of the structured ejecta from the light curves, though the structure may affect the parameter estimate.
5. Summary
GW 170817 provides a unique opportunity to verify whether electrons are efficiently accelerated even at a mildly relativistic shock. The early radio and X-ray emission may be due to faster ejecta than the kilonova ejecta, but the interpretation has not been settled. On the other hand, the mass and velocity of the kilonova ejecta are well constrained by the UV/optical/IR observations. We simulate the nonthermal emission emitted from electrons accelerated at the shock propagating in the CBM. If the ambient density is higher than , we can expect detections of radio, optical/IR, and X-ray counterparts in a few years. If the early X-ray and radio counterparts are emitted from the shock produced by the additional low-mass ejecta of – (see also Mooley et al., 2017), such a high-density case can be justified. In this case, the off-axis GRB model with a low CBM density should be reconsidered. Even for , however, optimistic parameter sets with a low lead to a detectable radio flux.
Murase et al. (2017) proposed another type of the delayed electromagnetic counterparts due to the long-lasting activity of the central objects, such as the disk-driven outflows or pulsar winds. The emission timescale in the long-lasting engine model is shorter; typically the flux peaks in a year, differently from the case in the kilonova ejecta model. Future follow-up observations are important to verify such various possibilities.
References
- Abbott et al. (2017a) Abbott, B. P., Abbott, R., Abbott, T. D., et al., 2017a, ApJ, 848, L12
- Abbott et al. (2017b) Abbott, B. P., Abbott, R., Abbott, T. D., et al., 2017b, ApJ, 848, L13
- Abbott et al. (2017c) Abbott, B. P., Abbott, R., Abbott, T. D., et al., 2017c, Phys. Rev. Lett., 119, 161101
- Alexander et al. (2017) Alexander, K. D., Berger, E., Fong, W., et al., 2017, ApJ, 848, L21
- Arcavi et al. (2017) Arcavi, I., Hosseinzadeh, G., Howell, D. A., et al., 2017, Nature, 551, 64
- Bromberg et al. (2017) Bromberg, O., Tchekhovskoy, A., Gottlieb, O., Nakar, E., & Piran, T., 2017, arXiv:1710.05897
- Chandra & Frail (2012) Chandra, P., & Frail, D. A., 2012, ApJ, 746, 156
- Coulter et al. (2017) Coulter, D. A., Foley, R. J., Kilpatrick, C. D., et al., 2017, Sci, 358, 1556
- Cowperthwaite et al. (2017) Cowperthwaite, P. S., Berger, E., Villar, V. A., et al., 2017, ApJ, 848, L17
- Fukushima et al. (2017) Fukushima, T., To, S., Asano, K., & Fujita, Y., 2017, ApJ, 844, 92
- Gottlieb et al. (2017) Gottlieb, O., Nakar, E., Piran, T., & Hotokezaka, K., 2017, arXiv:1710.05896
- Hotokezaka et al. (2013) Hotokezaka, K., Kiuchi, K., Kyutoku, K., et al., 2013, Phys. Rev. D, 87, 024001
- Hotokezaka et al. (2016) Hotokezaka, K., Nissanke, S., Hallinan, G., et al., 2016, ApJ, 831, 190
- Hotokezaka & Piran (2015) Hotokezaka, K., & Piran, T., 2015, MNRAS, 450, 1430
- Im et al. (2017) Im, M., Yoon, Y., Lee, S.-K. J., et al., 2017, ApJ, 849, L16
- Ioka & Nakamura (2017) Ioka, K., & Nakamura, T., 2017, arXiv:1710.05905
- Kasliwal et al. (2017) Kasliwal, M. M., Nakar, E., Singer, L. P., et al., 2017, Sci, 358, 1559
- Kyutoku et al. (2014) Kyutoku, K., Ioka, K., & Shibata, M., 2014, MNRAS, 437, L6
- Lattimer & Schramm (1974) Lattimer, J. M., & Schramm, D. N., 1974, ApJ, 192, L145
- Lazzati et al. (2017) Lazzati, D., Perna, R., Morsony, B. J., López-Cámara, D., Cantiello, M., Ciolfi, R., Giacomazzo, B., & Workman, J. C., 2017, arXiv:1712.03237
- Li & Paczyński (1998) Li, L.-X., & Paczyński, B., 1998, ApJ507, L59
- Margutti et al. (2017) Margutti, R., Berger, E., Fong, W., et al., 2017, ApJ, 848, L20
- Metzger et al. (2010) Metzger, B. D., Martínez-Pinedo, G., Darbha, S., et al., 2010, MNRAS, 406, 2650
- Mooley et al. (2017) Mooley, K. P., Nakar, E., Hotokezaka, K., et al., 2017, arXiv:1711.11573
- Murguia-Berthier et al. (2017) Murguia-Berthier, A., Ramirez-Ruiz, E., Kilpatrick, C. D., et al., 2017, ApJ, 848, L34
- Murase et al. (2017) Murase, K., Toomey, M. W., Fang, K., et al., 2017, arXiv:1710.10757
- Nakar & Piran (2011) Nakar, E., & Piran, T., 2011, Nature, 478, 82
- Pennanen et al. (2014) Pennanen, T., Vurm, I., & Poutanen, J. 2014, A&A, 564, A77
- Petropoulou & Mastichiadis (2009) Petropoulou, M., & Mastichiadis A. 2009, A&A, 507, 599
- Piran et al. (2013) Piran, T., Nakar, E., & Rosswog, S., 2013, MNRAS, 430, 2121
- Rosswog et al. (1999) Rosswog, S., Liebendörfer, M., Thielemann, F.-K., Davies, M. B., Benz, W., & Piran, T., 1999, A&A, 341, 499
- Ruan et al. (2017) Ruan, J. J., Nynka, M., Haggard, D., Kalogera, V., & Evans, P., 2017, arXiv:1712.02809
- Rosswog et al. (2013) Rosswog, S., Piran, T., & Nakar, E., 2013, MNRAS, 430, 2585
- Smartt et al. (2017) Smartt, S. J., Chen, T.-W., Jerkstrand, A., et al., 2017, Nature, 551, 75
- Takami et al. (2014) Takami, H., Kyutoku, K., & Ioka, K., 2014, Phys. Rev. D, 89, 063006
- Tanaka & Hotokezaka (2013) Tanaka, M., & Hotokezaka, K., 2013, ApJ, 775, 113
- Tanaka et al. (2017) Tanaka, M., Utsumi, Y., Mazzali, P. A., et al., 2017, PASJ, 69, 102
- Troja et al. (2017) Troja, E., Piro, L., van Eerten, H., et al., 2017, Nature, 551, 71
- Uhm & Zhang (2014) Uhm, Z. L., & Zhang, B. 2014, ApJ, 780, 82
- Valenti et al. (2017) Valenti, S., Sand, D. J., Yang, S., et al., 2017, ApJ, 848, L24