Nearly isotropic superconductivity in layered Weyl semimetal WTe2 at 98.5 kbar
Abstract
Layered transition metal dichalcogenide WTe2 has recently attracted significant attention due to the discovery of an extremely large magnetoresistance, a predicted type-II Weyl semimetallic state, and the pressure-induced superconducting state. By a careful measurement of the superconducting upper critical fields as a function of the magnetic field angle at a pressure as high as 98.5 kbar, we provide the first detailed examination of the dimensionality of the superconducting condensate in WTe2. Despite the layered crystal structure, the upper critical field exhibits a negligible field anisotropy. The angular dependence of the upper critical field can be satisfactorily described by the anisotropic mass model from 2.2 K () to 0.03 K (), with a practically identical anisotropy factor . The temperature dependence of the upper critical field, determined for both and , can be understood by a conventional orbital depairing mechanism. Comparison of the upper critical fields along the two orthogonal field directions results in the same value of , leading to a temperature independent anisotropy factor from near to . Our findings thus identify WTe2 as a nearly isotropic superconductor, with an anisotropy factor among one of the lowest known in superconducting transition metal dichalcogenides.
The discovery of an extremely large and non-saturating magnetoresistance in semimetallic WTe2 Ali et al. (2014) has generated considerable research efforts Pletikosić et al. (2014); Lv et al. (2015); Cai et al. (2015); Zhu et al. (2015); Xiang et al. (2015); Jiang et al. (2015); Wang et al. (2015, 2016); Wu et al. (2017); Di Sante et al. (2017). The interest is further intensified with the prediction that WTe2 can be a type-II Weyl semimetal, in which Weyl fermions emerge at the border between electron and hole pockets Soluyanov et al. (2015). The crystal structure of WTe2 consists of weakly-bonded block-layers of W-Te atoms along the direction. The layered nature of WTe2 has facilitated the fabrication of devices based on thin layers of WTe2, enabling the application of gate voltage, and hence further exploration of fundamental physical properties in a controllable manner Wang et al. (2015); Na et al. (2016); Yi et al. (2017); Zhang et al. (2017); Fatemi et al. (2017).
Another powerful tool to tune the properties of WTe2 is pressure. With the application of pressure, superconductivity has been successfully induced in the bulk WTe2 Pan et al. (2015); Kang et al. (2015). Although the temperature-pressure phase diagrams reported by two groups Pan et al. (2015); Kang et al. (2015) are quite different, some qualitative similarities can still be observed. First, the superconducting transition temperature () takes a dome-shaped pressure dependence, with a maximum onset between 6.5 K and 7 K. Second, the magnetoresistance is significantly suppressed when the superconducting state sets in. In the work of Pan et al. Pan et al. (2015), superconductivity can be induced with a pressure as low as 25 kbar, which is close to the pressure range where a subtle structural transformation from phase to phase was detected via powder X-ray diffraction and Raman spectroscopy Lu et al. (2016); Zhou et al. (2016). However, these results contradict the study of Kang et al. Kang et al. (2015), which claims that the structure of WTe2 remains the same up to 200 kbar. Despite the disagreement on the high-pressure crystal structure, the layered nature of WTe2 remains valid: the key difference between the phase and phase concerns the distinct coordination of atoms confined within the block-layer.
Given this layered nature, it is reasonable to expect an anisotropic electronic structure. However, detailed analysis of the field angle dependence of the magnetoresistance at ambient pressure reveals a surprisingly low anisotropy Thoutam et al. (2015). If the anisotropy of the magnetoresistance is attributed to Fermi surface anisotropy, the electronic structure of WTe2 is in fact isotropic, consistent with quantum oscillations Zhu et al. (2015); Cai et al. (2015); Wu et al. (2017) and angle-resolved photoemission spectroscopy Wu et al. (2017); Di Sante et al. (2017) data. With the isotropic electronic structure as the backdrop, it is natural to question the dimensionality of the superconducting condensate, which motivates the present study.
The anisotropy of the upper critical field () has provided key insight for understanding the properties of several topical superconducting systems (e.g. Refs. Naughton et al. (1988); Goh et al. (2012); Shimozawa et al. (2014); Mizukami et al. (2011); He et al. (2014); Yonezawa et al. (2017); Bay et al. (2012)). In this manuscript, we report the first angular dependence of in WTe2 at 98.5 kbar, near the pressure where is a maximum (onset K). Additionally, we construct and analyze the complete temperature dependence of for both and . Our datasets allow us to probe the dimensionality of the superconductivity in WTe2 for the first time.
Single crystals of WTe2 used in this work were purchased from 2D Semiconductors. The electrical resistance () measurement was done using a standard four-probe technique on several samples cleaved from the same bulk single crystal. The electrical contacts were made with gold wires and silver paste (Dupont 6838) on freshly cleaved surfaces. Magnetic susceptibility measurement was conducted on a lump of sample consisting of multiple grains using a microcoil system Alireza and Julian (2003); Goh et al. (2008). The high pressure measurements were performed in a miniature Moissanite anvil cell similar to the one employed in Refs. Alireza and Julian (2003); Goh et al. (2008, 2010); Alireza et al. (2017); Klintberg2012 ; Goh2014 ; Yip2017 . The culet diameter of the Moissanite anvils is 0.8 mm, and the pressure achieved was determined by the ruby fluorescence spectroscopy at room temperature. Glycerin was used as the pressure transmitting medium. The low temperature environment down to 2 K was provided by a Physical Property Measurement System (Quantum Design), and mK by a dilution refrigerator (BlueFors Cryogenics). Both systems are equipped with a 14 T superconducting magnet. For the dilution refrigerator, a homemade rotator was used to rotate the Moissanite anvil cell in the field center of the magnet. A small Hall probe (Toshiba THS122) was glued on the anvil cell body to serve as an auxiliary sensor for the field angle.
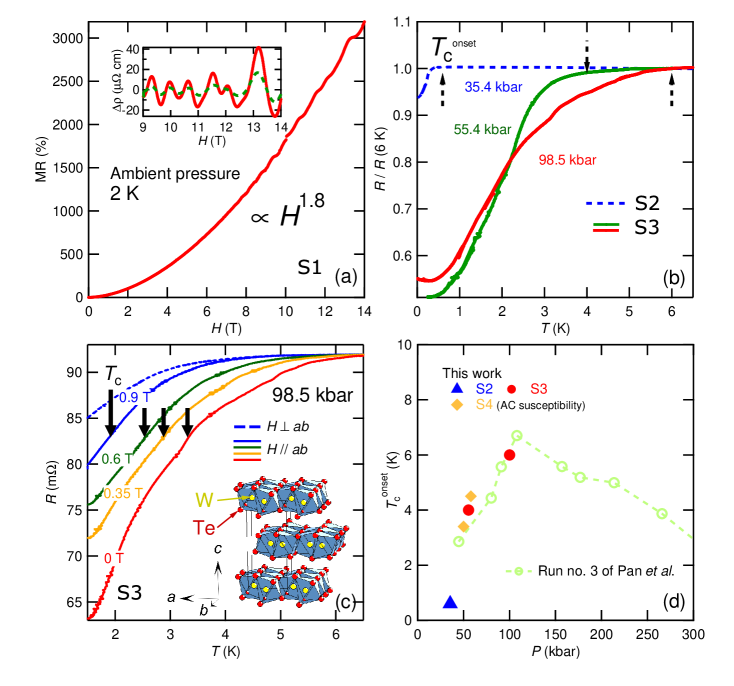
Fig. 1(a) shows the magnetoresistance (MR), defined as , at ambient pressure with in one of the WTe2 samples (S1). The MR follows a nearly quadratic field dependence, and it reaches a magnitude of at 14 T and 2 K. At high field, Shubnikov-de Haas (SdH) quantum oscillations can be seen. In the inset of Fig. 1(a), the smooth background due to the MR is removed so that quantum oscillatory signals at 2 K, and the expected amplitude reduction at a higher temperature, can be more easily observed. At 2 K, Fourier analysis of the data gives three pronounced peaks with SdH frequencies of 97 T, 127 T and 160 T. These results are in good agreement with previous studies Ali et al. (2014); Zhu et al. (2015); Cai et al. (2015); Kang et al. (2015), indicating good sample quality.
At high pressures, a downturn in can be observed at low temperatures (Fig. 1(b)). Here, two samples (S2 and S3), both cleaved from the same bulk crystal as S1, are used for high pressure studies. The onset temperature () for the downturn increases as pressure is increased. At 98.5 kbar, the temperature () dependence of exhibits a clear magnetic field dependence, as shown in Fig. 1(c). With an increasing field, the downturn in shifts to a lower temperature. Furthermore, shows a discernible dependence on the field orientation, as indicated by the top two curves, which were taken with 0.9 T applied perpendicular and parallel to the -plane, respectively. The ambient pressure structure of WTe2 is displayed as an inset of Fig. 1(c), which shows the stacking of layers along the direction. The downturn is suppressed more rapidly when the field is applied perpendicular to the -plane. Additionally, we perform AC susceptibility measurement at 50 kbar and 58 kbar on S4, again cut from the same bulk crystal Not . The susceptibility data unambiguously prove the existence of the diamagnetic shielding due to the superconducting state. In Fig. 1(d), our is plotted against pressure (solid symbols). The high-pressure data of Pan et al. Pan et al. (2015) collected under hydrostatic conditions, determined using the same ‘onset’ criterion, are included for comparison. All these observations suggest that the downturn in is associated with superconductivity, and our data are consistent with that of Pan et al.. The broadening of superconducting transition and the absence of the zero resistance in a similar pressure range has also been observed earlier Pan et al. (2015); Zhou et al. (2016). To proceed with the quantitative analysis of the superconductivity in the absence of the zero resistance, we adopt the ‘90% criterion’ by defining (upper critical field) as the temperature (field) at which the resistance is 90% of the normal state value, as indicated by the arrows in Fig. 1(c) for the case of (additional analyses using the 95% criteria are provided in Not ).
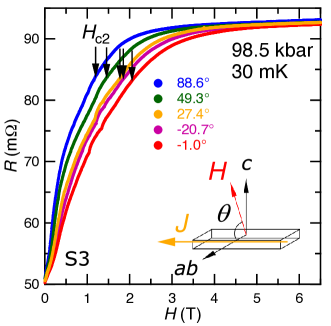
Fig. 2 displays the field dependence of at 30 mK for S3 at 98.5 kbar. With an increasing field, increases and reaches a field independent value at a sufficiently high field. Having established the origin of the downturn in , the field dependence of is naturally attributed to a superconducting-to-normal states transition, with the upper critical fields () indicated by the arrows. We also checked that the contribution from the Hall component to is negligible Not . Therefore, for the determination of , it is sufficient to use the positive field region of only. With the ability to rotate the pressure cell, the magnetic field angle, , can be varied over a large range, covering both () and () (see the schematic drawing in Fig. 2).
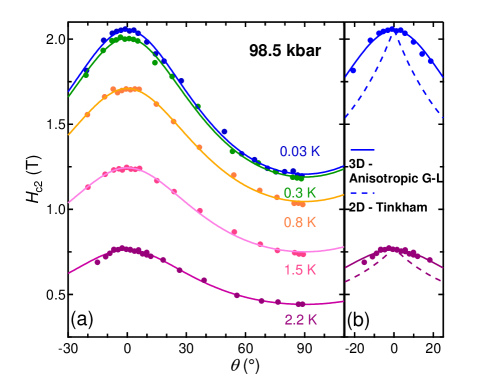
Fig. 3 presents the full angular dependence of the upper critical field, (symbols), over a wide temperature range, from to . The angular dependence of is commonly analyzed using the anisotropic mass Ginzburg-Landau (G-L) model and the Tinkham model Klemm (2012); Tinkham (1996, 1963); Naughton et al. (1988); Mizukami et al. (2011); Goh et al. (2012); Shimozawa et al. (2014), which take the following form:
with corresponds to the Tinkham model, and the anisotropic mass G-L model. Although the Tinkham model was originally developed for thin-films Tinkham (1963), i.e. in the 2D limit, it has been successfully applied to multilayers Goh et al. (2012); Shimozawa et al. (2014), and highly anisotropic bulk superconductors such as Bi2.2Sr1.9CaCu2O8+x Naughton et al. (1988). As dictated by the term associated with the Tinkham model, would show a cusp near . Our data vary smoothly over the entire angular range, with no evidence of a cusp-like variation near . Indeed, the 3D anisotropic mass G-L model successfully describes all the data, as demonstrated in Fig. 3(a). From these fits, an important parameter can be extracted, namely the anisotropy of the upper critical fields : it is practically temperature independent from 0.03 K to 2.2 K, and has a small value of . Fig. 3(b) shows the close-up of representative curves between and +25∘. Using the values of and , the expected described by Tinkham model can be simulated at each temperature. The simulations (dashed lines) clearly fail to capture the angular dependence of . All these results unambiguously point to the 3D nature of superconductivity in WTe2.
Much can be learnt by following the temperature dependence of . With the field directions carefully aligned along and , the field-temperature phase diagram of WTe2 at 98.5 kbar is constructed and plotted in Fig. 4(a). The datapoints with horizontal error bars are obtained from temperature sweeps while those with vertical error bars are obtained from field sweeps, following the same 90% criterion described earlier. The critical values, determined from both the field and temperature sweeps, exhibit an overall smooth variation. Due to the relatively low and the availability of low temperatures, for parallel and perpendicular field directions are fully determined. The anisotropy factor can be evaluated directly, shown as the open circles in the inset of Fig. 4(a) for several temperatures. is found to be temperature independent, and the values are in excellent agreement with the values obtained via the full fitting of in the framework of the 3D anisotropic mass G-L model (c.f. closed circles in the same figure). This is in stark contrast to cases where exhibits a strong divergence near , as observed in some 2D systems Mizukami et al. (2011); He et al. (2014).
Near , increases linearly on cooling for both field directions, in accordance with a conventional orbital depairing behaviour. The initial slope (d/d) is T/K and T/K, for and , respectively. Note that the ratio of the slopes is 1.74, as expected. Both curves can be phenomenologically described by , where (dashed lines in Fig. 4(a)). This suggests that the curves can be scaled onto each other using , or equivalently, the ratio of the initial slopes. Hence, the plot of d/d)t=1 against should give a universal curve. This is indeed observed, as evidenced in Fig. 4(b), indicating that the same depairing mechanism is active for both field orientations.
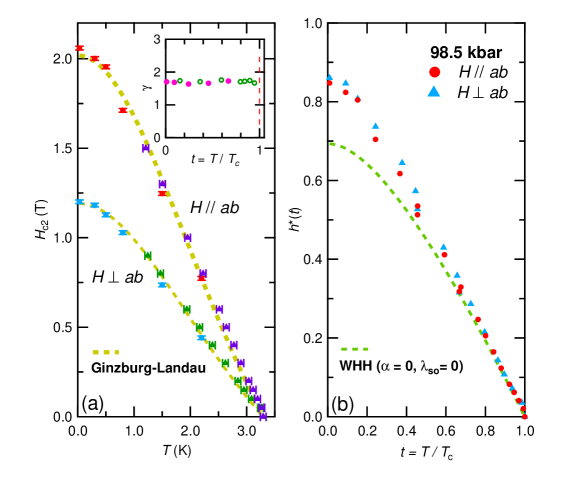
The Werthamer-Helfand-Hohenberg (WHH) theory Werthamer et al. (1966) is commonly applied to understand the temperature dependence of . The full temperature dependence of , simulated using the WHH theory for a single-band superconductor in the dirty limit, is included as the dashed line in Fig. 4(b). The spin paramagnetic effect is neglected because the Pauli field estimated via [T] is 6 T, far exceeds the measured in all field directions. Although the WHH theory successfully captures the variation of the upper critical field near , it fails to describe the low temperature behaviour: the experimental for both field directions are clearly larger than the expected WHH value of 0.69. In the clean limit, Helfand and Werthamer (1966). Such a deviation from the WHH theory could be explained by, for example, a multiband effect Gurevich (2007); Hunte et al. (2008). To conclusively settle this issue, additional microscopic data at this pressure range are highly desirable.
is 1.20 T and 2.06 T for and , respectively. These values translate to an in-plane coherence length nm, and an out-of-plane coherence length nm at the zero temperature limit. The unit cell of WTe2 contains two block layers separated by a distance , stacked along the direction (c.f. inset of Fig. 1c). High pressure X-ray diffraction measurement shows that the lattice constant decreases monotonically from the ambient pressure value of nm Kang et al. (2015). Therefore, at 98.5 kbar, we can confidently conclude that . Thus, superconductivity is not confined within the block layer but rather it exhibits a non-negligible 3D character.
We now compare WTe2 with other well-known layered superconductors. In bulk Bi2.2Sr1.9CaCu2O8+x, in which has been demonstrated to follow the 2D Tinkham-like behaviour, near is at least 40 Naughton et al. (1988). On the contrary, in bulk YBa2Cu3O7, which has been shown to follow the 3D anisotropic mass G-L model, is Naughton et al. (1988). In other well-known transition metal dichalcogenides with governed by the 3D anisotropic mass G-L model, 2-NbS2 has Onabe et al. (1978), 2-NbSe2 has Toyota et al. (1976); Muto et al. (1977). Therefore, is surprisingly small for a layered superconductor in which the constituent layers can be easily exfoliated from the bulk crystal, making WTe2 a superconductor with one of the lowest among known superconducting transition metal dichalcogenides.
The anisotropy of the Fermi surface is directly reflected by . At ambient pressure, the electronic structure is isotropic with small Fermi pockets, consistent with the semimetallic nature of WTe2 Ali et al. (2014); Pletikosić et al. (2014); Lv et al. (2015); Cai et al. (2015); Zhu et al. (2015); Lu et al. (2016); Wu et al. (2017). High-pressure Shubnikov-de Haas data up to 20 kbar detected an expansion of the Fermi pockets with increasing pressure Cai et al. (2015). The expansion is consistent with the general trend predicted by bandstructure calculations Pan et al. (2015); Lu et al. (2016). Crucially, bandstructure calculations find that these expanded pockets eventually touch the Brillouin zone boundary normal to the axis, and consequently the electronic structure acquires a substantial 2D character under pressure. According to the calculations of Lu et al. Lu et al. (2016), at 100 kbar, the electron-like Fermi surface sheet centered at has the shape of a large oval cylinder with as its axis. Although it is tricky to definitively correlate the measured with the Fermi surface anisotropy of a multiband system, this Fermi surface sheet is not compatible with the observed low anisotropy factor. Thus, our work places strict constraints on the topography of Fermi surfaces, and potentially the detailed variation of the superconducting gap function, which can support superconductivity in WTe2.
In summary, we have conducted a complete upper critical field study of WTe2 at 98.5 kbar, where is near the maximum of the dome. The angular dependence of at all temperatures studied can be described by the 3D anisotropic mass Ginzburg-Landau model with a low anisotropy factor of . The temperature dependence of , determined for both and , can be understood by a conventional orbital depairing mechanism. The anisotropy factor, calculated directly from the ratio of along the two orthogonal field directions, results in the same value of , leading to a temperature independent anisotropy factor from near to . The measured anisotropy factor places quantitative constraints on details of Fermi surfaces and the superconducting gap function. The coherence length along the direction is much larger than the lattice parameter along the same direction. All these observations lead to the central conclusion that the pressure-induced superconductivity in layered WTe2 is nearly isotropic. On the technical side, the successful integration of the magnetic field angle with well-established extreme experimental conditions opens up a new avenue for the study of low-dimensional materials.
Acknowledgements.
The authors acknowledge Mike Sutherland, Jian Sun, and Shingo Yonezawa for helpful discussions. This work was supported by Research Grant Council of Hong Kong (ECS/24300214, GRF/14301316), CUHK Direct Grant (No. 3132719, No. 3132720), CUHK Startup (No. 4930048) and National Natural Science Foundation of China (No. 11504310).References
- Ali et al. (2014) M. N. Ali, J. Xiong, S. Flynn, J. Tao, Q. D. Gibson, L. M. Schoop, T. Liang, N. Haldolaarachchige, M. Hirschberger, N. P. Ong, et al., Nature 514, 205 (2014).
- Pletikosić et al. (2014) I. Pletikosić, M. N. Ali, A. V. Fedorov, R. J. Cava, and T. Valla, Phys. Rev. Lett. 113, 216601 (2014).
- Lv et al. (2015) H. Y. Lv, W. J. Lu, D. F. Shao, Y. Liu, S. G. Tan, and Y. P. Sun, Europhys. Lett. 110, 37004 (2015).
- Cai et al. (2015) P. L. Cai, J. Hu, L. P. He, J. Pan, X. C. Hong, Z. Zhang, J. Zhang, J. Wei, Z. Q. Mao, and S. Y. Li, Phys. Rev. Lett. 115, 057202 (2015).
- Zhu et al. (2015) Z. Zhu, X. Lin, J. Liu, B. Fauqué, Q. Tao, C. Yang, Y. Shi, and K. Behnia, Phys. Rev. Lett. 114, 176601 (2015).
- Xiang et al. (2015) F.-X. Xiang, M. Veldhorst, S.-X. Dou, and X.-L. Wang, Europhys. Lett. 112, 37009 (2015).
- Jiang et al. (2015) J. Jiang, F. Tang, X. C. Pan, H. M. Liu, X. H. Niu, Y. X. Wang, D. F. Xu, H. F. Yang, B. P. Xie, F. Q. Song, et al., Phys. Rev. Lett. 115, 166601 (2015).
- Wang et al. (2015) Y. L. Wang, L. R. Thoutam, Z. L. Xiao, J. Hu, S. Das, Z. Q. Mao, J. Wei, R. Divan, A. Luican-Mayer, G. W. Crabtree, et al., Phys. Rev. B 92, 180402 (2015).
- Wang et al. (2016) Y. Wang, K. Wang, J. Reutt-Robey, J. Paglione, and M. S. Fuhrer, Phys. Rev. B 93, 121108 (2016).
- Wu et al. (2017) Y. Wu, N. H. Jo, D. Mou, L. Huang, S. L. Bud’ko, P. C. Canfield, and A. Kaminski, Phys. Rev. B 95, 195138 (2017).
- Di Sante et al. (2017) D. Di Sante, P. K. Das, C. Bigi, Z. Ergönenc, N. Gürtler, J. A. Krieger, T. Schmitt, M. N. Ali, G. Rossi, R. Thomale, et al., Phys. Rev. Lett. 119, 026403 (2017).
- Soluyanov et al. (2015) A. A. Soluyanov, D. Gresch, Z. Wang, Q. Wu, M. Troyer, X. Dai, and B. A. Bernevig, Nature 527, 495 (2015).
- Na et al. (2016) J. Na, A. Hoyer, L. Schoop, D. Weber, B. V. Lotsch, M. Burghard, and K. Kern, Nanoscale 8, 18703 (2016).
- Yi et al. (2017) Y. Yi, C. Wu, H. Wang, H. Liu, H. Li, H. Zhang, H. He, and J. Wang, Solid State Commun. 260, 45 (2017).
- Zhang et al. (2017) E. Zhang, R. Chen, C. Huang, J. Yu, K. Zhang, W. Wang, S. Liu, J. Ling, X. Wan, H.-Z. Lu, et al., Nano Lett. 17, 878 (2017).
- Fatemi et al. (2017) V. Fatemi, Q. D. Gibson, K. Watanabe, T. Taniguchi, R. J. Cava, and P. Jarillo-Herrero, Phys. Rev. B 95, 041410 (2017).
- Pan et al. (2015) X.-C. Pan, X. Chen, H. Liu, Y. Feng, Z. Wei, Y. Zhou, Z. Chi, L. Pi, F. Yen, F. Song, et al., Nat. Commun. 6, 7805 (2015).
- Kang et al. (2015) D. Kang, Y. Zhou, W. Yi, C. Yang, J. Guo, Y. Shi, S. Zhang, Z. Wang, C. Zhang, S. Jiang, et al., Nat. Commun. 6, 7804 (2015).
- Lu et al. (2016) P. Lu, J.-S. Kim, J. Yang, H. Gao, J. Wu, D. Shao, B. Li, D. Zhou, J. Sun, D. Akinwande, et al., Phys. Rev. B 94, 224512 (2016).
- Zhou et al. (2016) Y. Zhou, X. Chen, N. Li, R. Zhang, X. Wang, C. An, Y. Zhou, X. Pan, F. Song, B. Wang, et al., AIP Advances 6, 075008 (2016).
- Thoutam et al. (2015) L. R. Thoutam, Y. L. Wang, Z. L. Xiao, S. Das, A. Luican-Mayer, R. Divan, G. W. Crabtree, and W. K. Kwok, Phys. Rev. Lett. 115, 046602 (2015).
- Naughton et al. (1988) M. J. Naughton, R. C. Yu, P. K. Davies, J. E. Fischer, R. V. Chamberlin, Z. Z. Wang, T. W. Jing, N. P. Ong, and P. M. Chaikin, Phys. Rev. B 38, 9280 (1988).
- Goh et al. (2012) S. K. Goh, Y. Mizukami, H. Shishido, D. Watanabe, S. Yasumoto, M. Shimozawa, M. Yamashita, T. Terashima, Y. Yanase, T. Shibauchi, et al., Phys. Rev. Lett. 109, 157006 (2012).
- Shimozawa et al. (2014) M. Shimozawa, S. K. Goh, R. Endo, R. Kobayashi, T. Watashige, Y. Mizukami, H. Ikeda, H. Shishido, Y. Yanase, T. Terashima, et al., Phys. Rev. Lett. 112, 156404 (2014).
- Mizukami et al. (2011) Y. Mizukami, H. Shishido, T. Shibauchi, M. Shimozawa, S. Yasumoto, D. Watanabe, M. Yamashita, H. Ikeda, T. Terashima, H. Kontani, et al., Nat. Phys. 7, 849 (2011).
- He et al. (2014) Q. L. He, H. Liu, M. He, Y. H. Lai, H. He, G. Wang, K. T. Law, R. Lortz, J. Wang, and I. K. Sou, Nat. Commun. 5, 4247 (2014).
- Yonezawa et al. (2017) S. Yonezawa, K. Tajiri, S. Nakata, Y. Nagai, Z. Wang, K. Segawa, Y. Ando, and Y. Maeno, Nat. Phys. 13, 123 (2017).
- Bay et al. (2012) T. V. Bay, T. Naka, Y. K. Huang, H. Luigjes, M. S. Golden, and A. de Visser, Phys. Rev. Lett. 108, 057001 (2012).
- Alireza and Julian (2003) P. L. Alireza and S. R. Julian, Rev. Sci. Instrum. 74, 4728 (2003).
- Goh et al. (2008) S. K. Goh, P. L. Alireza, P. D. A. Mann, A. M. Cumberlidge, C. Bergemann, M. Sutherland, and Y. Maeno, Curr. Appl. Phys. 8, 304 (2008).
- Goh et al. (2010) S. K. Goh, Y. Nakai, K. Ishida, L. E. Klintberg, Y. Ihara, S. Kasahara, T. Shibauchi, Y. Matsuda, and T. Terashima, Phys. Rev. B 82, 094502 (2010).
- Alireza et al. (2017) P. L. Alireza, G. H. Zhang, W. Guo, J. Porras, T. Loew, Y.-T. Hsu, G. G. Lonzarich, M. Le Tacon, B. Keimer, and S. E. Sebastian, Phys. Rev. B 95, 100505 (2017).
- (33) L. E. Klintberg, S. K. Goh, P. L. Alireza, P. J. Saines, D. A. Tompsett, P. W. Logg, J. Yang, B. Chen, K. Yoshimura, and F. M. Grosche, Phys. Rev. Lett. 109, 237008 (2012).
- (34) S. K. Goh, H. C. Chang, P. Reiss, P. L. Alireza, Y. W. Cheung, S. Y. Lau, H. Wang, Q. Mao, J. Yang, M. Fang, F. M. Grosche, and M. L. Sutherland, Phys. Rev. B 90, 201105 (R) (2014).
- (35) K. Y. Yip, Y. C. Chan, Q. Niu, K. Matsuura, Y. Mizukami, S. Kasahara, Y. Matsuda, T. Shibauchi, and S. K. Goh, Phys. Rev. B 96, 020502 (R) (2017).
- (36) See Supplemental Material for (i) additional analysis of a subset of our data with the 95% criterion, (ii) AC susceptiblity data at 50 kbar and 58 kbar, and (iii) data collected at 30 mK and 2.2 K.
- Klemm (2012) R. A. Klemm, Layered Superconductors (Volume 1) (Oxford University Press, 2012).
- Tinkham (1996) M. Tinkham, Introduction to Superconductivity, 2nd ed. (McGraw-Hill, New York, 1996).
- Tinkham (1963) M. Tinkham, Phys. Rev. 129, 2413 (1963).
- Werthamer et al. (1966) N. R. Werthamer, E. Helfand, and P. C. Hohenberg, Phys. Rev. 147, 295 (1966).
- Helfand and Werthamer (1966) E. Helfand and N. R. Werthamer, Phys. Rev. 147, 288 (1966).
- Gurevich (2007) A. Gurevich, Physica C 456, 160 (2007).
- Hunte et al. (2008) F. Hunte, J. Jaroszynski, A. Gurevich, D. C. Larbalestier, R. Jin, A. S. Sefat, M. A. McGuire, B. C. Sales, D. K. Christen, and D. Mandrus, Nature 453, 903 (2008).
- Onabe et al. (1978) K. Onabe, M. Naito, and S. Tanaka, J. Phys. Soc. Jpn. 45, 50 (1978).
- Toyota et al. (1976) N. Toyota, H. Nakatsuji, K. Noto, A. Hoshi, N. Kobayashi, Y. Muto, and Y. Onodera, J. Low Temp. Phys. 25, 485 (1976).
- Muto et al. (1977) Y. Muto, K. Noto, H. Nakatsuji, and N. Toyota, Nuovo Cimento Soc. Ital. Fis. 38B, 503 (1977).