The Physical Properties of Galaxies with Unusually Red Mid-Infrared Colours
Abstract
The goal of this paper is to investigate the physical nature of galaxies in the redshift range that have strong excess emission at mid-IR wavelengths and to determine whether they host a population of accreting black holes that cannot be identified using optical emission lines. We show that at fixed stellar mass and , the distribution of [3.4]-[4.6] m (WISE W1-W2 band) colours is sharply peaked, with a long tail to much redder W1-W2 colours. We introduce a procedure to pull out the red outlier population based on a combination of three stellar population diagnostics. When compared with optically-selected AGN, red outliers are more likely to be found in massive galaxies, and they tend to have lower stellar mass densities, younger stellar ages and higher dust content than optically-selected AGN hosts. They are twice as likely to be detected at radio wavelengths. We examine W1-W2 colour profiles for a subset of the nearest, reddest outliers and find that most are not centrally peaked, indicating that the hot dust emission is spread throughout the galaxy. We find that radio luminosity is the quantity that is most predictive of a redder central W1-W2 colour. Radio-loud galaxies with centrally concentrated hot dust emission are almost always morphologically disturbed, with compact, unresolved emission at 1.4 Ghz. Eighty percent of such systems are identifiable as AGN using optical emission line diagnostics.
keywords:
galaxies:formation; galaxies:ISM; galaxies:star formation; galaxies:active; galaxies:jets1 Introduction
Our understanding of the co-evolution of supermassive black holes and their surrounding host galaxies has benefited greatly over the last 15 years as a result of many large imaging and spectroscopic surveys that have characterized both the emission from matter falling into black holes and from stars and ionized gas in the host galaxy over a wide range in cosmic time (e.g. Kauffmann et al 2003; Ueda et al 2003; Croom et al 2004; Richards et al 2006). A broad theoretical picture has now emerged that the largest black holes in the Universe with masses in excess of are already assembling in quasars at redshifts , and that by the present-day such black holes are found in giant elliptical galaxies located in massive groups or clusters (e.g. Volonteri et al 2003; Granato et al 2004; Hopkins et al 2008). The present-day accretion rates onto black holes in such enviroments are believed to be low, with most of the emitted energy redirected outwards in the form of relativistic jets that emit at radio wavelengths (e.g. Croton et al 2006; Somerville et al 2008; Sijacki et al 2015). These are the FRI radio galaxies that can also be identified optically through their low-ionization emission lines. At the present day, black holes with masses of comparable to the central object in our own Milky Way are still assembling in the bulges of spiral galaxies and these make up the majority of the Seyfert population (Marconi et al 2004; Heckman et al 2004).
The conditions under which black holes are able to form and grow in mass is still a subject of controversy. Prompted by theoretical arguments and simulated scenarios of black hole growth, much attention has focused on the role of galaxy mergers and interactions as a mechanism that can cause gas to lose angular momentum, flow inwards to the very central regions of the galaxy and accrete onto the central supermassive black hole (Heckman et al 1986; Sanders et al 1988; Kauffmann & Haehnelt 2000; Di Matteo, Springel & Hernquist 2005). This mechanism is observed to induce powerful bursts of star formation in galaxy centers (see Sanders & Mirabel 1996 for a review), but the degree to which the black hole will grow under such circumstances is still poorly understood. The amount of growth will likely depend on how much gas is driven out by energetic processes such as supernova or accretion-driven winds.
The so-called Soltan argument (Soltan 1982) relates the energy released in the optical region of the electromagnetic spectrum to the total mass density in supermassive black holes at the present-day, showing that the two are in reasonably good agreement. No clear connection between AGN visible at optical wavelengths and galaxy mergers has been established observationally. Studies that use irregularities in galaxy morphology or the number of close neighbours as a probe show that once the amount of star formation in the host is accounted for, there is no further boost in either of these quantities associated with emission from the central black hole (Li et al 2008; Reichard et al 2009). The same result seems to hold for samples of AGN selected from the largest X-ray imaging surveys (Cisternas et al 2011; Kocevski et al 2012).
Nevertheless, the question still persists as to whether a merger-induced phase of black hole growth may be missing from optical and X-ray samples because it takes place in very dense and dusty environments, causing the emission to be “obscured”. Hard X-ray photons with energies above a few keV travel through dust without significant obscuration. There are now indications that some AGN detected using data from the Nuclear Spectroscopic Telescope Array (NuSTAR) (Harrison et al 2013) in the highest energy 3-24 keV band are not easily identifiable using optical emission line diagnostics (Chen et al 2017). However, such samples are still small and it is not yet possible to address the merger connection.
Another more indirect way to identify an obscured phase of black hole growth is to search for emission from dust that has been heated to extremely high temperatures by radiation from an accreting black hole. The black body spectrum from the atmospheres of stars peaks at 1.6 m. Emission from dust heated by young stars in strongly star-forming galaxies peaks at 60 m in the far-infrared. The mid-infrared is therefore the electromagnetic window of choice for finding systems where dust has been heated by radiation emitted by accreting black holes, which has an spectrum peaked towards shorter wavelengths than the radiation emitted by young stars. Stern et al (2005) introduced a wedge in the space of [3.6]-[4.5] m versus [5.8]-[8.0] m IRAC colours where AGN could be identified. This analysis made use of Spitzer Space Telescope data for 10,000 galaxies that could be separated into AGN and normal galaxies based on their optical emission line properties. Subsequent work by Eckart et al (2010) showed that two thirds of X-ray selected AGN and almost all X-ray AGN with high ionization emission lines were also located in this wedge in mid-IR colour space.
The launch of the Wide-field Infrared Survey Explorer (WISE) satellite in 2009 has provided sensitive photometry of many millions of sources over the entire sky in four mid-IR bands centred at 3.4, 4.6, 12 and 22 m (referred to as W1, W2, W3 and W4). AGN selection using WISE photometry was addressed in Stern et al (2012). As illustrated in figures 1 and 2 of that paper, “pure” AGN (i.e. AGN where no light from the host galaxy is present) can be identified by means of a simple W1-W2 colour cut (W1-W2 0.8) at all redshifts. At redshifts greater than 1.5, the same cut is also able to identify AGN in which the host galaxy contributes up to half the emitted light. Most subsequent studies of high redshift AGN have therefore adopted this simple cut in W1-W2 colour.
Low redshift studies have thus far used optical emission line ratio diagnostics to identify AGN (Rosario et al 2013; Shao et al 2013). More recently, attempts have been made to quantify the location of AGN in WISE mid-IR colour-colour or colour-magnitude space using hard X-ray selected samples (Mateos et al 2012) using the principle that AGN should have red power-law SEDs. Mateos et al show that this approach works well for the highest luminosity AGN, but becomes incomplete at lower luminosities. So far, the question of the physical nature of missing modes of black hole accretion has been addressed very sketchily in the literature.
We note that the methodology discussed above assumes no prior information on the nature of the underlying host galaxy. In this paper we show that the W1-W2 colours of the normal galaxy population are clearly correlated with optical diagnostics of their mean stellar age such as the 4000 Angstrom break index Dn(4000), the H Balmer absorption line strength and the specific star formation rate derived from the extinction-corrected H luminosity. When these correlations are defined using very large galaxy and AGN samples provided by the Sloan Digital Sky Survey, a clear “main sequence” of galaxies is visible in optical/mid-IR correlation plots, as well as tail of outliers to very red colours. It is the physical nature of this population of outliers that forms the main subject matter of this paper.
In section 2, we describe how our sample of nearby galaxies is constructed as well as our technique for selecting the red W1-W2 population. In section 3, we analyze how galaxy properties such as stellar mass, stellar mass surface density, concentration index, specific star formation rate, mean stellar age and radio luminosity at 1.4 GHz compare to AGN selected by optical emission line ratio diagnostics. In section 4, we analyze the structure of the hot dust in these objects. We select a subset of galaxies with the reddest W1-W2 colours and we investigate the extent to which the excess mid-IR emission is centrally peaked, as would be expected if the hot dust is located in a central torus-like structure. In Section 5 we summarize and discuss our results.
2 Sample Construction
We begin with a magnitude-limited sample constructed from the final data release (DR7; Abazajian et al. 2009) of the Sloan Digital Sky Survey (York et al. 2000), which is described in Li et al. (2012). This sample contains 533,731 galaxies located in the main contiguous area of the survey in the northern Galactic cap, with , and spectroscopically measured redshifts in the range . 87,060 of these are classified as optical AGN based on their [OIII]/H versus [NII]/H emission line ratios (Kauffmann et al. 2003). Here is the -band Petrosian apparent magnitude, corrected for Galactic extinction, and is the -band Petrosian absolute magnitude, corrected for evolution and K-corrected to its value at . The apparent magnitude limit is chosen in order to select a sample that is uniform and complete over the entire area of the survey. The median redshift of this sample is , with 10% of the galaxies below z=0.033 and 10% above z=0.16. In this paper, we use galaxy properties available from the MPA/JHU database of spectrum measurements (Brinchmann et al 2004) such as stellar masses and star formation rates (SFRs), as well as optical AGN classifications based on emission line flux measurements.
We cross-correlate this sample with the AllWISE Source Catalog, which contains astrometry and photometry for 747,634,026 objects detected on the deep AllWISE Atlas Intensity Images. The AllWISE program builds upon the work of the successful Wide-field Infrared Survey Explorer mission (WISE; Wright et al. 2010) by combining data from the WISE cryogenic and NEOWISE (Mainzer et al. 2011) post-cryogenic survey phases to form the most comprehensive view of the full mid-infrared sky currently available. As well as total magnitudes in 4 bands: 3.4, 4.6, 12, and 22 m (W1, W2, W3, W4), circular aperture photometry is available for 8 standard annulus radii. For the W1,W2 and W3 bands, the radii are 5.5, 8.25, 11.0, 13.75, 16.5, 19.25, 22 and 24.75 arsec, respectively. We note that the SDSS spectra are obtained through 3 arcsec diameter fibre apertures. When correlating 4000 Å break strengths with mid-IR colours, we use the 5.5 arcsec circular aperture quantities. 533,612 galaxies are detected in both the W1 and W2 bands, i.e. 99.97% of the original sample. The typical error on the W1-W2 colours are a few hundredths of a magnitude, i.e. they are very well measured.
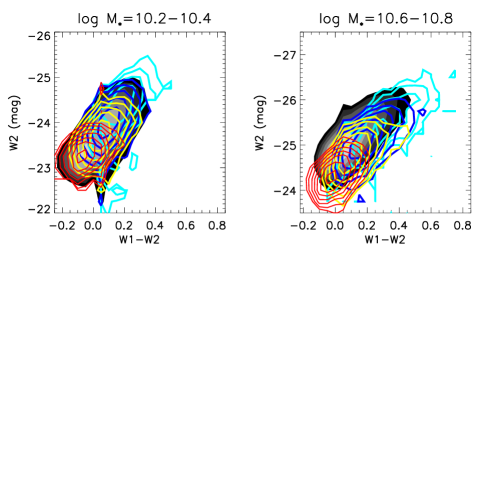
In Figure 1, we plot galaxies in two stellar mass bins in the plane of W1-W2 colour versus W2 magnitude. The greyscale contours indicate the fraction of galaxies in the given bin. To calculate these fractions, we weight each galaxy by where is the survey volume over which the galaxy can be detected. The contours are spaced logarithmically and run from log F =-2.9 (black) to log F =-0.9 (white). We have subdivided each sample into 4 different bins in 4000 Å break strength , which are overplotted as different coloured line contours (red, 1.82.0; yellow, 1.61.8; blue, 1.41.6; cyan, 1.21.4). As can be seen, galaxies occupy a fairly tight locus in the W1-W2 versus W2 plane, with more luminous galaxies exhibiting redder colours. The different Dn(4000) subsamples are arranged in a well-ordered sequence, with galaxies in the lowest Dn(4000) bin with the youngest stellar populations, exhibiting the reddest W1-W2 colours and brightest W2 magnitudes.
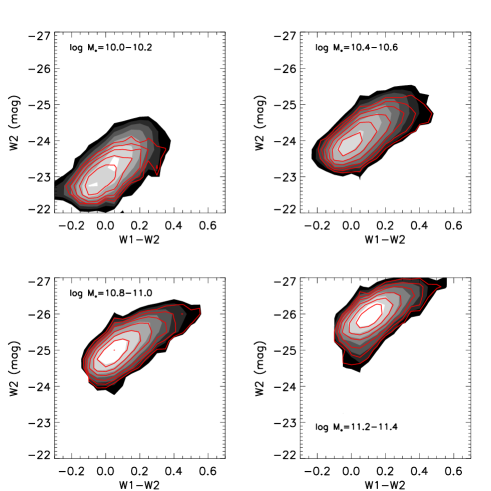
In Figure 2, we overplot the location of optically identified AGN in W1-W2 versus W2 magnitude plane. Results are shown in 4 different bins of stellar mass. AGN have been selected using the cut in the [NII]/H versus [OIII]/H plane given in Kauffmann et al (2003). As can be seen, in the lowest mass bin, optically-selected AGN are biased towards bluer W1-W2 colours and fainter W2 luminosities compared to the sample as a whole. The effect gets smaller at higher stellar masses. As shown in Figure 1, galaxies with redder W1-W2 colours have systematically younger stellar populations. This raises the question whether galaxies with actively accreting black holes are systematically missing from the red part of the W1-W2 versus W2 colour-magnitude plane. To answer this question, we need to develop a method for identifying a subset of galaxies with red W1-W2 colours that are possible AGN candidates.
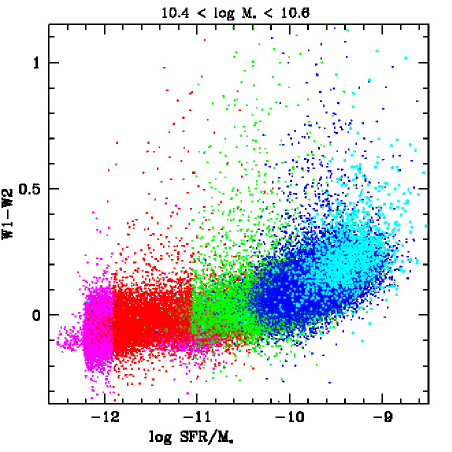
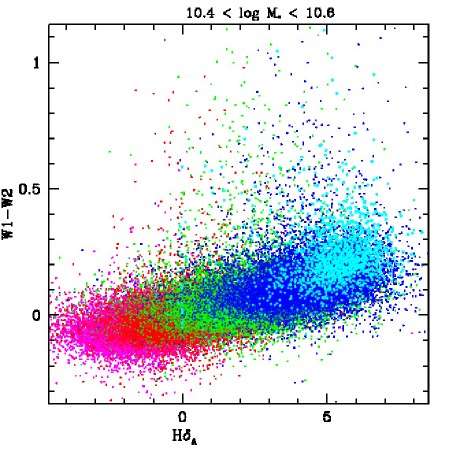
Figures 3 and 4 illustrate our methodology for AGN identification. In Figure 3, we plot W1-W2 as a function of the logarithm of the specific star formation rate (log SFR/M∗) measured within the SDSS fibre aperture for galaxies in a narrow stellar mass range (). The star formation rates are taken from the the MPA/JHU database (see Brinchmann et al (2004) for a detailed description of the methodology). Note that we show only those galaxies for which both the H and H emission lines can be measured with reasonably high signal-to-noise ( in the H line), so that the SFR estimates are based on emission line measurements rather than the 4000 Å break itself. The points have been colour coded according to Dn(4000) value as indicated in the figure caption. The majority of points occupy a narrow locus in the plots, but there is a subset that scatter to much higher W1-W2 values at all values of log SFR. Figure 4 shows a similar plot of W1-W2 as a function of H for galaxies in the same mass range, with galaxies colour-coded the same way. Once again, the same conclusion holds as a function of H. Based on these two figures, we devise a method for identifying red outliers as follows. The most accurately determined star formation rates based on detections of all four of the strongest emission lines (H, [OIII], H and [NII]) are generally available for galaxies with specific star formation rates . For galaxies with lower values of SFR/, one or more of the emission lines are generally not detected and the SFR estimates become increasingly inaccurate. We thus identify outliers in SFR/ versus Dn(4000) space for galaxies with and in H versus Dn(4000) space for galaxies with lower specific star formation rates. We bin up the two planes in intervals of 0.15 in Dn(4000), 0.25 in SFR/ and 0.1 in H and calculate the distribution of W1-W2 colours in each bin. In subsequent plots, we adopt two different definitions for “outliers” corresponding to the upper 95th and 97th percentile points of the distribution.
3 Properties of the red W1-W2 outliers
We restrict our analysis to galaxies in the mass range . Kauffmann et al (2003) show that the fraction of optically selected AGN drops very strongly at stellar masses lower than this. There have been suggestions that “missed” accreting black holes may be present in low mass galaxies from both hard X-ray and mid-IR studies. We will not address this in this paper. Figure 5 compares the distribution of optically-selected AGN (black histograms) and red W1-W2 outliers (red histograms) for a variety of galaxy properties. In the case of the W1-W2 outliers, solid red histograms show results for the 95th percentile outliers, and dotted red histograms for the 97th percentile cases.
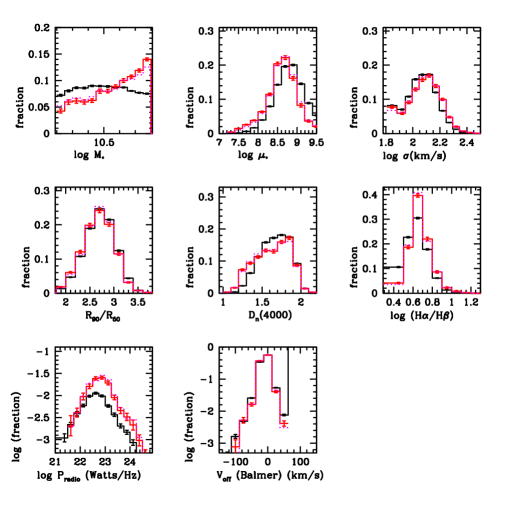
As can be seen, the median stellar masses of the optical AGN and the red outlier samples are similar, but the fraction of red outliers rises as a function of stellar mass, whereas the fraction of optical AGN is independent of stellar mass. Red outliers are shifted towards slightly lower stellar surface densities than optical AGN, but have similar central stellar velocity dispersions and concentration indices. As expected, the W1-W2 outliers have younger stellar populations and higher dust extinctions than the optically selected AGN.
In the bottom left panel we show the fraction of galaxies detected at different radio luminosities, which were obtained by cross-correlating our sample with VLA Faint Images of the Radio Sky at Twenty Centimeters source catalogue (Becker, White & Helfand 1995) using methodology similar to that described in Best et al. (2005). Interestingly, there is a factor 2 difference in radio-loud fraction at radio luminosities greater than Watts Hz-1. We will come back to this result later in the paper. In the bottom right panel, we compare the distribution of shifts in the velocities of the Balmer emission lines with respect to the systemic velocity of the galaxy. These velocity shifts are from the MPA/JHU catalogue of spectrum measurements. We note that during the line-fitting process, all the Balmer lines are fit simultaneously. There is no significant difference between red outliers and optical AGN.
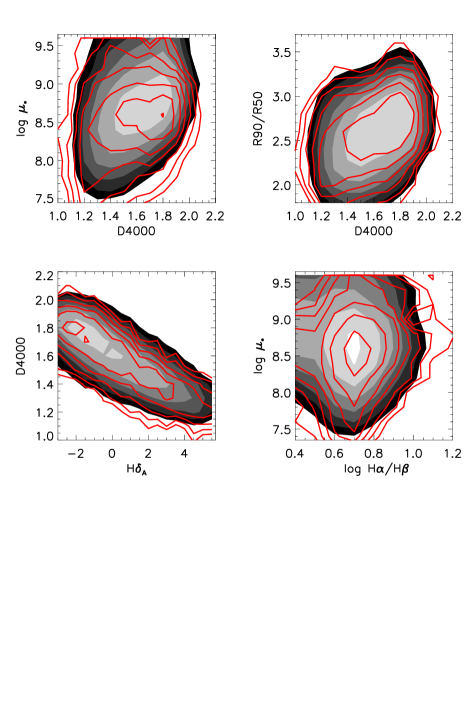
In Figure 6, we compare two dimensional distributions of galaxy properties for the two samples. The greyscale contours show the location of optically selected AGN, while the red contours show the location of the red W1-W2 outliers in the 95th percentile sample. The bottom left panel shows the location of the two populations in the H versus Dn(4000) plane. The top two panels show the relation between Dn(4000) and two structural parameters, the stellar surface mass density and the concentration parameter R90/R50 (R90 and R50 are the radii enclosing 90% and 50% of the -band light from the galaxy). The bottom right panel shows the distribution of Balmer decrement as a function of stellar surface mass density. We see that the red outliers are slightly displaced to lower Dn(4000), higher H and higher H/H values at fixed , indicating that their stellar populations are younger. We note, however, that the differences are bewtween the two samples are not large.
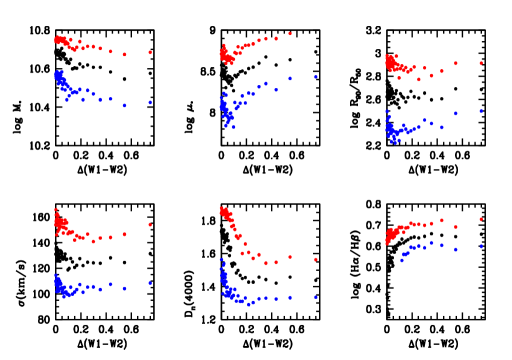
The adoption of the 95th or 97th percentile points as the adopted cut on the red outlier population is something of an arbitrary choice. In Figure 7, we investigate how galaxy properties change as W1-W2 colours become redder. We plot stellar mass, stellar mass density, concentration parameter, velocity dispersion, Dn(4000) and Balmer decrement as a function of the difference between the W1-W2 colour and the colour that delineates the 95th percentile cut. Each plotted point corresponds to a bin containing a fixed number (200) galaxies, so the noise due to Poisson sampling of the underlying distribution remains constant in each diagram. Black points show the median of the distribution, red points the upper 75th percentile of the distribution and blue points the lower 25th percentile. Stellar mass and velocity dispersion decrease as a function of colour difference , the concentration parameter remains roughly constant, and stellar surface density and Balmer decrement increase. The biggest change as a function of (W1-W2) is the drop in Dn(4000). We note that almost all quantities no longer change significantly at (W1-W2) values greater than about 0.15-0.2, suggesting that this delineates the regime where stellar light from the host galaxy no longer contributes significantly to the W1-W2 colour. In the next section, we investigate the nature of this subset of the very reddest outliers in more detail.
4 Physical properties of the red outliers
4.1 Mid-IR colour profiles of the largest nearby red outliers
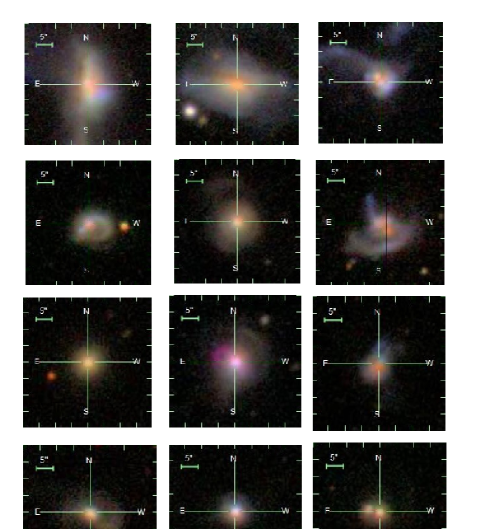
We first investigate spatially resolved W1-W2 colour profiles for a subset of the nearest galaxies in our sample with the reddest W1-W2 colours. Based on the results shown in Figure 7, we select galaxies with , redshifts , and -band Petrosian radii of 10 arcseconds or more. This results in a sample of 19 objects. SDSS cut-out images are shown in Figure 8. As can be seen, most of the galaxies are disk-dominated with red colours. Two out of the 19 appear to be merging systems. One object is an extremely blue irregular galaxy and the light within the central aperture is dominated by a bright star cluster.
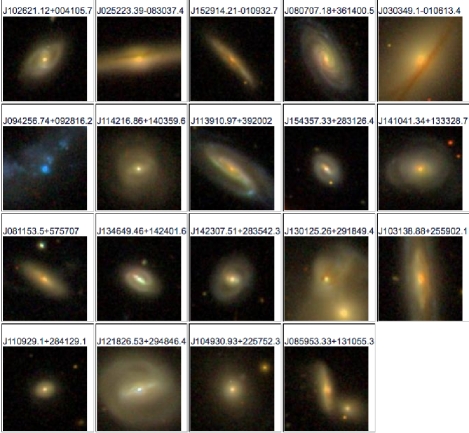

Figure 9 shows W1-W2 colour profiles for the same 19 galaxies shown in Figure 8. The colour plotted are differential colours calculated within rings corresponding to the standard apertures used for WISE photometry, i.e. 0-5.5, 5.5-8.25, 8.25-11.0, 11.0-13.75, 13.75-16.5, 16.5-19.25, 19.25-22 and 22-24.75 arsec. As can be seen, all of the 19 galaxies have reasonably high S/N differential W1-W2 colour measurements over 4 or more standard aperture points i.e. out to at least 13.75 arcsec. We note that the optical radii of these galaxies are at least 2 times the size of the PSF for both the W1 and the W2 bands, so these colour profiles should be minimally affected by the small difference between the W1 and W2 PSF (Wright et al 2010). A W1-W2 colour of 0.8, marking the proposed boundary for “pure” AGN proposed in Stern et al (2013) is shown as a dotted line in each panel. As can be seen, all 19 galaxies have central (5 arcsecond aperture) colours that lie above this cut. As we will discuss in the next section, the central torii of Seyfert galaxies are now known to have physical sizes of a few parcsec. If most of the hot dust emission originates from a central torus, then the W1-W2 colours might be expected to drop as a function of radius. Instead, we see that the W1-W2 colours quite often increase with radius over the first two aperture points, and sometimes remain above 0.8 out to the edge of the galaxy. This implies that if red W1-W2 colours are caused by emission from hot dust, this dust must be spread over large radii (in some cases even out to 10 kpc and beyond). The only galaxy where the W1-W2 colours drop significantly from the central 5.5 arcsec annulus to the second 8.25 arcsec annulus is the very blue irregular galaxy, where the central aperture is clearly centered on the compact star cluster. We thus conclude that even the central aperture mid-IR emission from these galaxies cannot be unambiguously associated with reprocessed radiation from an accretion disk.
4.2 What is the best predictor for centrally peaked emission in the W2 band?
The analysis in the previous subsection of the resolved W1-W2 colour profiles of the largest, most nearby galaxies with very red central colours indicates that centrally peaked W2 emission is quite rare. In this section, we ask whether we are able to locate a galaxy property that can be identified as the best predictor for W1-W2 colours that are centrally peaked.
To do this, we relax our selection criterion to include all galaxies with where the error on the colour difference between the central 5.5 arcsecond and 8.25 arcsecond bins is less than 0.08. his boundary was chosen iteratively to be a compromise bewtween sample size and the accuracy of the colour gradient measurement. We also include all galaxies with central 5.5 arcsec colours that lie above the 95th percentile cut (i.e. this analysis is no longer restricted to the very reddest outliers). This results in a sample of 996 galaxies. In Figure 10 we plot the colour difference as a function of the following properties: stellar mass, central stellar velocity dispersion, stellar surface mass density, Dn(4000), Balmer decrement and radio luminosity. The computed correlation coefficient is indicated at the top of each panel. As can be seen, the colour difference does not correlate with stellar mass or with stellar surface density. It correlates weakly with velocity dispersion, Balmer decrement and Dn(4000). The strongest correlation (by a factor of two) is with radio luminosity.

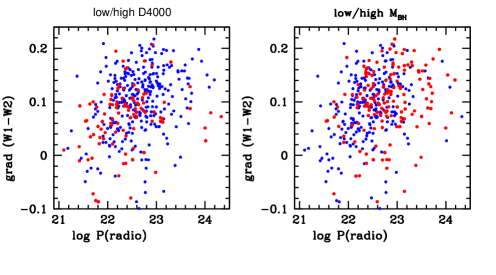
In Figure 11, we colour-code the points in the colour difference versus radio luminosity plane by Dn(4000) (left) and by central velocity dispersion (right). For clarity, only galaxies in the lowest and highest quartiles of the full sample are plotted. Clear separations are seen between the red and blue points in both panels, which indicates that additional parameter dependences in addition to radio luminosity are important in the prediction of the colour gradient. Radio-loud galaxies with old stellar populations have weaker colour gradients than radio loud galaxies with younger stellar populations. This is easily understood if galaxies with low Dn(4000) have ongoing star formation that is spread throughout a disk. More intriguing is the finding shown in the right-hand panel that radio loud galaxies with high central velocity dispersions have stronger W1-W2 colour gradients. We note that central stellar velocity dispersion is often used as a proxy for black hole mass (e.g. Heckman & Kauffmann 2004), because there is a relatively tight correlation between the two quantities in galaxies with black hole masses that are accurately measured using very high resolution stellar kinematical data. We now ask whether the result shown in the right-hand panel of Figure 11 may provide some tentative indication that black hole growth is favoured in the bulges of radio-loud galaxies with centrally peaked mid-IR emission.
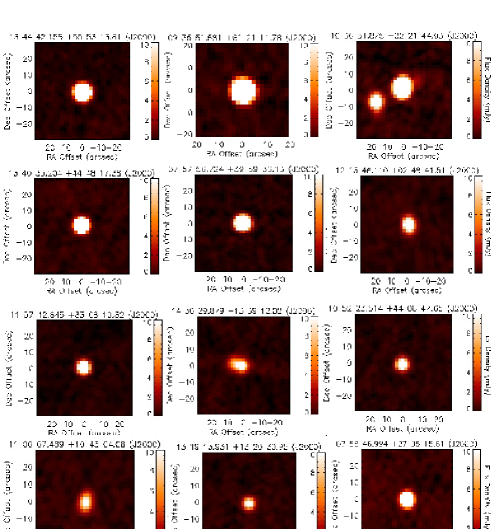
To help answer this question, we investigate the radio and optical morphologies of these systems. Figures 12 and 13 show optical colour and VLA FIRST radio images of a dozen radio-loud galaxies included in the samples plotted in Figures 10 and 11. We have selected galaxies with radio luminosities greater than Watts Hz-1 and we show images of the 12 objects located at the lowest redshifts. The optical images show that nearly all the galaxies are either clear merging systems or disturbed, with asymmetric light profiles, double nuclei, outer shells and tidal arms. The radio emission in all the VLA FIRST cutout-images is unresolved, indicating that the radio emission originates from a compact region at the center of the galaxy. One galaxy (the merging system with clear double nuclei and tidal features in the top right panel) has two radio nuclei. We note that the VLA FIRST images have a resolution of 5 arcseconds and the nearest galaxy in our sample is at a redshift of z=0.037. We are thus unable to identify jets that are smaller than few kpc, so we cannot use the radio images alone to distinguish between a central starburst occurring on bulge scales, and a very compact relativistic jet.
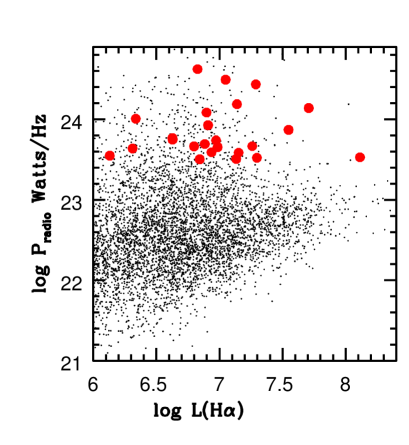
As shown in Figure 1 of Kauffmann, Heckman & Best (2008), Watts Hz-1 marks the boundary in radio luminosity between galaxies classified as star-forming using BPT (Baldwin, Phillips, & Terlevich 1981) emission line diagnostics, and galaxies with LINER or Seyfert-like emission lines. Kauffmann, Heckman & Best (2008) proposed a cut in the plane of radio-luminosity versus extinction corrected H luminosity in order to separate radio-loud AGN from starburst galaxies. In Figure 14, we plot the location of all red outliers with radio luminosities greater than Watts Hz-1 and in the plane of radio luminosity versus extinction corrected H luminosity. For reference, we plot all galaxies from the SDSS main sample with , and which are not classified as AGN in the BPT diagram as black points. As can be seen the radio-loud red outliers all lie well above the main locus occupied by star-forming galaxies. This provides additional support to our hypothesis that black hole growth is occurring in these systems.
5 Summary and Discussion
The main observational findings presented in this paper are the following:
-
1.
At fixed stellar mass , the galaxy population as a whole occupies a tight locus in the plane of W1-W2 colour versus W2 magnitude. We show that the mean age of the stellar population as measured by the 4000 Å break (Dn(4000)) decreases monotonically for redder W1-W2 colours and higher W2 luminosities.
-
2.
Optical AGN identified via BPT emission line ratio diagnostics occupy the region of parameter space with bluer W1-W2 colours and smaller luminosities in the W2 band.
-
3.
At fixed stellar mass and , the distribution of W1-W2 colours of the galaxy population is peaked around a small range of values, but there is a long tail to much redder W1-W2 colour. We call this tail the “red outlier” population.
-
4.
We introduce a simple procedure to pull out the red outlier population based on a combination of three stellar population diagnostics: 1) the 4000 Å break strength, 2) the specific star formation rate SFR/, c) the H Balmer absorption line index, and apply this to galaxies in the stellar mass range . The red outliers are more likely to be found in galaxies with higher stellar masses, and are offset towards lower stellar surface densities, younger stellar ages and higher dust content (as measured by the Balmer decrement H/H) compared to the optical AGN. Twice as many of the red outliers are detected in the radio as optical AGN.
-
5.
We examine W1-W2 colour profiles for a subset of the nearest, reddest outliers with central W1-W2 colours greater than 0.8. This colour has been proposed as a “robust” cut capable of identifying AGN at all redshifts by Stern et al (2013). Out of 19 galaxies, only one shows a clearly centrally peaked colour profile. The W1-W2 colours in the other systems only dip below 0.8 at radial distance of greater than 5 kpc on average, indicating that the hot dust emission is spread throughout the galaxy.
-
6.
For a larger subset of 1000 of the nearest red outliers, we are able to look at correlations between the colour difference between W1-W2 measured within the central ( arcsec) and 2nd (5-8 arcsec) WISE photometric apertures, and a range of different galaxy properties. We find that radio luminosity is the quantity that is most predictive of a redder central W1-W2 colour.
-
7.
We examine a subset of 20 of the nearest red outliers with radio luminosities in excess of Watts Hz-1. Their SDSS images reveal that nearly all are morphologically disturbed galaxies with tidal features, asymmetric light distributions and outer shell-like structures, or are systems still in the process of merging. Their VLA images reveal compact, unresolved emission at 1.5 Ghz in all but one of the merging systems, where two compact radio sources are found.
-
8.
We show that all red W1-W2 outliers with radio luminosities in excess of Watts Hz-1 are also outliers in the relation between radio luminosity and extinction corrected H luminosity, indicating that some fraction of the radio emission is likely to originate from synchrotron emission from a relativistic jet. 80% percent of such systems are identifiable as AGN based on optical emission line ratios (see next section).
5.1 Relation to past work
5.1.1 Normal galaxies
The result of our analysis that we found most surprising was the large population of normal galaxies with very red W1-W2 colours with extended hot dust.
We note that evidence for extended hot dust emission in elliptical galaxies has existed for many years. Xilouris et al (2004) presented mid-infrared (MIR) maps for a sample of 18 nearby early-type galaxies observed at 4.5, 6.7 and 15 m with the ISOCAM instrument on board the ISO satellite. They modeled the broad-band spectral energy distributions (SED) of these galaxies using stellar evolutionary synthesis models and derived the MIR excess over the stellar component. The morphology of the galaxies at these wavelengths was examined by plotting the azimuthally averaged radial profiles as well as MIR colour profiles. These authors found very diverse MIR proprties for their sample. Out of 18 galaxies studied, 2 dwarf ellipticals exhibited a clumpy distribution of dust, 2 galaxies exhibited large scale disks, 2 galaxies were devoid of dust, 1 had compact MIR emission due to an AGN, 1 had emission associated with a jet, 3 had MIR emission which was more centrally concentrated and the remaining 7 galaxies had smooth distributions of the dust throughout the galaxy.
Kaneda et al 2007 analyzed observations of 7 galaxies, which were among the IRAS dusty elliptical galaxies described in Goudfrooij and de Jong (1995). The dust masses derived for these objects from the IRAS flux densities exceed by more than one order of magnitude the threshold where dust is replenished by stellar mass loss. For each galaxy, Kaneda et al obtained 5–14 m spectra using the IRS/Short-Low module in the standard staring mode. The main result was that in the outskirts of the galaxies, the extended mid-IR emission appeared to follow the plasma distribution rather than the stellar distribution for the three X-ray-brightest galaxies in the sample. They proposed that the spatial correspondence between mid-IR and X-ray not only indicated the existence of diffusely distributed interstellar dust, but also suggested the dominance of hot electron collisions over stellar radiation for stochastic heating of distributed dust (Draine & Salpeter 1979; Dwek 1986).
The analysis in this paper indicates that extended hot dust is not confined to the elliptical galaxy population. The red outliers are found over a large range in stellar mass and morphological type.
5.1.2 Active galaxies and starbursts
The mid-IR properties of starburst galaxies, Seyfert galaxies and quasars have traditionally been studied separately, but there have been interesting attempts to link between different classes of objects.
The existence of a IR enhancement or bump in the wavelength region 2-10 micron above the underlying power-law spectrum has been known in quasars since the 1980s (Neugebauer 1976; Robson et al 1986; Edelson & Malkan 1986). The favoured model is that the near-IR excess originates from dust heated by ultraviolet radiation from the central AGN to a temperature of 1500 K at a radius of about 1 pc from the central source (e.g. Barvainis 1987). Emission at wavelengths longer than 2 micron comes from cooler grains farther from the central source.
Recently, infrared interferometry has made it possible to resolve the nuclear dust distributions in the dusty torii in nearby active galactic nuclei. In the Seyfert 2 galaxy NGC 1068, the interferometric observations reveal a hot, parsec-sized disk that is surrounded by warm dust extended in the polar direction (Wittkowski et al. 2004; Jaffe et al. 2004; Weigelt et al. 2004). Tristram et al (2013) report on observations of the Circinius galaxy with the mid-infrared interferometric instrument (MIDI) at the Very Large Telescope Interferometer. The dust emission is distributed in two distinct components: a parsec-scale disk-like emission component and a dusty outflow with the same temperature as the disk. More recently, submillimetre observations of the torus of NGC 1068 using ALMA have provided a best-fit gas mass of and radius of 3.5 pc (García-Burillo et al 2016).
Nearby Seyfert galaxies also often host compact radio sources that can be associated with either central star formation or with a jet. Gallimore et al (2006) conducted a high-resolution VLA survey of 43 Seyfert and LINER galaxies and found that 44% (19 out of 43) show extended radio structures at least 1 kpc in total extent. The radio emission does not match the morphology of the disk or its associated star-forming regions. These systems also stand out by deviating significantly from the far-infrared/radio correlation for star-forming galaxies. Gallimore et al propose that Seyfert galaxies generate radio outflows over a significant fraction of their lifetime and propose a scenario in which virtually all of the jet power is lost to the ISM within the galaxy.
Finally, the study of the most luminous galaxies in the far-IR, which are predominantly merging systems, revealed a new class of star formation in the central regions of these systems. The most IR-bright starbursts with an IR luminosity of or more have characteristic sizes of only 100 pc, with about of molecular gas contained within the emitting region. These compact starbursts have also been studied at radio wavelengths. Out of 40 ULIRGS in the IRAS catalogue, Condon et al (1991) find 25 objects with diffuse radio emission obeying the far IR-radio correlation for normal starbursts. The other 15 have very compact radio-loud nuclei – in one object the radio emission is variable and is constrained to be coming from region less than 1pc in diameter.
In summary, these more detailed studies support the view that galaxies with centrally peaked mid-IR emission are those where black hole growth may be occurring in a mode that is largely hidden at optical wavelengths, and that black hole growth may be modulated/regulated by energetic feedback from relativistic jets generated by the accreting black hole.
5.2 Implications of extended hot dust emission in galaxies
The main goal of modern theories of galaxy formation is to incorporate a broad range of observational phenomenology within a predictive model that is based on evolving the distribution of dark matter and gas in the early Universe forward in time using semi-analytic models or direct N-body simulations. We now view galaxies and their supermassive black holes as continuously evolving systems, which grow through gas accretion and merging as their surrounding dark matter halos assemble. According to theory, gas accretion and merging in an individual galaxy is a stochastic process, sometimes involving slow and steady accretion of new material onto the disk, and sometimes involving major merging events that destroy disks, form bulges and channel large amounts of gas into a central starburst (e.g. Croton et al 2006).
In order for these theoretical models to reproduce key observational constraints, such as the fraction of gas that is eventually turned into stars in the central galaxies of the dark matter halos of or greater, strong energy input from AGN is often invoked. Observational evidence supporting this “AGN feedback” picture has thus far been confined to direct measurements of outflowing gas in samples of a few dozen luminous AGN (e.g. Greene et al 2011; Veilleux et al 2013). In this paper, we have presented evidence that the majority of the 4.6 m mid-IR “red outlier population”, with W1-W2 colours that are too red to be explained by their measured star formation rates, are systems with spatially extended hot dust distributions. At distance of 5-10 kpc from the center of a galaxy, it is likely that the dust is being heated by collisions with electrons from a hot plasma that permeates the galaxy. The question then arises as to why extended dust emission is so common. In regions of the galaxy where the volume filling factor of hot plasma is high, interstellar dust is expected to be easily destroyed through sputtering by ambient plasma ions (Draine & Salpeter 1979; Dwek & Arendt 1992; Tielens et al. 1994). There should thus be some physical constraints on the local dust mass, which is determined by the balance between destruction and replenishment.
One source of replenishment is mass loss from evolved AGB stars located in the same region of the galaxy. Another possibility is the dust forms in the central region of the galaxy during a starburst, and that outflows (perhaps driven by jets) spread the dust out to large galacto-centric distances. Spatially resolved dust formation and destruction mechanisms have recently been introduced in cosmological hydrodynamical simulations (McKinnon, Torrey & Vogelsberger 2016). In these simulations, supernovae driven winds lead to dust being spread over scales of 100 kpc around galaxies. The predicted dust surface densities are too low to match observations of dust in the circumgalactic medium around galaxies and the dropoff in surface density is also too steep in comparison with observational constraints from Ménard et al (2010), suggesting that additional dust spreading mechanisms may be needed.
5.3 Future perspectives: what is the relation between the compact radio-emitting sources and black hole growth?
We note that the results presented in this paper show that if surveys of galaxies at mid-IR wavelengths are to be used to study how black holes are formed and fed, galaxies with compact hot-dust emission need to be separated from systems where the mid-IR emission is emitted over large spatial scales. The WISE imaging data, with its low spatial resolution, is clearly not ideal for identifying compact starbursts, but the combination of a mid-IR colour cut with detection of a compact radio-emitting source is likely to yield samples that may be interesting for future follow-up at higher resolution.
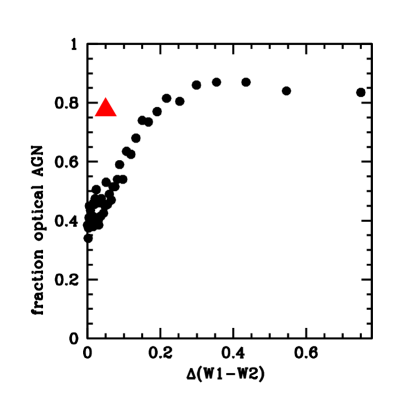
The final issue we address is whether the red outliers are disjoint from the Seyfert 2 and LINERS selected using BPT diagram optical emission line ratio diagnostics. Figure 15 answers this question. The black filled circles show the fraction of optical AGN in the red outlier population as a function of (W1-W2), the difference between the W1-W2 colour of the galaxy and the colour that delineates the 95th percentile cut. The optical AGN fraction increases from 40% at the 95th percentile boundary, to 85% for the very reddest systems. The bright red triangle shows the optical AGN fraction for all outliers with (W1-W2)0.05 and with radio luminosities greater than Watts Hz-1. We find that 77% of these radio-loud red outliers are classified as optical AGN, which is similar to the fraction found for the very reddest outliers in W1-W2 colour. This result is not sensitive to the adopted threshold in radio luminosity. We conclude that mid-IR selection does not reveal a significant population of AGN that cannot be identified optically. In future work we will study the optical emission and stellar absorption line properties of the radio-loud, mid-IR outlier population in more detail.
References
- Abazajian et al. (2009) Abazajian K. N., et al., 2009, ApJS, 182, 543-558
- Baldwin, Phillips, & Terlevich (1981) Baldwin J. A., Phillips M. M., Terlevich R., 1981, PASP, 93, 5
- Barvainis (1987) Barvainis R., 1987, ApJ, 320, 537
- Becker, White, & Helfand (1995) Becker R. H., White R. L., Helfand D. J., 1995, ApJ, 450, 559
- Best et al. (2005) Best P. N., Kauffmann G., Heckman T. M., Ivezić Ž., 2005, MNRAS, 362, 9
- Brinchmann et al. (2004) Brinchmann J., Charlot S., Heckman T. M., Kauffmann G., Tremonti C., White S. D. M., 2004, astro, arXiv:astro-ph/0406220
- Chen et al. (2017) Chen C.-T. J., et al., 2017, ApJ, 837, 48
- Cisternas et al. (2011) Cisternas M., et al., 2011, ApJ, 726, 57
- Condon et al. (1991) Condon J. J., Huang Z.-P., Yin Q. F., Thuan T. X., 1991, ApJ, 378, 65
- Croom et al. (2004) Croom S. M., Smith R. J., Boyle B. J., Shanks T., Miller L., Outram P. J., Loaring N. S., 2004, MNRAS, 349, 1397
- Croton et al. (2006) Croton D. J., et al., 2006, MNRAS, 365, 11
- Di Matteo, Springel, & Hernquist (2005) Di Matteo T., Springel V., Hernquist L., 2005, Natur, 433, 604
- Draine & Salpeter (1979) Draine B. T., Salpeter E. E., 1979, ApJ, 231, 77
- Dwek (1986) Dwek E., 1986, ApJ, 302, 363
- Dwek & Arendt (1992) Dwek E., Arendt R. G., 1992, ARA&A, 30, 11
- Eckart et al. (2010) Eckart M. E., McGreer I. D., Stern D., Harrison F. A., Helfand D. J., 2010, ApJ, 708, 584
- Edelson & Malkan (1986) Edelson R. A., Malkan M. A., 1986, ApJ, 308, 59
- Gallimore et al. (2006) Gallimore J. F., Axon D. J., O’Dea C. P., Baum S. A., Pedlar A., 2006, AJ, 132, 546
- García-Burillo et al. (2016) García-Burillo S., et al., 2016, ApJ, 823, L12
- Granato et al. (2004) Granato G. L., De Zotti G., Silva L., Bressan A., Danese L., 2004, ApJ, 600, 580
- Greene et al. (2011) Greene J. E., Zakamska N. L., Ho L. C., Barth A. J., 2011, ApJ, 732, 9
- Harrison et al. (2013) Harrison F. A., et al., 2013, ApJ, 770, 103
- Heckman et al. (1986) Heckman T. M., Smith E. P., Baum S. A., van Breugel W. J. M., Miley G. K., Illingworth G. D., Bothun G. D., Balick B., 1986, ApJ, 311, 526
- Heckman et al. (2004) Heckman T. M., Kauffmann G., Brinchmann J., Charlot S., Tremonti C., White S. D. M., 2004, ApJ, 613, 109
- Heckman et al. (2004) Heckman T. M., Kauffmann G., Brinchmann J., Charlot S., Tremonti C., White S. D. M., 2004, ApJ, 613, 109
- Hopkins et al. (2008) Hopkins P. F., Hernquist L., Cox T. J., Kereš D., 2008, ApJS, 175, 356-389
- Jaffe et al. (2004) Jaffe W., et al., 2004, Natur, 429, 47
- Kauffmann & Haehnelt (2000) Kauffmann G., Haehnelt M., 2000, MNRAS, 311, 576
- Kauffmann et al. (2003) Kauffmann G., et al., 2003, MNRAS, 346, 1055
- Kauffmann, Heckman, & Best (2008) Kauffmann G., Heckman T. M., Best P. N., 2008, MNRAS, 384, 953
- Kaneda et al. (2007) Kaneda H., Onaka T., Kitayama T., Okada Y., Sakon I., 2007, PASJ, 59, 107
- Kocevski et al. (2012) Kocevski D. D., et al., 2012, ApJ, 744, 148
- Li et al. (2008) Li C., Kauffmann G., Heckman T. M., White S. D. M., Jing Y. P., 2008, MNRAS, 385, 1915
- Li et al. (2012) Li C., et al., 2012, MNRAS, 419, 1557
- Mainzer et al. (2011) Mainzer A., et al., 2011, ApJ, 731, 53
- Marconi et al. (2014) Marconi M., et al., 2014, MNRAS, 444, 3809
- Mateos et al. (2012) Mateos S., et al., 2012, MNRAS, 426, 3271
- McKinnon, Torrey, & Vogelsberger (2016) McKinnon R., Torrey P., Vogelsberger M., 2016, MNRAS, 457, 3775
- Ménard et al. (2010) Ménard B., Scranton R., Fukugita M., Richards G., 2010, MNRAS, 405, 1025
- Neugebauer et al. (1976) Neugebauer G., Becklin E. E., Oke J. B., Searle L., 1976, ApJ, 205, 29
- Reichard et al. (2009) Reichard T. A., Heckman T. M., Rudnick G., Brinchmann J., Kauffmann G., Wild V., 2009, ApJ, 691, 1005
- Richards et al. (2006) Richards G. T., et al., 2006, AJ, 131, 2766
- Robson et al. (1986) Robson E. I., Gear W. K., Brown L. M. J., Courvoisier T. J.-L., Smith M. G., 1986, Natur, 323, 134
- Rosario et al. (2013) Rosario D. J., Burtscher L., Davies R., Genzel R., Lutz D., Tacconi L. J., 2013, ApJ, 778, 94
- Sanders et al. (1988) Sanders D. B., Soifer B. T., Elias J. H., Madore B. F., Matthews K., Neugebauer G., Scoville N. Z., 1988, ApJ, 325, 74
- Sanders & Mirabel (1996) Sanders D. B., Mirabel I. F., 1996, ARA&A, 34, 749
- Shao et al. (2013) Shao L., Kauffmann G., Li C., Wang J., Heckman T. M., 2013, MNRAS, 436, 3451
- Sijacki et al. (2015) Sijacki D., Vogelsberger M., Genel S., Springel V., Torrey P., Snyder G. F., Nelson D., Hernquist L., 2015, MNRAS, 452, 575
- Soltan (1982) Soltan A., 1982, MNRAS, 200, 115
- Somerville et al. (2008) Somerville R. S., Hopkins P. F., Cox T. J., Robertson B. E., Hernquist L., 2008, MNRAS, 391, 481
- Stern et al. (2005) Stern D., et al., 2005, ApJ, 631, 163
- Stern et al. (2012) Stern D., et al., 2012, ApJ, 753, 30
- Tielens et al. (1994) Tielens A. G. G. M., McKee C. F., Seab C. G., Hollenbach D. J., 1994, ApJ, 431, 321
- Tristram (2013) Tristram K. R. W., 2013, arXiv, arXiv:1312.3607
- Ueda et al. (2003) Ueda Y., Akiyama M., Ohta K., Miyaji T., 2003, ApJ, 598, 886
- Veilleux et al. (2013) Veilleux S., et al., 2013, ApJ, 776, 27
- Volonteri, Haardt, & Madau (2003) Volonteri M., Haardt F., Madau P., 2003, ApJ, 582, 559
- Weigelt et al. (2004) Weigelt G., Wittkowski M., Balega Y. Y., Beckert T., Duschl W. J., Hofmann K.-H., Men’shchikov A. B., Schertl D., 2004, A&A, 425, 77
- Wittkowski et al. (2004) Wittkowski M., Kervella P., Arsenault R., Paresce F., Beckert T., Weigelt G., 2004, A&A, 418, L39
- Wright et al. (2010) Wright E. L., et al., 2010, AJ, 140, 1868-1881
- Xilouris et al. (2004) Xilouris E. M., Madden S. C., Galliano F., Vigroux L., Sauvage M., 2004, A&A, 416, 41
- York et al. (2000) York D. G., et al., 2000, AJ, 120, 1579