Refining Glass Structure in Two Dimensions
Abstract
Recently determined atomistic scale structures of near-two dimensional bilayers of vitreous silica (using scanning probe and electron microscopy) allow us to refine the experimentally determined coordinates to incorporate the known local chemistry more precisely. Further refinement is achieved by using classical potentials of varying complexity; one using harmonic potentials and the second employing an electrostatic description incorporating polarization effects. These are benchmarked against density functional calculations. Our main findings are that (a) there is a symmetry plane between the two disordered layers; a nice example of an emergent phenomenon, (b) the layers are slightly tilted so that the Si-O-Si angle between the two layers is not as originally thought but rather and (c) while interior areas that are not completely imagined can be reliably reconstructed, surface areas are more problematical. It is shown that small crystallites that appear are just as expected statistically in a continuous random network. This provides a good example of the value that can be added to disordered structures imaged at the atomic level by implementing computer refinement.
The atomic structure of covalent network glasses has been a subject of both experimental and theoretical interest since the introduction of the Continuous Random Network (CRN) model by Zachariasen Zachariasen (1932). Almost all of these studies have focused on the Pair Distribution Function (PDF) which is the Fourier transform of a diffraction pattern Wright and M.F.Thorpe (2013). Experimental diffraction studies offer useful information, in particular regarding pair-wise ordering Fischer et al. (2005). However, simulation models can greatly aid the interpretation of these data as the atom positions are known unequivocally. As a result, information such as the ring statistics, which is in many ways a natural language for discussing network structure Marians and Hobbs (1990); Zeidler et al. (2014); Sadjadi and M.F.Thorpe (2016), is directly accessible. While this work has been very informative and clearly established the correctness of the CRN model for materials like vitreous silica, it is not accurate enough to distinguish between different models with varying ring statistics etc. This situation has changed recently with the direct imaging of bilayers of silica L.Lichtenstein et al. (2012); P.Y.Huang et al. (2012) that has provided detailed information regarding atomic positions.
Silica, SiO2, represents an archetypal network-forming material. At ambient pressure the crystalline and amorphous structures can be considered as constructed from corner-sharing SiO4 tetrahedral coordination polyhedra (CP) which link to form a network. The complex linking of the CP may result in significant ordering on length-scales beyond the short-range ordering imposed by the system electrostatics (effectively controlled by the relative atom electronegativities) Salmon et al. (2005); Salmon (2005, 2007); Salmon et al. (2006, 2007); Wilson (2016).
Recently developed synthetic pathways have allowed thin films of SiO2 to be deposited on either metallic J.Weissenrieder et al. (2005); Löffler et al. (2010); L.Lichtenstein et al. (2012) or graphitic P.Y.Huang et al. (2012) substrates whilst advances in imaging techniques allow for true atomic resolution of the surface structure. Albeit, because the bilayer is a glassy material, it is not commensurate with any substrate, and so we do not include the substrate here.
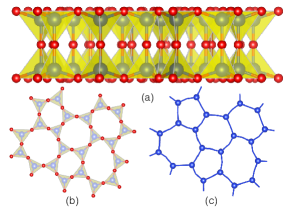
Some of the thinnest films deposited are bilayers of corner-sharing SiO4 CP in which all of the Si and O atoms obtain their full (four- and two- respectively) coordination numbers. Amorphous and crystalline films have been grown with both states characterized by the presence of a mirror plane (which houses a layer of O atoms which act as bridges between the two monolayers M.Wilson et al. (2013)). Critically, the pseudo-two-dimensional nature of these systems allows the ring structures to be directly observed and hence offers a potentially unique insight into the origin of any ordering on long length-scales. Silica can be considered as a network of silicon atoms in which the nearest-neighbor Si-Si pairs are dressed with O atoms. As a result, the crystalline system can be considered as constructed exclusively from a net of six-membered (Si-Si-Si…) rings, whilst the amorphous systems are constructed from a distribution of 4- to 10-membered rings (Fig. 1). However, this new experimental information, whilst ground-breaking, is naturally imperfect as the location of each atom has associated with it a natural uncertainty which translates into an uncertainty in atom-atom separations.
In this Letter, we show how value can be added by combining the experimental image with computer refinement that builds in the known local chemistry. Whilst no refinement of the experimental data is required in order to obtain, for example, accurate ring statistics, refinement is required in order to address the geometrical issues associated with the network. For example, value can be added on the effect of the presence of significant unimaged regions as well as on the subtle variations in the structure perpendicular to the resolved plane containing the bilayer.
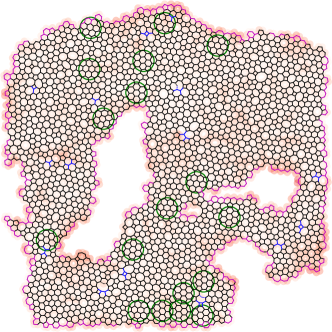
In this Letter we focus on a single large sample of a bilayer of vitreous silica imaged by the Cornell group P.Y.Huang et al. (2012) which we will refer to as sample h, shown in Fig. 2, to distinguish it from previous smaller experimental and computer-generated samples Kumar et al. (2014). The sample is in area containing 19,330 O and 9,492 Si atoms, and is the largest such sample imaged at the atomic level of which we are aware.
Importantly, we are using the whole experimental sample, including voids, rather than selecting a more rectangular shaped section without voids, which would have thrown out most of the experimental data. This is also significant as the full configuration shows a number of interesting features. For example, there are several regions which may be considered nanocrystalline showing relatively large numbers of neighbouring six-membered rings (highlighted by green circles with a diameter of 9 Å). Such regions are to be expected staistically in a CRN and from previous studies Sadjadi and M.F.Thorpe (2016) we find that about 50% of all rings are sixfold and of these about 2% are surrounded by 6 sixfold rings leading to a little microcrystallite of 7 sixfold rings. The total number of rings in the Cornell h sample is 1811, where we exclude surface rings that do not have their full compliment of neigboring rings. Thus we expect 1811 0.5 0.02 18 of such regions which is fortuitously exactly the number of regions shown by green circles. So this certainly cannot be taken as any evidence for microcrystallites as has been postulated at various times since the original ideas of Lebedev and coworkers Lebedev (1937).
More obviously the configuration shows three relatively large regions which were unable to be imaged (of approximate dimensions 16040, 5020 and 1010 respectively) which resist reasonable attempts at computational filling (see below). A potential implication is that the underlying surface (on which the bilayer has been grown) in some way distorts the bilayer thus preventing effective imaging or perhaps the network was never formed in these regions because of surface roughness.
To construct the bilayer from the experimental image, O atoms (which are not imaged) are placed midway between Si atoms (which are imaged) thus forming a network of corner-sharing O3 triangles (each of which has an Si atom at the centre). The Si and O atoms planes are then separated, forming trigonal pyramids with Si atoms at the apices. A mirror image of these pyramids is joined to the original via O-atom bridges to form the completed bilayer, resulting in an initial set of 180o Si-O-Si bond angles centered around the O atoms in the mirror plane (Fig. 1). An important question involves the experimental length metric to ensure the correct calibration of the image. We calculated the mean average length of the imaged nearest neighbour Si-Si distances as 3.097Å, which is close to the expected value of 3.100Å for glassy silica structures Keen and Dove (1999), confirming the overall accuracy of the experiment, and alleviating the need for any length rescaling. To reconstruct the unimaged regions, we use mean bond length and internal angles of rings to find the correct local topology. The subsequent relaxation of the bilayer will fix the geometry ensuring the proper bond length and angles.
This relaxation is carried out using model potentials of increasing complexity. In the simplest case, the nearest-neighbour O-O bonds are mimicked by harmonic springs with lengths set as the mean average (Å). This ensures that the system does not have any internal degrees of freedom and is minimally rigid or isostatic Thorpe (1983); Ellenbroek et al. (2015). A hardcore potential is added to prevent overlap of O atoms from different tetrahedra as well as an RMSD (Root-Mean-Square Deviation) term which penalizes deviation from the experimental coordinates. This RMSD term involves the sum of squares of the refined minus the experimental atomic positions and is important as this maintains the overall area and alleviates the need for additional boundary conditions to maintain the sample area. Although proper boundary conditions for finite pieces of amorphous systems can be designed Theran et al. (2015), this simple potential can account for structural information extracted in this Letter. Maintaining the configurational area is critical in avoiding, for example, unphysical overlaps in nearest-neighbour tetrahedra in the absence of formal (electrostatic) repulsions. The balance of the surface extension and the inter-tetrahedral repulsions define an effective flexibility window of acceptable structural solutions, of the type commonly associated with zeolites Sartbaeva et al. (2007). As a result, samples with irregular boundary conditions are not a problem.
A second classical model used is a polarizable-ion model (PIM) Madden and Wilson (1996), specifically the TS potential Tangney and Scandolo (2002) which utilises pair potentials to model the Coulomb, short-range (overlap) and dispersive interactions. The potential employs a combination of reduced ion charges and anion dipole polarisation (as described in reference Madden and Wilson (1996)). The results from the harmonic potential model are used as the input with the PIM further refining the results.
The most sophisticated method applied uses Density Functional Theory (DFT). However, the method is too computationally-demanding to apply to the experimental Cornell h configuration. Therefore, a relatively small atom periodic computer-generated model (with 200 Si atoms in each monolayer) of a vitreous silica bilayer A.Kumar et al. (2012) was used. Density functional calculations were undertaken with the code SIESTA Soler et al. (2002), with single-zeta basis and the local density approximation. Relaxation with a variable cell area resulted in very little change. Stability of the relaxed model was also verified Bhattarai and Drabold (2016).
The result of the PIM refinement of Cornell h is shown in Fig. 2. The blue (bulk) and magenta (surface) bonds have been computer-reconstructed, as described earlier. The interior reconstruction was deemed to be successful, as the differences between the spring and PIM models were minor. These differences are shown by the red shading where the darkest red corresponds to an atomic displacement of Å from the original (unrefined) coordinates. This strongly suggests that the network existed in these interior areas but was not imaged reliably, rather than the networks growing around a pillar or avoiding surface roughness on the substrate and never existing. At the surface, the difference between the spring and PIM models was much greater as the reconstruction was not contained within a small closed exterior perimeter.
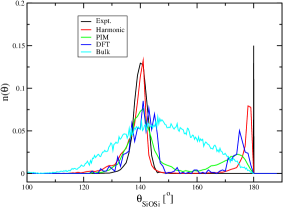
In addition to in-plane information, refinement can provide valuable information in perpendicular direction. As a benchmark of our model potentials, we have studied the Si-O-Si angle, , as this contains important information on how the tetrahedra are linked. Figure 3 shows the distributions of for three models. The experimental structure (in which linear Si-O-Si bridges between the two monolayers are imposed) shows a bond angle of (with a FWHM of ) in the bilayer plane. All of the models generate bimodal distributions in which the peak at may be assigned to the Si-O-Si triplets in the bilayer plane whilst the peaks at correspond to the triplets centred around the bridging O atoms in the mirror plane (i.e. perpendicular to the bilayer plane). There is not much latitude in the in-plane values of this angle as they must be consistent with the measured area and the known Si-O bond lengths, which leads to a single peak in the . Fig. 3 shows that the harmonic model reproduces the important high-angle peak at . The lower-angle peak is at () and some way below the DFT result.
The figure also shows the analogous distribution obtained from the bulk glass at ambient pressure using PIM, which is similar to distributions observed in bulk silicates Desa et al. (1982); Neuefeind and Liss (1996). The bulk distribution is significantly broader than those generated for the bilayer with and . The requirement for the relatively obtuse bond angles which characterise the links between the two layers constrains the in-plane bond angles to a relatively narrow range. For the intra-layer angles all of the models show peaks at with the harmonic potential showing a far sharper peak retaining the symmetry plane.
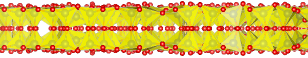
However the bridging O angle is tilted and reduced to about . A Si-O-Si angle of 180o sits on a local energy maximum Dawson et al. (2014) and, as a result, tilting is inevitable. A tilt in the inter-layer bond angle is observed in all the models. At the simplest level (harmonic potential) a relatively small deviation from linear () is shown. As greater detail is added to the models these angles become more acute with both the PIM and DFT results showing peaks at . Figure 4 shows the configuration perpendicular to the plane containing the bilayer relaxed using the PIM and clearly showing the tilted corner-sharing tetrahedra, with a peak at .
At first sight this suggests an incompatibility with the experimental results where only a single layer is seen, with the second layer of Si tetrahedra being exactly behind and underneath the first. However this can be maintained if there is a symmetry plane involving the central O atoms, such that the upper and lower tetrahedra tilt and pucker in the same way and there is not a second image when the bilayer is imaged from above, as shown in Figure 4. This conclusion is supported by an entropy argument in which the bilayer with a mirror plane is able to explore configurational space more effectively than one without M.Wilson et al. (2013). There are more degrees of freedom with the symmetry plane present, thus increasing the entropy and lowering the free energy, and hence leading to this unexpected emergent phenomena. Thus symmetry is induced in a system which at first sight seems a canonical example of a system without symmetry. This argument is confirmed both by detailed atomic computer modeling and by experiment, where no shadow is seen beside each atom imaged, so that the second layer must be exactly behind the first layer.
A feature to notice from Fig. 2 is that the polygons with silicon atoms at the corners appear regular, having areas close to that of regular polygons as has been previously noted Kumar et al. (2014). This feature has been absent in computer generated models of vitreous silica bilayer as the Si-O-Si angle of around in the plane is hard to achieve in models while maintaining the maximal convexity of Si polygons. Nature has found a way and we need to understand better how this is achieved. Note there is no difficulty in achieving regular polygons in samples of amorphous As A.Kumar et al. (2012) where there are no bridging atoms to contend with.
In this Letter we have described how computer-refinement can add value to experimental images of disordered structures at the atomic level. Although this is the first time this has been attempted with an amorphous structure, with advances in imaging, many more such systems are expected to be imaged in the near future. This somewhat parallels the procedures employed to rationalise protein structure where the local chemistry, via bond lengths etc is included to produce the best possible structure Perrakis et al. (1999). We have shown that simple potentials are adequate here, and as well as producing refined coordinates for the bilayer (available upon request), we have shown that the two layers are tilted while maintaining a flat central symmetry plane of O atoms between the upper and lower parts of the bilayer. It is remarkable that such symmetry can exist in disordered system and this can be viewed as a nice clean example of an emergent phenomena.
Future work will help determine how ubiquitous bilayer structures of this type may be. It is possible, for example, that forming such structures for systems such as GeO2 may be more problematic as a significantly larger tilt () would have to be accommodated Dawson et al. (2014).
Acknowledgements.
We should like to thank Berlin and Cornell groups for the coordinates of their networks and for useful discussions. This work used the Extreme Science and Engineering Discovery Environment (XSEDE), which is supported by National Science Foundation grant number ACI-1548562 Towns et al. (2014). Support through NSF grants # DMS 1564468 (MFT) and # DMR 1506836 (DAD) is gratefully acknowledged.References
- Zachariasen (1932) W.H. Zachariasen, “The atomic arrangement in glass,” Journal of the American Chemical Society 54, 3841–3851 (1932).
- Wright and M.F.Thorpe (2013) A.C. Wright and M.F.Thorpe, “Eighty years of random networks,” physica status solidi (b) 250, 931–936 (2013).
- Fischer et al. (2005) Henry E Fischer, Adrian C Barnes, and Philip S Salmon, “Neutron and x-ray diffraction studies of liquids and glasses,” Reports on Progress in Physics 69, 233 (2005).
- Marians and Hobbs (1990) Carol S Marians and Linn W Hobbs, “Local structure of silica glasses,” Journal of Non-Crystalline Solids 119, 269–282 (1990).
- Zeidler et al. (2014) Anita Zeidler, Kamil Wezka, Ruth F Rowlands, Dean AJ Whittaker, Philip S Salmon, Annalisa Polidori, James WE Drewitt, Stefan Klotz, Henry E Fischer, Martin C Wilding, et al., “High-pressure transformation of SiO2 glass from a tetrahedral to an octahedral network: a joint approach using neutron diffraction and molecular dynamics,” Physical review letters 113, 135501 (2014).
- Sadjadi and M.F.Thorpe (2016) M. Sadjadi and M.F.Thorpe, “Ring correlations in random networks,” Physical Review E 94, 062304 (2016).
- L.Lichtenstein et al. (2012) L.Lichtenstein, C. Buechner, B.Yang, S.Shaikhutdinov, M.Heyde, M.Sierka, R.Wlodarczyk, J.Sauer, and H-J Freund, “The atomic structure of a metal-supported vitreous thin silica film,” Angewandte Chemie International Edition 51, 404–407 (2012).
- P.Y.Huang et al. (2012) P.Y.Huang, S.Kurasch, A.Srivastava, V.Skakalova, J.Kotakoski, A.V.Krasheninnikov, R.Hovden, Q.Mao, J.C.Meyer, J.Smet, D.A.Muller, and U.Kaiser, “Direct imaging of a two-dimensional silica glass on graphene,” Nano letters 12, 1081–1086 (2012).
- Salmon et al. (2005) Philip S Salmon, Richard A Martin, Philip E Mason, and Gabriel J Cuello, “Topological versus chemical ordering in network glasses at intermediate and extended length scales,” Nature 435, 75–78 (2005).
- Salmon (2005) Philip S Salmon, “Moments of the Bhatia–Thornton partial pair-distribution functions,” Journal of Physics: Condensed Matter 17, S3537 (2005).
- Salmon (2007) Philip S Salmon, “The structure of tetrahedral network glass forming systems at intermediate and extended length scales,” Journal of Physics: Condensed Matter 19, 455208 (2007).
- Salmon et al. (2006) Philip S Salmon, Adrian C Barnes, Richard A Martin, and Gabriel J Cuello, “Glass fragility and atomic ordering on the intermediate and extended range,” Physical Review Letters 96, 235502 (2006).
- Salmon et al. (2007) Philip S Salmon, Adrian C Barnes, Richard A Martin, and Gabriel J Cuello, “Structure of glassy GeO2,” Journal of Physics: Condensed Matter 19, 415110 (2007).
- Wilson (2016) Mark Wilson, “Structure and dynamics in network-forming materials,” Journal of Physics: Condensed Matter 28, 503001 (2016).
- J.Weissenrieder et al. (2005) J.Weissenrieder, S.Kaya, J-L.Lu, H-J.Gao, S.Shaikhutdinov, H-J.Freund, M.Sierka, T.K.Todorova, and J.Sauer, “Atomic structure of a thin silica film on a Mo (112) substrate: a two-dimensional network of SiO4 tetrahedra,” Physical review letters 95, 076103 (2005).
- Löffler et al. (2010) Daniel Löffler, John J Uhlrich, M Baron, Bing Yang, Xin Yu, Leonid Lichtenstein, Lars Heinke, Christin Büchner, Markus Heyde, Shamil Shaikhutdinov, et al., “Growth and structure of crystalline silica sheet on Ru (0001),” Physical review letters 105, 146104 (2010).
- M.Wilson et al. (2013) M.Wilson, A.Kumar, D.Sherrington, and M.F.Thorpe, “Modeling vitreous silica bilayers,” Physical Review B 87, 214108 (2013).
- Kumar et al. (2014) A. Kumar, D. Sherrington, M. Wilson, and M. F. Thorpe, “Ring statistics of silica bilayers,” Journal of Physics: Condensed Matter 26, 395401 (2014).
- Lebedev (1937) AA Lebedev, “O polimorfizme i otzhige stekla, trud’i gos. opt. inst. 2 1-20 (1921)(in russian); ibid,” Izv. Akad. Nauk SSSR, Otd. Mat. Estestv. Nauk, Ser. Fiz 3, 381 (1937).
- Keen and Dove (1999) David A Keen and Martin T Dove, “Local structures of amorphous and crystalline phases of silica, SiO2, by neutron total scattering,” Journal of Physics: Condensed Matter 11, 9263 (1999).
- Thorpe (1983) M F Thorpe, “Continuous deformations in random networks,” Journal of Non-Crystalline Solids 57, 355–370 (1983).
- Ellenbroek et al. (2015) Wouter G Ellenbroek, Varda F Hagh, Avishek Kumar, M F Thorpe, and Martin van Hecke, “Rigidity loss in disordered systems: Three scenarios,” Physical review letters 114, 135501 (2015).
- Theran et al. (2015) L. Theran, A. Nixon, E. Ross, M. Sadjadi, B. Servatius, and M.F. Thorpe, “Anchored boundary conditions for locally isostatic networks,” Physical Review E 92, 053306 (2015).
- Sartbaeva et al. (2007) A Sartbaeva, SA Wells, A Huerta, and MF Thorpe, “Local structural variability and the intermediate phase window in network glasses,” Physical Review B 75, 224204 (2007).
- Madden and Wilson (1996) Paul A Madden and Mark Wilson, “‘Covalent’ effects in ‘ionic’ systems,” Chemical Society Reviews 25, 339–350 (1996).
- Tangney and Scandolo (2002) Paul Tangney and Sandro Scandolo, “An ab initio parametrized interatomic force field for silica,” The Journal of chemical physics 117, 8898–8904 (2002).
- A.Kumar et al. (2012) A.Kumar, M.Wilson, and M.F.Thorpe, “Amorphous graphene: a realization of Zachariasen’s glass,” Journal of Physics: Condensed Matter 24, 485003 (2012).
- Soler et al. (2002) José M Soler, Emilio Artacho, Julian D Gale, Alberto García, Javier Junquera, Pablo Ordejón, and Daniel Sánchez-Portal, “The siesta method for ab initio order-n materials simulation,” Journal of Physics: Condensed Matter 14, 2745 (2002).
- Bhattarai and Drabold (2016) Bishal Bhattarai and DA Drabold, “Vibrations in amorphous silica,” Journal of Non-Crystalline Solids 439, 6–14 (2016).
- Desa et al. (1982) JA Erwin Desa, Adrian C Wright, Joe Wong, and Roger N Sinclair, “A neutron diffraction investigation of the structure of vitreous zinc chloride,” Journal of Non-Crystalline Solids 51, 57–86 (1982).
- Neuefeind and Liss (1996) Jörg Neuefeind and K-D Liss, “Bond angle distribution in amorphous germania and silica,” Berichte der Bunsengesellschaft für physikalische Chemie 100, 1341–1349 (1996).
- Dawson et al. (2014) C.J. Dawson, R. Sanchez-Smith, P. Rez, M. O’Keefe, and M.M.J. Treacy, “Ab initio calculations of the energy dependence of Si–O–Si angles in silica and Ge–O–Ge angles in germania crystalline systems,” Chemistry of Materials 26, 1523–1527 (2014).
- Perrakis et al. (1999) Anastassis Perrakis, Richard Morris, and Victor S Lamzin, “Automated protein model building combined with iterative structure refinement,” Nature structural & molecular biology 6, 458–463 (1999).
- Towns et al. (2014) John Towns, Timothy Cockerill, Maytal Dahan, Ian Foster, Kelly Gaither, Andrew Grimshaw, Victor Hazlewood, Scott Lathrop, Dave Lifka, Gregory D Peterson, et al., “XSEDE: accelerating scientific discovery,” Computing in Science & Engineering 16, 62–74 (2014).