Beautiful and damned. Combined effect of content quality and social ties on user engagement
Abstract.
User participation in online communities is driven by the intertwinement of the social network structure with the crowd-generated content that flows along its links. These aspects are rarely explored jointly and at scale. By looking at how users generate and access pictures of varying beauty on Flickr, we investigate how the production of quality impacts the dynamics of online social systems. We develop a deep learning computer vision model to score images according to their aesthetic value and we validate its output through crowdsourcing. By applying it to over 15B Flickr photos, we study for the first time how image beauty is distributed over a large-scale social system. Beautiful images are evenly distributed in the network, although only a small core of people get social recognition for them. To study the impact of exposure to quality on user engagement, we set up matching experiments aimed at detecting causality from observational data. Exposure to beauty is double-edged: following people who produce high-quality content increases one’s probability of uploading better photos; however, an excessive imbalance between the quality generated by a user and the user’s neighbors leads to a decline in engagement. Our analysis has practical implications for improving link recommender systems.
1. Introduction
The user experience in online communities is mainly determined by the social network structure and by the user-generated content that members share through their social connections. The relationship between social network dynamics and user experience (Halvey and Keane, 2007; Susarla et al., 2012), as well as the influence of quality of content consumed on user engagement (Bouch et al., 2000; Ceaparu et al., 2004; Gulliver and Ghinea, 2006) have been extensively researched. However, the relationship between network properties and the production of quality content remains largely unexplored. This interplay is key to reach a full understanding of the user experience in online social systems. Learning how people engage with a platform in relation with the content they produce and consume is crucial to prevent churning of existing users, keep them happy, and attract newcomers.
The growing availability of interaction data from social media, along with the development of increasingly accurate computational methods to evaluate quality of textual and visual content (Lu et al., 2014; Jin et al., 2016; Kong et al., 2016; Mai et al., 2016), has recently provided effective means to fill this knowledge gap. We tap into this opportunity and we aim to advance this research direction by providing the first large-scale study on the production and consumption of quality in online social networks.
We do so through three main contributions. First, we develop a new deep learning model able to capture the beauty of a picture (4), as confirmed by a large-scale human crowdsourcing evaluation (5). Second, by applying the model to 15B public photos from Flickr (3), we are able to draw the quality profile of the photo collections uploaded by several million users and to partition these users into coherent classes based on the combination of their connectivity, popularity, and contributed quality. This provides the largest-scale description to date of the distribution of quality in an online community. We explore for the first time the relationship between quality production and network structure (6). Most importantly, we set up matching experiments aimed at inferring causal relationships from longitudinal data which allows us to learn more about the combined effect of social network connectivity and the process of quality production on user behavior.
Key findings from the analysis include the following:
-
•
Unlike popularity, quality is evenly distributed across the network. The resulting mismatch between talent and attention received leaves large portions of the most proficient users with little peer recognition. Users who produce high-quality content but receive little social feedback tend to stay active only for short periods.
-
•
The level of user-generated quality is correlated with individual social connectivity, which causes a majority illusion effect: users are exposed to images whose average beauty is considerably higher than the average beauty of photos in the platform.
-
•
Users tend to be assortatively connected with others who produce pictures with similar beauty levels to their own. We find that this network property is partly credited to influence (following talented people increases one’s content beauty in the near future) and by the instability of social connections with high imbalance of contributed qualities (users tend to become inactive or churn out if the quality of their neighbors’ photos is substantially higher or lower than their own).
The outcomes of our study have practical implications in the domain of recommender systems. We sketch a simple proof-of-concept of a social link recommender algorithm that maximizes the beauty flow while limiting the beauty imbalance between friends (7). Simulations show that this simple strategy balances beauty supply and demand, increasing the level of social inclusion in the class of talented yet unpopular users.
2. Related Work
Computational Aesthetics. With this work, we build on recent literature exploring the possibility of measuring the intrinsic visual quality of images. Previous related work belongs to the research field of computational aesthetics, a domain in which computer vision is used to estimate image beauty and quality. Traditional aesthetic prediction methods are based on handcrafted features reflecting the compositional characteristics of an image. Datta et al. (Datta et al., 2006) and Ke et al. (Ke et al., 2006) were pioneers in this field, with their early work on training classifiers to distinguish amateur from professional photos. Researchers have produced increasingly more accurate aesthetic models by using more sophisticated visual features and attributes (Nishiyama et al., 2011; Dhar et al., 2011), looking at the contribution of semantic features (Marchesotti et al., 2011; Murray et al., 2012), and applying topic-specific models (Luo and Tang, 2008; Obrador et al., 2009) and aesthetic-specific learning frameworks (Wu et al., 2011). Similar hand-crafted features have successfully been employed to predict higher-level visual properties, such as image affective value (Machajdik and Hanbury, 2010), image memorability (Isola et al., 2011), video creativity (Redi et al., 2014b), and video interestingness (Redi and Merialdo, 2012; Jiang et al., 2013). Such hand-engineered features are of crucial importance for computer vision frameworks requiring interpretability. Recently, Convolutional Neural Networks (CNNs) have become a very popular alternative to hand-crafted features in the computer vision domain, due to their impressive performance on image analysis tasks (Russakovsky et al., 2015). The few pieces of work that tested CNNs for aesthetic scoring have done so on professional image corpora (Lu et al., 2014; Mai et al., 2016; Kong et al., 2016). In this work, we develop a CNN-based aesthetic predictor and compare its performance to existing work and to human evaluation through a crowdsourcing experiment.
Media Content Quality and User Experience. Similar to our work, several user studies in controlled lab settings have evaluated how quality affects user experience in relation to different types of media content. Gulliver et al. (Gulliver and Ghinea, 2006) found that video frame rate and network characteristics such as bandwidth and video topic impact user perception of information quality. Bouch et al. explored the importance of contextual and objective factors for media quality of service (Bouch et al., 2000), and Ceaparu et al. found causes of user frustration in web browsing, e-mail, and word processing (Ceaparu et al., 2004). In this work we explore the impact of visual aesthetic quality in online social networks. Past research has demonstrated the importance of visual aesthetics in improving user satisfaction and usability of web pages (Lavie and Tractinsky, 2004; De Angeli et al., 2006). In the context of online advertising, researchers have found that image quality properties can impact the user experience of the ad viewed (Zhou et al., 2016). Aesthetically appealing preview thumbnails increase the clickthorough probability of a video (Song et al., 2016). In recent work, Schifanella et al. showed how existing features for aesthetics, embedded in topic-specific aesthetic models, can be used to surface beautiful but hard-to-find pictures and that content quality is only weakly correlated with its popularity (Schifanella et al., 2015). We build on such work to analyze how quality production and consumption are related to the social network topology at scale.
Networks and Media Diffusion. Bakshy et al. examined the role of social networks in information diffusion with a large-scale field experiment where the exposure to friends’ information was randomized among the target population (Bakshy et al., 2012). They found that users who are exposed to friends’ social updates are significantly more likely to spread information and do it sooner than those who are not exposed. They further examine the relative role of strong and weak ties in information propagation, showing that weak ties are more likely to be responsible for the propagation of novel information. Social exposure, assortative mixing, and temporal clustering are not the only factors that drive information diffusion and influence. Aral et al. studied the effect of homophily in explaining such evidence (Aral et al., 2009). They developed a dynamic matched sample estimation framework to distinguish influence and homophily effects in dynamic networks, and they applied it to a global instant messaging network of 27.4 million users. Stuart addressed the problem of estimating causal effects (Stuart, 2010) using observational data, and explained how to design matching methods that replicate a randomized experiment as closely as possible by obtaining treated and control groups with similar covariate distribution. Those type of techniques are increasingly used being used to analyze digital traces (Althoff et al., 2017); we leverage them in our work too.
3. Dataset
Flickr is a popular photo-sharing platform on which users can upload a large number of pictures (up to 1 TB), organize them via albums or free-form textual tags, and share them with friends. Users can establish directed social links by following other users to get updates on their activity. Since its release in February 2004, the platform has gathered almost 90 million registered members who upload more than 3.5 million new images daily111This figure includes public and private photo uploads —http://bit.ly/1LjaTBT.
We collected a sample of the follower network composed of the nearly public Flickr profiles that are opted-in for research studies and by all the following links incident to them. For each profile in the sample, we get the complete information about the photos they upload (around 15B in total), the favorites their photos receive from other users, and the groups they are subscribed to. Every piece of information is annotated with timestamps that enable the reconstruction of the full temporal profile of a user’s public activities. The whole data spans approximately 12 years, starting from the debut of the service in 2004 until March 2016.
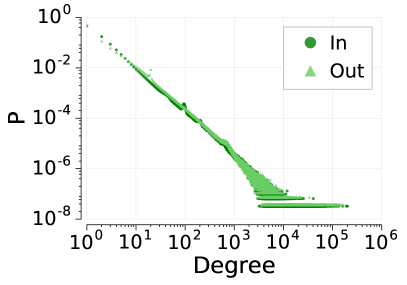
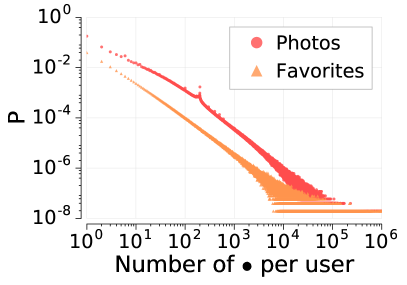
The distributions of the main activity and popularity indicators, along with their average values (), are shown in Figure 1. As expected, all distributions are broad, with values spanning several orders of magnitude.
4. Scoring Image Beauty
The first step towards a complete characterization of aesthetic quality in the Flickr network is to quantify beauty at the image level. To do so, we trained a deep neural network to produce a pixel-based aesthetics score. To boost performance, this network was pre-trained on a large-scale supervised image recognition task, and then the final layers were fine-tuned on our aesthetics estimation task (Girshick et al., 2014)
Training vs Fine-tuning. Deep neural network architectures are essentially layers of artificial neurons that progressively abstract the input data (the image pixels) into an output network response (the predicted category of the input image). In the training phase, network parameters are tuned in order to maximize metrics such as category prediction accuracy. Given the number of parameters involved in such complex architectures, effectively training neural networks is typically a long, expensive process. A common practice used to speed-up the training process is called fine-tuning, where the last layers of a trained network are modified and re-trained for a new task. In addition to making training more efficient, fine-tuning enables knowledge transfer from the original training data to the new task, improving overall performance. In our case, we start with a network designed for object detection, and then fine-tune it for the task of aesthetic scoring. This allows the aesthetic network to retain some information about the semantic nature of the objects depicted in the image, thus making the system aware of the subject depicted, which is crucial to the correct assessment of a picture’s aesthetic value. As a matter of fact photographic theory (Freeman, 2007) shows that different aesthetic criteria apply to different subjects: for example, specific photographic techniques should be used when taking pictures with human subjects (Hurter, 2007). Such observations were confirmed by several research works in computational aesthetics (Luo et al., 2011; Obrador et al., 2012; Redi et al., 2015; Mai et al., 2016), which showed that subject-aware aesthetic scorers outperform traditional subject-agnostic aesthetic frameworks.
Training on Object Detection. We start with a network pre-trained for object detection. The architecture and training process for this network are similar to the reference model proposed by Krizhevsky et al. (Krizhevsky et al., 2012). However, we introduce a few fundamental changes. We doubled the size of the fc6 (second-last) layer from 4096 to 8192. We also used a final fc8-layer consisting of 21841 units (instead of 1000), corresponding to the complete collection of annotated objects in the ILSVRC ImageNet dataset (Russakovsky et al., 2015). We found that for the purpose of pre-training, predicting all objects was more effective than just using the standard 1000 categories typical in the ILSVRC challenges. This also allowed us to use the complete ImageNet dataset of about 14 million images.
Fine-Tuning on Aesthetic Scoring. After pre-training on the ImageNet classification task, we fine-tune the network for the aesthetic scoring task. The training set for the aesthetic quality classification task is an internal dataset created using a proprietary social metric of image quality based on Flickr’s user interaction data, that has proved to correlate closely with subjective assessments of aesthetic quality. We rank all images from the YFCC100MM dataset (Thomee et al., 2016) according to this metric and then create buckets of “low quality”, “median quality”, and “high quality” by sampling images from the bottom 10-percentile, the middle 10-percentile, and the top 5-percentile respectively. The aesthetic classification task requires the network to assign images to the right quality buckets. We then proceed to fine-tuning, replacing the final layer of the object detection network with the 3-way aesthetic quality classification task. This means that the output layer is made of 3 neurons, one for the low category, one for the medium category, and one the for high quality category. Initially, we fine-tune just the final fully connected layer; after convergence, we fine-tune the whole network.
Network Evaluation. The output layer of the network yields three scores via softmax—these correspond to the probabilities of a photo’s “low” (), “medium” (), and “high” () quality. Each probability is the output of the corresponding neuron. Collectively, the scores correspond to the output of a softmax function evaluating the categorical probability distribution over the 3 possible outcomes: low, medium, and high. The three scores (in the range ) sum up to 1. In empirical evaluations, we noticed that the per-class network accuracy is higher for images in the low and high quality categories. We therefore design our continuous scoring formula by considering the output of the neurons corresponding to the low and high classes only, namely and , respectively. We combine these two into a single aesthetic score by subtracting the low quality probability from the high quality probability, followed by normalization to the range [0,1]:
| (1) |
The network achieves a final single-crop test accuracy of 62.5%, almost twice the accuracy of a random classifier. To further verify the performance of our approach, we compare it with state-of-the-art methods for automatic aesthetic assessment. We fine-tune the network with AVA, one of the most widely-used benchmarking datasets (Murray et al., 2012). Following existing work, we re-train the network for binary aesthetic classification, a simpler task compared to the 3-way decision we use, and achieve a classification accuracy of 77.6%, thus in line with the most recent state-of-the-art on the same dataset, which stands between 75% and 79%, depending on the training and test setup (Lu et al., 2014; Jin et al., 2016; Kong et al., 2016; Mai et al., 2016).
Classification vs. Regression. We tested the possibility to predict a continuous aesthetic score using regression: we obtained a continuous aesthetic score for each sample in our training set by placing the categorical annotations on a continuous scale and normalizing in the range [0,1]; we designed the output layer to contain one single neuron predicting the aesthetic score; we trained to minimize Euclidean loss. Although this approach has been found to be effective by Kong et al. (Kong et al., 2016), we found in empirical evaluations that this approach is less effective than our proposed methodology. As a matter of fact, our accuracy on the AVA dataset (77.6%) is 5 points higher than the regression-based framework proposed by Kong et al. (Kong et al., 2016) (72% for the regression based on visual data only).
5. Crowdsourcing Beauty Assessment


In addition to the standard performance test on benchmarking datasets, we further evaluate the effectiveness of the aesthetic network with a crowdsourcing experiment. We ask people to evaluate pictures in terms of their beauty, and then compare the human judgments to the aesthetic score predicted by our framework. To design our experiment, we draw inspiration from the image beauty assessment crowdsourcing experiments conducted by Schifanella et al. (Schifanella et al., 2015).
Crowdsourcing tasks are complex and can be influenced by unpredictable human factors (Mason and Suri, 2012). Modern crowdsourcing platforms offer control mechanisms to tune the annotation process and enable the best conditions to get high-quality judgments. To annotate the beauty of our images, we use CrowdFlower222http://www.crowdflower.com/, a popular crowdsourcing platform that distributes small tasks to online contributors in an assembly line fashion.
Data selection. To help the contributor to assess the image beauty more reliably, we build a photo collection that represents the full popularity spectrum, thus ensuring a diverse range of aesthetic values. To do so, we identify three popularity buckets obtained by logarithmic binning over the range of number of favorites received. We refer to them as tail (), torso (), and head () to identify the characteristic segments of the broad distribution. From the validation set used to evaluate the aesthetic network, we randomly sample 1000 images from each bucket. Images from such diverse popularity levels are also likely to take a wide range of aesthetic values, thus ensuring aesthetic diversity in our corpus, typically very important for the crowdsourcing of reliable beauty judgments (Redi et al., 2014a).
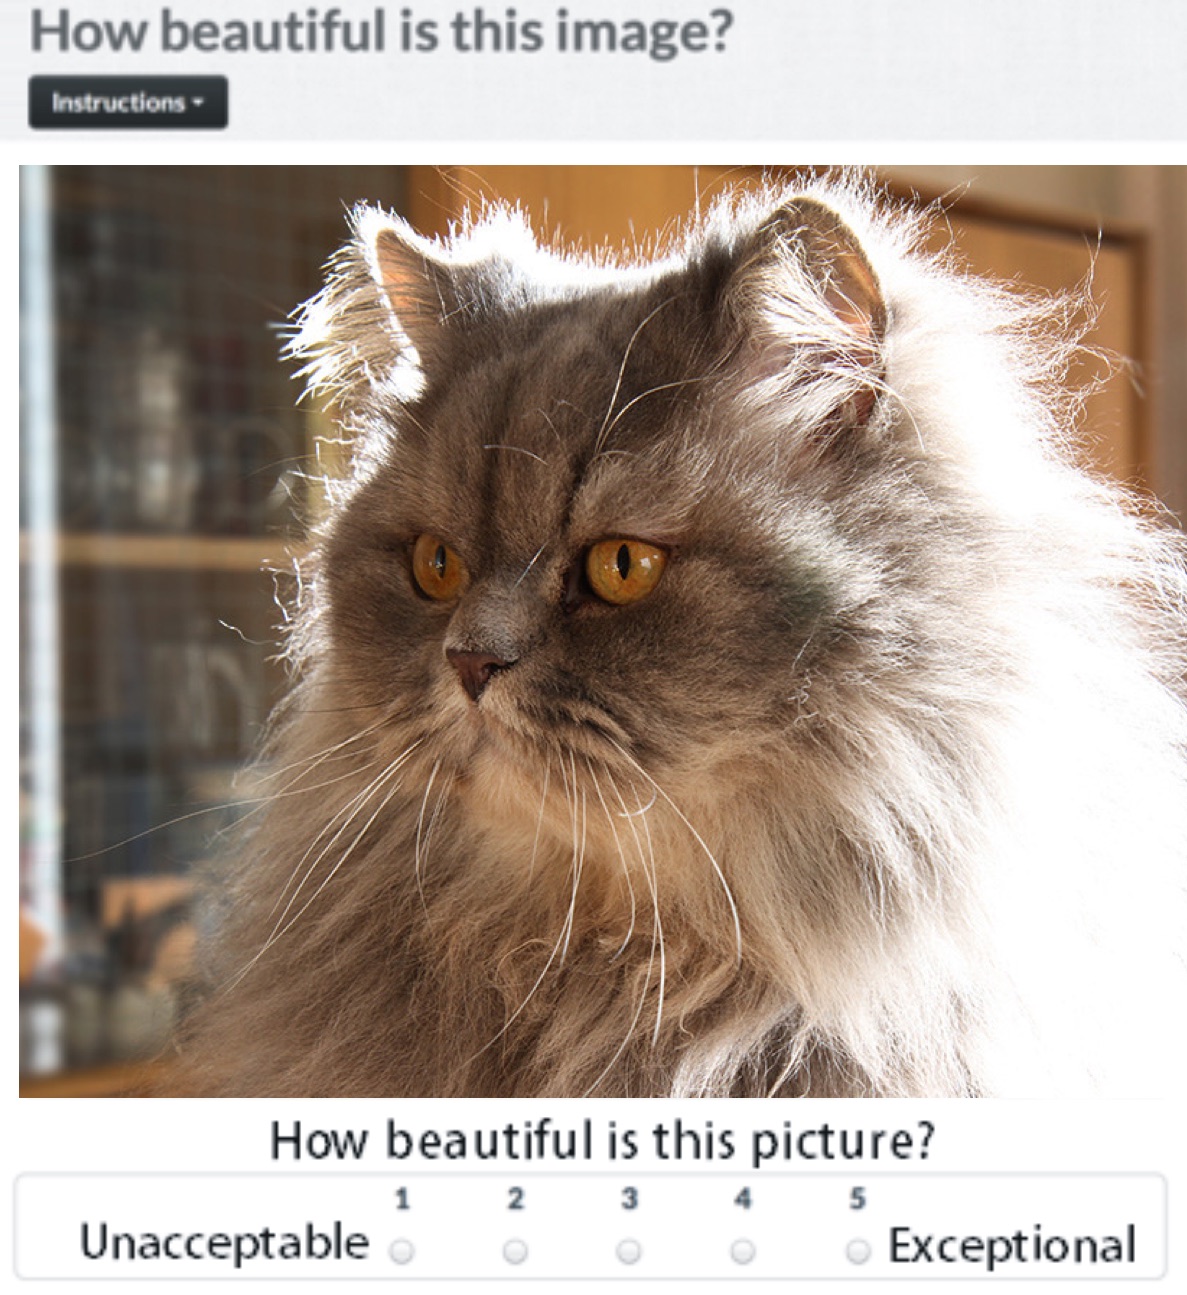
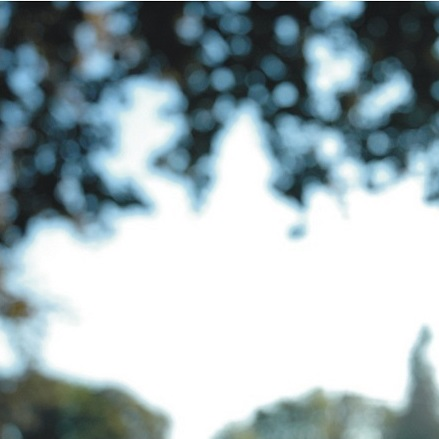
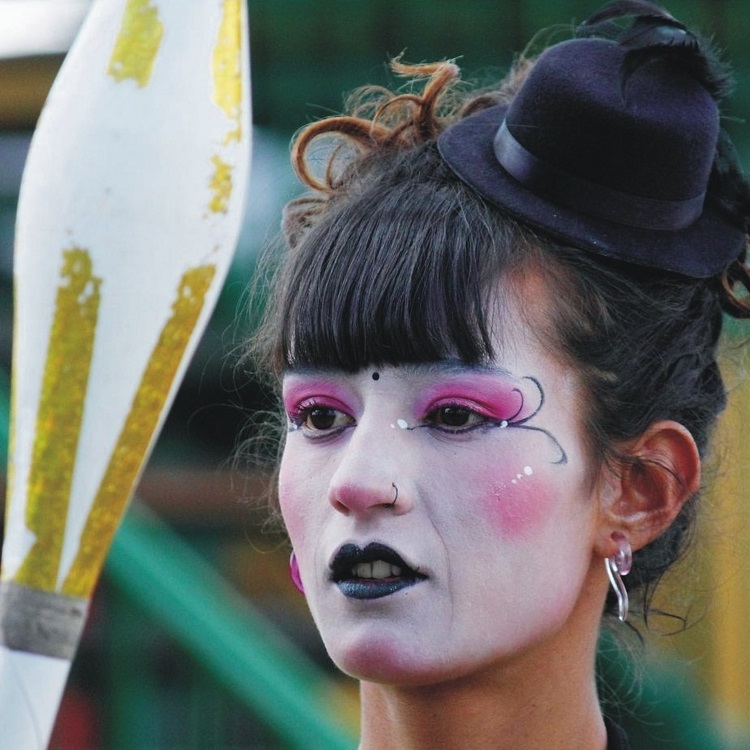
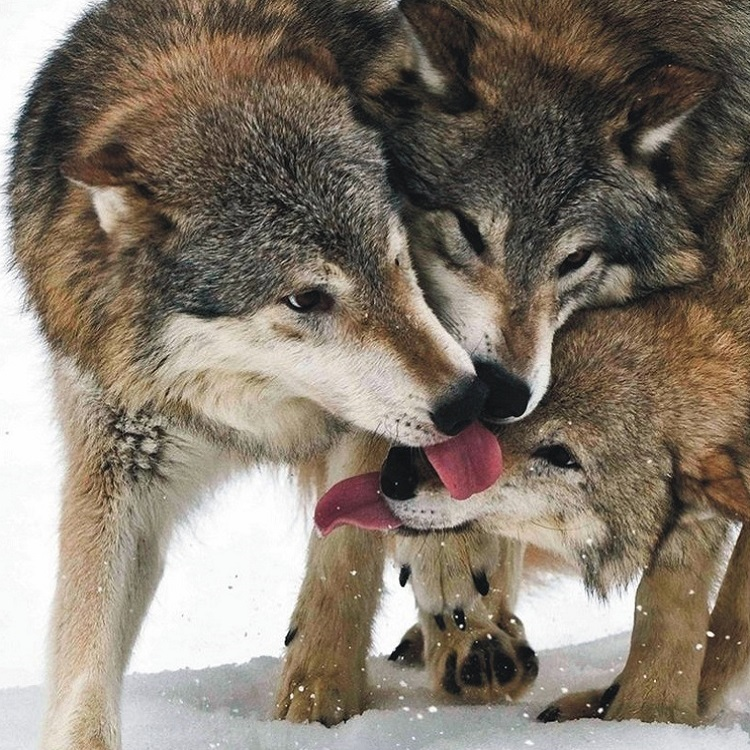
Crowdsourcing task setup. The task consists in looking at a number of images and evaluating their aesthetic quality. At the top of the page we report a short description of the task and we ask to answer the question “How beautiful is this image?” (Figure 2). The contributor is invited to judge the intrinsic beauty of the image and not the appeal of its subject; for example, artistic pictures that capture non-conventionally beautiful subjects (e.g., a spider), should be considered beautiful. Out of all the possible rating scales commonly used in crowdsourcing (Fu et al., 2014), it has been shown that the 5-point Absolute Category Rating (ACR) scale is good way to collect aesthetic preferences (Siahaan et al., 2013). We therefore ask contributors to express their judgments by selecting one out of 5 aesthetic categories from “Unacceptable” to “Exceptional”. To guide the contributor in its choice, two example images for each grade are shown (Figure 3). Examples are Flickr images that have been unanimously judged by three independent annotators to be clear representative instances of that beauty grade. Below the examples, the page contains 5 randomly selected images to be rated. The images in each page are randomly selected and displayed in an approximate equally-large size to minimize any skew in the perception of image quality (Chu et al., 2013; Fu et al., 2014).
Quality control. To maximize the quality of human judgments, we apply several controls on the contributors’ input. First, we open the task only to Crowdflower contributors with an “excellent” track record on the platform (responsible for the of monthly CrowdFlower judgments). We also limit the task to contributors from specific countries333Australia, Austria, Belgium, Denmark, Finland, France, Germany, Ireland, Italy, Netherlands, Poland, Spain, Sweden, United Kingdom, United States, to ensure higher cultural homogeneity in the assessment of image beauty (Hagen and Jones, 1978; Russell, 1994; Miyamoto et al., 2006; Dewar et al., 2007; Yanai and Qiu, 2009). Second, we cap the contributions of each worker to a maximum of 500 judgments to prevent potential biases introduced by the predominance of a small group of active workers. Last, we discard all the judgments of contributors who did not annotate correctly at least 6 out of 8 Test Images that are presented to them in an initial Quiz page and randomly throughout the task, disguised as normal units. Similar to the examples, Test Images are Flickr pictures that have been unanimously judged by three annotators to be clear representative instances of a beauty score.
Agreement. Each photo receives at least 5 judgments by as many independent contributors. Despite aesthetics assessments having a strong subjective component, we register a good level of agreement between annotators, in line with previous work on image beauty (Schifanella et al., 2015). The average percentage of matching annotations over 5 judgments is . When judgments do not match exactly, they usually cluster around two consecutive scores; the average standard deviation around the average score is , less than half point. In alternative to matching, we also compute Cronbach’s , a widely-adopted metric to assess inter-rater agreement on aesthetics tasks (Siahaan et al., 2013). The Cronbach’s coefficient is , a value that falls in a range that is commonly considered a Good level of inter-rater consistency (Bland and Altman, 1997).
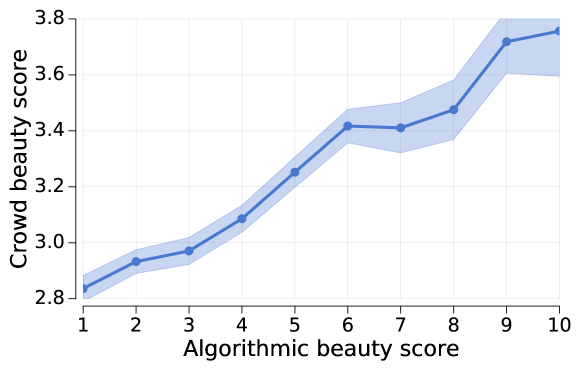
Results. Having collected reliable annotations on 3,000 validation images, we test the aesthetic network predictions relative to the ground truth as follows. We are interested in a predicted score that, regardless of its range or distribution, preserves the ranking of the original beauty scores assigned by human annotators. To check that, we compute the Spearman rank correlation coefficient between the predicted score and the crowdsourced score. We find a high correlation (with ), which suggests that our automatic aesthetic scoring method is an effective proxy of human aesthetic judgment. To further dig into this intuition, we partition the validated images into 10 equally-spaced intervals of predicted aesthetic score (i.e., ). We then compute the average crowd-sourced beauty score for all images in each bucket. Figure 4 shows that the average crowdsourced score linearly increases with the predicted beauty decile, further confirming that our aesthetic framework performs comparably to human evaluation on this task.
Additionally, we test the level of agreement of the algorithmic beauty prediction with the judgment of human labeler using the state of the art approach proposed by Ye et al. (Ye et al., 2017). Their evaluation method, inspired by the work on consensus methods by Dawid and Skene (Dawid and Skene, 1979), has been used to assess the robustness of crowdsourced affective data and can be used to estimate how much machine-generated labels can accurately mimic the human judgments. We apply the method to the human-generated beauty scores and found an average reliability score of , with peaks of , much higher than the reliability of a random annotator (to obtain this number, we added to the pool of annotators a fake annotator giving random judgments). Next, we re-scale the continuous scores predicted by the aesthetic network over a discrete 5-point scale, in order to make machine predictions comparable to human labels. We add the scaled predictions to the previous list of judgments by treating the machine-generated scores as the output of an additional annotator. We re-calculate reliability of all annotators, including the machine: we find that the reliability of the machine judgments stands at , in line with the average reliability score.
6. Network Effects
While previous work has studied beauty at the picture level, our large-scale rating of image beauty further enables us to analyze the how beauty is produced over a large social network. In the following, we will characterize the beauty of a user as the average beauty of all of ’s public photos. We will refer to this score as user beauty or user quality, for brevity. When time is relevat to the analysis, we will use to denote the average beauty of pictures posted by user during week and to denote ’s photos average beauty until week . Although summarizing the quality production of a user with a single indicator is limiting, it helps to simplify the analysis that follows. In future work we plan to consider more complex quality profiles that include, for example, the variance of photo quality.
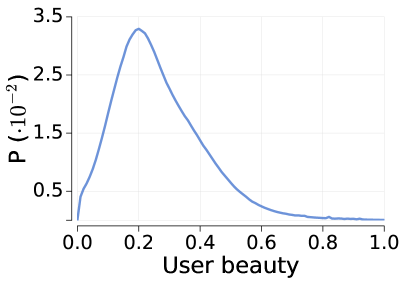
Unlike the heavy-tailed distributions of activity and popularity indicators (Figure 1), the user beauty is bell-shaped distributed, with a slightly heavier right tail (Figure 5, left). This leads to a mismatch between the ability to produce high-quality content and the social attention received by the community. As a result, we observe a more marked inequality in the distribution of the average number of favorites per photos across users than in the distribution of average user quality (as measured by the Gini index, Figure 5, right). This finding is in line with previous work on a smaller data sample (Schifanella et al., 2015) showing that high-quality Flickr pictures are distributed across different ranges of popularity.
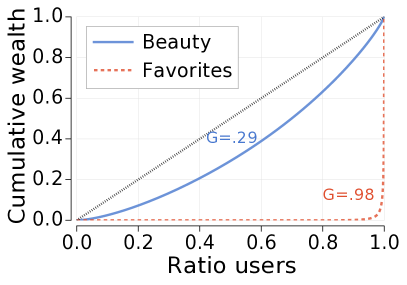
In other words, this heavy imbalance reveals that a large number of users who post high-quality photos receive very little social attention. Next, we map the average user beauty on the Flickr follower network to further investigate the unexplored relationship between user beauty and social connectivity patterns. In particular, we are interested to shed light on two unexplored matters: i) how the quality is distributed over the network (6.1) and ii) the causal impact that the quality users are exposed to has on their own activity and engagement (6.2). These issues are crucial to managers of online communities, who aim to provide all users with high-quality content and retain them as long as possible. However, those could not be addressed in the past due to the scarcity of large-scale data suitable for such analysis and the lack of reliable and efficient tools to measure content quality.
6.1. Distribution of quality over the social network
Different activity indicators of social media users tend to be correlated. This has been verified in multiple social media platforms, including Flickr, on a wide range of indicators, especially in relation to nodal degree (Mislove et al., 2007; Schifanella et al., 2010). We are interested in verifying whether the level of user quality is correlated to social connectivity or other activity indicators.
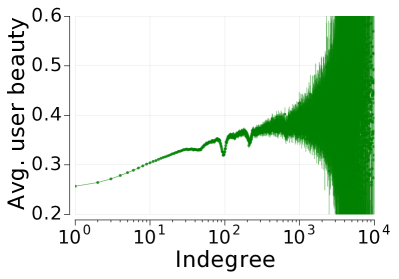
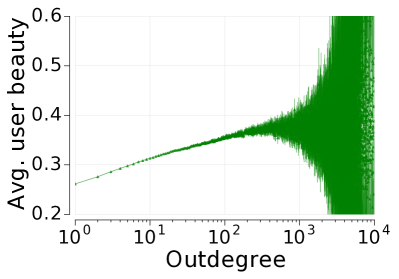
Q1: Is quality correlated with social connectivity? We compute the Spearman rank correlation between user beauty and nodal degree. We find A1: a small but positive correlation between user beauty, indegree (), and outdegree () (Figure 6). Beauty is also weakly associated with the average number of favorites received by a user () and exhibits a slightly negative correlation with the number of photos posted (), confirming that neither content popularity nor volume of contributions are strong determinants of quality.
The association between quality and connectivity can have higher-order effects. In online social networks, as in offline social environments, people lack global knowledge of the overall population’s characteristics, since their view of the external world is mediated by their direct social connections. This local constraint might lead to an over-representation of some rare population attributes in local contexts. This phenomenon has been observed in the form of the so-called friendship paradox (Feld, 1991; Hodas et al., 2013), a statistical property of networks with broad degree distributions for which on average people have fewer friends than their own friends. The paradox has been recently extended by the concept of majority illusion (Lerman et al., 2016), which states that in a social network with broad degree distribution and binary node attributes there is a systematic biased local perception that the majority of people (50% or more) possess that attribute even if it is globally rare. As an illustrative example, in a network where people drinking alcohol are a small minority, the local perception of most nodes can be that the majority of people are drinkers just because drinkers happen to be connected with many more neighbors than the average.
In our context, we are interested in measuring the presence of any skew in the local perception of the quality of user-generated content. So we ask:
Q2: Does the correlation between connectivity and quality creates a majority-illusion effect on user beauty?
To estimate the presence of any local perception skew, we calculate the proportion of users in a node’s neighborhood whose quality is above the global average quality of users in the network (, as per Figure 5 (left)), and compare it with the actual portion of users in the overall population with beauty above the global average444Because the overall distribution of quality has a shape that is close to normal, the results do not change considerably when using the median instead.. We find that A2: the majority illusion holds in our data sample. Overall, of the users typically produce content with above-average quality; however, of the population has more than of their friends with above-average quality. The phenomenon is very strong for the nearly of users who have more than of their neighbors falling into this category (double or more than what is expected). Nevertheless, the majority illusion does not imply that people preferentially connect to very talented users. Next, we investigate the relationship between the beauty levels of connected individuals.
Q3: Are social connections established between users with similar beauty?
A typical pattern found in several ecological and social networks is assortative mixing, namely the high likelihood of nodes to be connected to other nodes with similar properties. This propensity is gauged with the correlation spectrum (Barrat et al., 2008), a measure that puts in relation all the nodes that have a fixed value of a target indicator with the average value of the same indicator of their neighbors. By setting user beauty as the target indicator, we measure the correlation spectrum by computing the average neighbor beauty of all those users with a fixed user beauty , for all possible values of user beauty
| (2) |
where is user ’s beauty and are ’s out-neighbors. Figure 7 shows the trend of for all possible values of , obtained by partitioning the beauty range into 100 equally-sized bins. The positive slope of the curve (Spearman correlation ) reveals an assortative trend, which indicates that A3: users tend to be linked to accounts that publish photos with similar quality as their own. The trend is particularly clear for users with beauty in the range [0.08,0.6], which corresponds to of our sample’s population. To tell apart real any assortativity trend from statistical artifacts, we need to compare the results obtained on the real data with a suitable null model. When using a null model that randomly reshuffles the beauty values between all users, keeping unchanged their social connections, the trend is lost.
In summary, we have found that user quality correlates with individual connectivity, which in turn leads to a majority illusion phenomenon, where high-quality users are more visible than lower quality ones. Also, beauty is an assortative property, with user being preferentially connected to others with similar quality.
6.2. Network effects on user retention and quality production
6.2.1. Quality, network, and engagement
The assortative mixing of quality in the social network could be ascribed mainly to homophily or influence (Aiello et al., 2012). On one hand, users might preferentially connect to accounts that publish pictures with a similar quality to their own. This would seem natural in a platform like Flickr that hosts a heterogeneous user-base: semi-professional photographers might be interested in following users who are well-versed in the use of photographic techniques, whereas casual users might be following each other mostly for social reasons, unconcerned about aesthetic photo quality. On the other hand, pairs of users might be imbalanced in terms of their quality at the time they connect and close their quality gap later on, over time. For example, amateur photographers could follow professionals and learn new skills from them, thus improving the quality of their pictures.
The interplay between homophily, influence, and other factors leading to assortative mixing has been the subject of a number of studies (Anagnostopoulos et al., 2008; Crandall et al., 2008) that explored these phenomena on a wide range of user attributes (e.g., demographics, topical preferences). However, despite its crucial role in growing and maintaining user engagement (Dobrian et al., 2011), content quality has never been investigated in relation to such network properties. We aim to shed light on this relationship by answering two research questions that help explain the assortative trend we found.
Q4: Is the user beauty affected by the content produced by their social neighbors? The quality of content produced by users might be affected by the quality of the content that their social contacts produce. In particular, we hypothesize that, on average, the user beauty increases as an effect of the creation of a new social connection with a higher-beauty user.
Q5: Does a heavy quality imbalance between connected individuals affect their social engagement? We hypothesize that, on average, heavy imbalance between the user ebauty and the average beauty of its neighbors leads to a drop in engagement. This intuition is backed by one of the core principles of the Social Exchange Theory (Blau, 1964), which states that reciprocity is necessary to maintain a stable social relationship. When reciprocity fails consistently, at least one of the parts is likely to withdraw. In online social platforms, users join with specific expectations; when those are not met, the likelihood of abandonment is expected to rise. Specifically in the context of Flickr, talented photographers won’t feel their efforts being reciprocated if the quality of all other contributors’ content is mediocre, whereas casual photographers might feel overwhelmed if mostly surrounded by professionals and will more likely regress to a lurking state or even unsubscribe.
6.2.2. Matching experiments for causal inference
To answer the two questions above, we set up matching experiments aimed at inferring causality from the observational data. In natural experiments, estimating the statistical effect of a treatment on a population can be done through randomization. Provided that the population is sufficiently large, randomly allocating individuals across the treatment and control groups cancels the potential biases by equalising all the observable factors as well as unobserved variables that have not been explicitly accounted for. Without the possibility to run controlled experiments over the Flickr user-base, we need to infer causality from observational data. That is a much harder task (Aral et al., 2009; Shalizi and Thomas, 2011) because the benefit of randomization is lost, as the set of individuals who received the treatment is often pre-determined.
Matching experiments provide a way to reliably estimate the statistical effect of a treatment on a dependent variable from longitudinal data. The key intuition is to match the treated group with a control group whose members did not receive the treatment and are statistically indistinguishable (i.e., only marginally different) from the treated group on all observable covariates.
There are several ways to perform matching (Rosenbaum, 2002; Stuart, 2010; Olteanu et al., 2017) and to measure the equivalence between treatment and control groups. Here we borrow a framework introduced by Rubin (Rubin, 2001) and later summarized by Stuart (Stuart, 2010), which has been successfully used in other observational studies aimed at infer causality (Althoff et al., 2017). This framework assumes that and are somehow formed and provides a function to check their statistical equivalence. The two groups are said to be balanced on a covariate when the covariate’s standardized bias , namely the difference of its mean values () in the two groups divided by the standard deviation () in the treated group, is under a given threshold commonly set to . Formally:
| (3) |
The groups are overall balanced —and therefore indistinguishable, from a statistical point of view— only if they are balanced on all their covariates.
| Category | Covariate | SB |
|---|---|---|
| User | Indegree | |
| Outdegree | ||
| Number of photos uploaded | ||
| Number of group memberships | ||
| Number of favorites given | ||
| Number of favorites received | ||
| Average photo beauty | ||
| Weeks elapsed from join date | ||
| Neighbors | Number of photos uploaded | |
| Average photo beauty | ||
| New neighbors | Number of photos uploaded |
s
Algorithm to balance treatment and control groups. Given a treatment group , we set a greedy iterative procedure to select a corresponding balanced control group . At step 1, a candidate control group such that is selected from the set of non-treated units. At step , the standardized bias is computed for every covariate. For all the covariates that do not satisfy the balance constraint, we remove from the control group the elements that most contribute to the mismatch. Specifically, we cut off the of experimental units with the highest values of the covariate, when is negative, or with the lowest values, when is positive. At each iteration, further pruning could be required on different sets of covariates. The algorithm stops when the condition is satisfied by all the variables. The procedure does not have a theoretical guarantee to stop before pruning out all the elements of , in which case the algorithm should be restarted with a different seed control group. In our experiments we always observe convergence before .
Next, we describe how this framework is instantiated on our Flickr data. For these experiments, we have considered only users with at least 10 outgoing social links (i.e., followees) and who have uploaded photos in at least 12 distinct weeks (which implies they all have at least 12 photos each). This filtering step yielded a subset of 2.7M users.
6.2.3. The effects of neighbors’ beauty
Beauty inspires beauty. To answer question Q4, we use link creations as events to split users between treatment and control groups. We include in the treatment group users who have created a social link towards accounts with higher quality than their own and compare them with a control group whose members have connected to users with equal or lower quality.
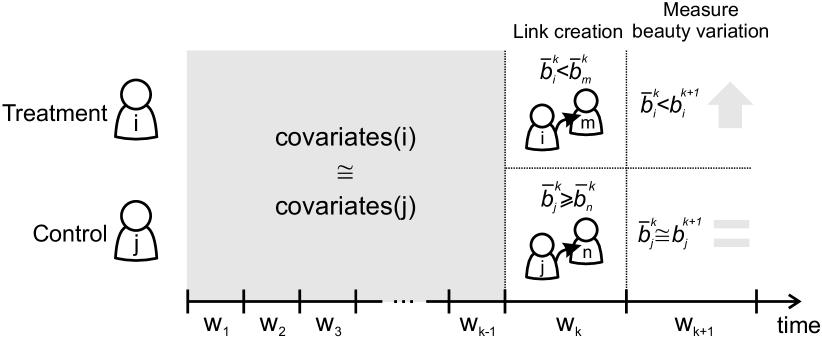
Operationally, we partition the timeline of events in our data into discrete slots of one week each. For each week , we iterate over the set of users who have been active during that week and have been active for at least 12 non-consecutive weeks before it. All users who added at least one link towards higher-quality users on that week are added to the control group . Among the remaining users in , we add to those who created any number of links during that week. Each element in the two groups is described with a vector of covariates that accounts for all the main aspects related to the popularity, activity, age, and quality of the users and to the quality and activity of their neighbors, measured at the beginning of week (Table 1). As we iterate over all the weeks in the timeline, users performing link creations during several weeks will be added multiple times to any of the two groups. This is acceptable from an experimental design perspective (Stuart, 2010): two versions of the same user profile at different times will have different vector of covariates, thus we will effectively consider them as two distinct user instances.
After the two groups are built, we execute the algorithm described in the previous section (§6.2.2) to obtain two statistically balanced groups. The matching algorithm yielded a pair of balanced groups with for all covariates and an average of 0.18. We then compare the two groups on an outcome variable that reflects our research question. For every user instance in or , we measure the quality variation of its produced content after the link creation event. This is done by computing the ratio between the beauty of the user’s photos uploaded in the week after the link creation () and the average beauty of all its photos posted prior to the link creation event (). When averaged over all the elements the group, the outcome variable is defined as follows:
| (4) |
Figure 8 depicts a simplified sketch of the matching experiment.
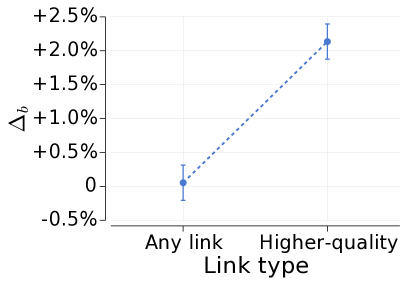
The measure of confirms our hypothesis: the treatment group experiences an average increase in , whereas no significant increase is found in the control group (Figure 9 left).
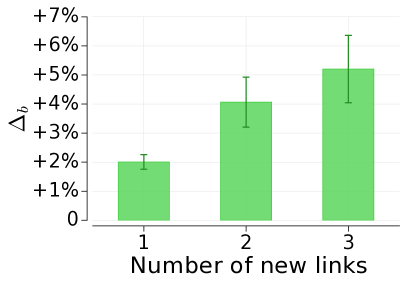
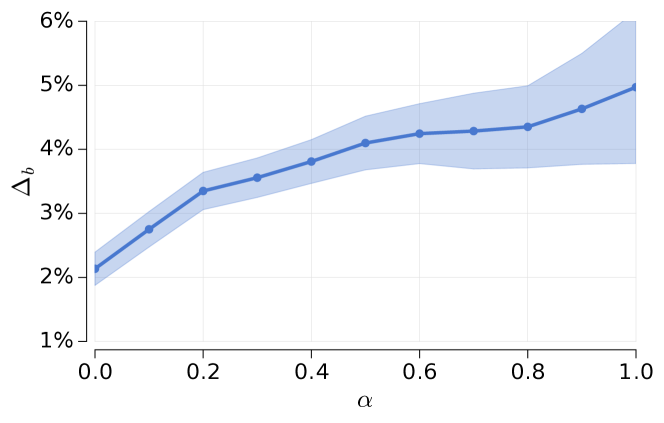
Using the same matching setup, we run two additional experiments with new pairs of groups. First, to assess how much the influence effect is augmented by the number of new connections, we run another matching experiment that includes in only users who created exactly links towards higher-quality users. We limit ourselves to because for larger we could not form matching pairs of treatment and control groups large enough to ensure statistical significance. We find that the influence effect accumulates with new connections, with diminishing returns (Figure 9, right). Last, to measure how much the beauty increase depends on the magnitude of the difference between the user’s beauty and that of its new neighbors, we restrict to the users whose new neighbors at week () have an average beauty that is times greater than their own:
| (5) |
We find that, the greater the beauty differential, the greater the increase —noticeable until , after which the confidence interval becomes too wide to make any assessment (Figure 10).
In summary, we found that A4: users’ produced quality increases as a result of new established connections with higher-quality users; the higher the number of those new contacts and the higher their quality, the stronger the effect.
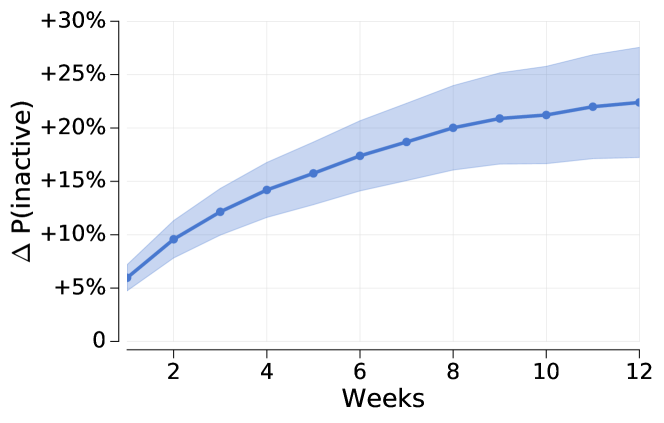
Beauty imbalance kills. Finally, to answer question Q5, we set up an experiment to ascertain if strong quality imbalance reduces user engagement. Also for this experiment we use a weekly-quantized timeline, but this time we partition users among and based on their existing neighbor set rather than on the new connections they create. For every week-user pair we measure the average beauty of ’s full neighbor set at week , namely as defined in Equation 6. We measure how much the average neighbor beauty deviates from the user beauty
| (6) |
If the two quantities are in the same close range (), we add the user to . Else, if the difference is substantial —namely or more ()— we add it to . We then measure the proportion of users in each group who remain inactive (i.e., no photo uploads) for consecutive weeks after week and compute the ratio between the values for the two sets () to measure the relative increment in treatment over control. We observe that the treatment group has higher probability of inactivity that grows from to in the first 12 weeks (Figure 11). In conclusion, we find that A5: people exposed to photos that deviate too much, in terms of quality, from their own contributed content, are more likely to become disengaged in the future.
7. Beauty-based Link Recommender
Classic link recommendation approaches based on the graph structure (e.g., common neighbors and all its variations) tend to suggest popular and very connected users (Su et al., 2016), thus increasing the linkage to—and consequently the level of attention on—already well-regarded individuals, keeping potential new talents away from the spotlight. However, since connectivity and user quality are largely orthogonal, algorithms that favor highly-connected users won’t necessarily provide adequate visibility to high-quality content.
This point is made particularly evident if we group users according to the combination of their popularity and produced quality. We cluster Flickr users according to three variables: content quality (average beauty of the user’s photos), popularity (average number of favorites per photo), and connectivity (number of followers). Given the diversity in terms of range and distributions of such variables, we first log-transform their values and then normalize them to the range . Next, to identify groups of photographers with similar characteristics, we use K-means clustering over these dimensions. We vary K from 2 to 10, and select according to the gap statistic (Tibshirani et al., 2001). The cluster centroids are reported in Table 2. Four classes of users emerge:
-
(1)
Low Quality: The biggest cluster contains almost half of the users. It corresponds to the long tail of “beginner photographers” who produce average-to-low quality content, with limited activity and low connectivity in the network.
-
(2)
Forlorn Beauty: The second biggest cluster gathers excellent photographers (highest average beauty value among the clusters considered) who receive very little attention from other Flickr users.
-
(3)
Regular Users: The regular semi-professional photographer on Flickr, sharing average-to-high quality pictures. These users are characterized by a moderate popularity within the network.
-
(4)
Flickr Superstars: The smallest cluster groups together all those professional photographers (beauty level similar to the Forlorn Beauty cluster) who are the foundation of the Flickr network, with many favorites and followers. Typically, these Superstars are the ones who appear in showcase pages such as the Flickr Explore555https://www.flickr.com/explore.
| %users | beauty | fav/photo | connects | |
|---|---|---|---|---|
| Low quality | 41.2% | 0.17 | 0.00 | 0.06 |
| Forlorn beauty | 28.1% | 0.42 | 0.01 | 0.10 |
| Regular user | 22.1% | 0.25 | 0.01 | 0.21 |
| Superstar | 8.6% | 0.42 | 0.15 | 0.35 |
| Low | Forlorn | Regular | Superstar | |
|---|---|---|---|---|
| photo count | 1060 | 200.4 | 1869 | 822.4 |
| time on platform | 104.4 | 84.68 | 187.0 | 198.3 |
The clustering results confirm that the talent of a large portion of the user-base —more that of the overall population— remains largely untapped, despite its high skill level (as evidenced by the high average beauty value). This group of users is associated with a lower time on platform, measured as the number of weeks with at least one photo upload (Table 3). This gives further support to the intuition that photographers who do not receive adequate recognition for their contributed value tend to churn out sooner. Furthermore, their activity in terms of number of pictures uploaded is limited (the lowest compared to other user classes), thus reducing the flow of incoming high-quality content in the platform.
Link recommender systems oblivious to quality will disproportionately recommend Superstar users because they are very popular and well-connected. By doing so, users will be exposed to new appealing pictures because recommended contacts produce beautiful photos on average. However, this strategy has two major limitations. First, it reinforces the rich-get-richer phenomenon, depriving the users in the Forlorn beauty class of the attention they deserve by directing it all to the small core of popular users. Last, it worsen the risk of very imbalanced connections: users who post lower-quality pictures will be mainly recommended contacts with considerably higher beauty. This is an undesirable outcome because, as we have shown earlier, accumulating many unbalanced connections increases the risk of inactivity and churn-out.
Next, building on our previous findings, we contribute to address these limitations by sketching a simple link recommendation strategy that i) rebalances the distribution of attention to give recognition to valuable contributors otherwise forgotten, and ii) increases the chances of a user to access new high-quality content without aggravating the quality imbalance between producers and consumers, which might cause engagement to drop in the long term.
To test this idea, we simulate a link recommendation task. We compare a classic friend-of-friend approach that recommends the contact with the highest number of common neighbors () with an alternative, quality-oriented algorithm that recommends the user at network distance 2 with the highest average beauty score () that is within a small range from the user beauty of the recommendation recipient (10%), in order to avoid quality imbalance. We simulate both approaches on a random sample of 400K photographers; each of them receives only one recommendation from each approach.
Let us define as the generic user who receives the recommendation, the recommended contact, and the list of recommendations . We compare the two approaches on the four indicators listed below.
-
•
Average user beauty of recommended contacts
. -
•
Average ratio between the user beauty of the recommendation recipient and the user beauty of the recommended contact ; a value of closer to 1 means a lower beauty imbalance since the two quantities in the fraction are closer.
-
•
Average number of favorites of recommended contacts
. -
•
Oortion of users in the Forlorn Beauty cluster in the recommendation list , where if the condition of its argument is true, 0 otherwise.
Following the findings from 6, we want to keep such imbalance low to avoid user churns on the long term. Moreover, having a higher ratio of Forlorn Beauty users in increases the exposure and potentially the future engagement of these high-quality photographers with little social attention. Figure 12 shows the results of the two approaches.
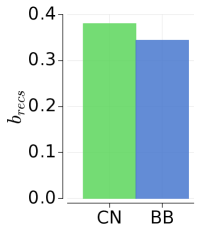
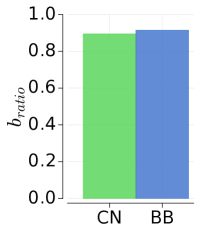
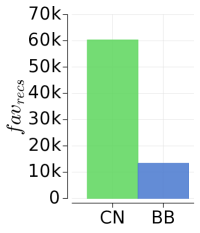
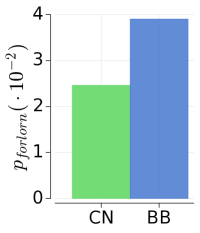
The approach selects contacts with beauty higher than , but only slightly higher, considering the strict 10% constraint in , which, by definition, will limit the maximum level of beauty for new contacts of a given node. On the other hand, ’s recommended users are 5 times more popular in terms of number of favorites. This introduces higher beauty imbalance () and does not reach Forlorn users as effectively: suggests 49% more users in that class, comparatively.
Even though such a simple algorithm is far from being a production-ready solution, the simulation experiment provides initial evidence that better balance in the content consumption dynamics could be easily introduced by complementing current systems with quality-based rules.
8. Discussion and Conclusions
Using a novel deep learning computer vision model trained on a vast image corpus from Flickr, we have conducted the first large-scale study on the relationship content quality with the social network structure.
8.1. Implications
Adopting popularity-driven policies to promote content and users in social networks is a fallacious way of growing healthy online communities (Cha et al., 2010). Nevertheless, for several years popularity has been one of the core elements of several online services including search, promoted content, and recommendations. For the first time, we have shown that it is possible to run at scale a reliable profiling of users that captures their contributed quality rather than their popularity. This can have direct practical impact not only in recommender systems, but in any application that need to retrieve, rank, or present images. Furthermore, our study about the notion of quality in combination to the network structure yields important theoretical implications in the domain of social network analysis and, more broadly, network science. We have shown that social relationships are not only homophilous, but tend also to be balanced in terms of the quality that the two endpoints produce. In line with the principles of the Social Exchange Theory, we provide empirical evidence that users who entertain strongly imbalanced social relationships in terms of the quality produced increase the risk of becoming inactive or churn out in the future. As we have shown in a simple proof of concept, next-generation link recommender systems could easily factor in the notion of quality imbalance to foster the creation of longer-lasting social ties.
8.2. Biases
The outcome of both the annotation task and the automated beauty scoring can be influenced by several types of biases.
We have developed the aesthetic scoring system by fine-tuning an existing neural network used for object detection. This choice is justified by computational efficiency, has been adopted in previous work, and complies with photographic theory on subject-specific aesthetic rules. Even though the image set we use to train our neural network is very large and diverse in terms of subjects, quality, and photographers, it may still contain biases that could be smoothened out by extending the training phase to multiple datasets of different nature. In future work we plan to conduct a more systematic evaluation of the biases that this approach might introduce when scoring pictures of different subjects.
The evaluation of image quality through online crowdsourcing might be affected by a number of unconscious biases originating by the personal and cultural background of the raters, the way the interface is presented, and the different subjects depicted in the photos. Although we have used a state-of-the-art framework to account for all these potential problems, a more thorough study focusing on residual biases would be desirable.
8.3. Limitations and future work
Our analysis scratches only the surface of this mostly unexplored research area.
Our causal inference analysis groups together similar users to get a balanced matching between control and treatment sets. That is convenient to measure causal effects globally but does not directly allow for a fine-grained analysis of how meaningful user groups (e.g., newcomers vs. professional users) are impacted. The extent to which the exposure to content quality has a different impact on those user categories is an interesting extension of this work.
The deep learning algorithm we use is very powerful but lacks explainability: in contrast with classic image aesthetic frameworks based on compositional features, it is not possible to determine why a picture has a given beauty score. Research in explainability in deep learning is still at an early stage, also in the sub-field of image aesthetics. Expanding the ability of our method to provide human-readable explanations of the beauty score is part of our planned future work.
We have described user quality with a single numeric indicator; multidimensional descriptors could add nuances to the characterization. We have studied the effect of link creation and nearest neighbors on the process of quality production; exploring a wider range of social structures and events could lead to further findings. Our experiments can determine the cause of some network dynamics (e.g., lower user engagement) but cannot provide reliable explanations about why those changes occur; further investigation, possibly including qualitative methods, could provide more clarity on the these dynamics. Last, our experimental setting unveils causality but it is not flexible enough to reveal changes in user quality over long periods of time. Our matching strategy is effective in comparing the effect of an event (e.g., link creation) on outcome variables measured right after the event occurs, but is not designed to study long-term effects. Even though treatment and control groups are checked to be statistically equivalent over all covariates at time , the likelihood that their equivalence is preserved after drops as time passes and this is why, to draw meaningful causal conclusions, it is safe to study only those outcomes (e.g., variation of user beauty) that occur right after . As a direct consequence, it becomes hard to provide a tangible interpretation in terms of user perception of some of the small, yet significant, short-term influence effects we have found (e.g., +2% in produced photo quality). In the future, we aim at applying more complex frameworks that can provide reliable causal inference on longer time spans.
Despite such limitations, we hope our work contributes to a better understanding of the evolutionary dynamics of social ecosystems.
References
- (1)
- Aiello et al. (2012) Luca Maria Aiello, Alain Barrat, Rossano Schifanella, Ciro Cattuto, Benjamin Markines, and Filippo Menczer. 2012. Friendship prediction and homophily in social media. ACM TWEB 6, 2, Article 9 (Jun 2012). http://doi.acm.org/10.1145/2180861.2180866
- Althoff et al. (2017) Tim Althoff, Pranav Jindal, and Jure Leskovec. 2017. Online Actions with Offline Impact: How Online Social Networks Influence Online and Offline User Behavior. In WSDM. ACM, New York, NY, USA, 537–546. https://doi.org/10.1145/3018661.3018672
- Anagnostopoulos et al. (2008) Aris Anagnostopoulos, Ravi Kumar, and Mohammad Mahdian. 2008. Influence and Correlation in Social Networks. In KDD. ACM. https://doi.org/10.1145/1401890.1401897
- Aral et al. (2009) Sinan Aral, Lev Muchnik, and Arun Sundararajan. 2009. Distinguishing influence-based contagion from homophily-driven diffusion in dynamic networks. PNAS 106, 51 (2009).
- Bakshy et al. (2012) Eytan Bakshy, Itamar Rosenn, Cameron Marlow, and Lada Adamic. 2012. The Role of Social Networks in Information Diffusion. In WWW. ACM. https://doi.org/10.1145/2187836.2187907
- Barrat et al. (2008) Alain Barrat, Marc Barthelemy, and Alessandro Vespignani. 2008. Dynamical processes on complex networks. Cambridge University Press.
- Bland and Altman (1997) J Martin Bland and Douglas G Altman. 1997. Statistics notes: Cronbach’s alpha. Bmj 314, 7080 (1997), 572.
- Blau (1964) P.M. Blau. 1964. Exchange and Power in Social Life. Wiley. https://books.google.it/books?id=qhOMLscX-ZYC
- Bouch et al. (2000) Anna Bouch, Allan Kuchinsky, and Nina Bhatti. 2000. Quality is in the Eye of the Beholder: Meeting Users’ Requirements for Internet Quality of Service. In CHI. ACM. https://doi.org/10.1145/332040.332447
- Ceaparu et al. (2004) Irina Ceaparu, Jonathan Lazar, Katie Bessiere, John Robinson, and Ben Shneiderman. 2004. Determining causes and severity of end-user frustration. International journal of human-computer interaction 17, 3 (2004).
- Cha et al. (2010) Meeyoung Cha, Hamed Haddadi, Fabrício Benevenuto, and Krishna P. Gummadi. 2010. Measuring user influence in Twitter: The million follower fallacy. In Proceedings of international AAAI Conference on Weblogs and Social (ICWSM).
- Chu et al. (2013) Wei-Ta Chu, Yu-Kuang Chen, and Kuan-Ta Chen. 2013. Size Does Matter: How Image Size Affects Aesthetic Perception?. In Proceedings of the 21st ACM International Conference on Multimedia (MM ’13). ACM, New York, NY, USA, 53–62. https://doi.org/10.1145/2502081.2502102
- Crandall et al. (2008) David Crandall, Dan Cosley, Daniel Huttenlocher, Jon Kleinberg, and Siddharth Suri. 2008. Feedback Effects Between Similarity and Social Influence in Online Communities. In KDD. ACM. https://doi.org/10.1145/1401890.1401914
- Datta et al. (2006) Ritendra Datta, Dhiraj Joshi, Jia Li, and James Z. Wang. 2006. Studying Aesthetics in Photographic Images Using a Computational Approach. In ECCV. Springer. http://dx.doi.org/10.1007/11744078_23
- Dawid and Skene (1979) Alexander Philip Dawid and Allan M Skene. 1979. Maximum likelihood estimation of observer error-rates using the EM algorithm. Applied statistics (1979), 20–28.
- De Angeli et al. (2006) Antonella De Angeli, Alistair Sutcliffe, and Jan Hartmann. 2006. Interaction, Usability and Aesthetics: What Influences Users’ Preferences?. In DIS. ACM.
- Dewar et al. (2007) Keith Dewar, Wen Mei Li, and Charles H. Davis. 2007. Photographic Images, Culture, and Perception in Tourism Advertising. Journal of Travel and Tourism Marketing 22, 2 (2007), 35–44. https://doi.org/10.1300/J073v22n02_03
- Dhar et al. (2011) S. Dhar, V. Ordonez, and T. L. Berg. 2011. High Level Describable Attributes for Predicting Aesthetics and Interestingness. In CVPR. IEEE, 8. https://doi.org/10.1109/CVPR.2011.5995467
- Dobrian et al. (2011) Florin Dobrian, Vyas Sekar, Asad Awan, Ion Stoica, Dilip Joseph, Aditya Ganjam, Jibin Zhan, and Hui Zhang. 2011. Understanding the Impact of Video Quality on User Engagement. In SIGCOMM. ACM. https://doi.org/10.1145/2018436.2018478
- Feld (1991) Scott L Feld. 1991. Why your friends have more friends than you do. Amer. J. Sociology (1991).
- Freeman (2007) Michael Freeman. 2007. The Photographer’s Eye: Composition and Design for Better Digital Photos. Vol. 1. Focal Press.
- Fu et al. (2014) Yanwei Fu, TimothyM. Hospedales, Tao Xiang, Shaogang Gong, and Yuan Yao. 2014. Interestingness Prediction by Robust Learning to Rank. In Computer Vision – ECCV 2014, David Fleet, Tomas Pajdla, Bernt Schiele, and Tinne Tuytelaars (Eds.). Lecture Notes in Computer Science, Vol. 8690. Springer International Publishing, 488–503. https://doi.org/10.1007/978-3-319-10605-2_32
- Girshick et al. (2014) Ross Girshick, Jeff Donahue, Trevor Darrell, and Jitendra Malik. 2014. Rich feature hierarchies for accurate object detection and semantic segmentation. In CVPR.
- Gulliver and Ghinea (2006) Stephen R Gulliver and Gheorghita Ghinea. 2006. Defining user perception of distributed multimedia quality. ACM TOMM 2, 4 (2006).
- Hagen and Jones (1978) Margaret A. Hagen and Rebecca K. Jones. 1978. Cultural Effects on Pictorial Perception: How Many Words Is One Picture Really Worth? In Perception and Experience, RichardD. Walk and Jr. Pick, HerbertL. (Eds.). Perception and Perceptual Development, Vol. 1. Springer US, 171–212. https://doi.org/10.1007/978-1-4684-2619-9_6
- Halvey and Keane (2007) Martin J. Halvey and Mark T. Keane. 2007. Exploring Social Dynamics in Online Media Sharing. In WWW. ACM. https://doi.org/10.1145/1242572.1242804
- Hodas et al. (2013) Nathan O. Hodas, Farshad Kooti, and Kristina Lerman. 2013. Friendship Paradox Redux: Your Friends Are More Interesting Than You. In ICWSM. AAAI.
- Hurter (2007) Bill Hurter. 2007. Portrait Photographer’s Handbook. Amherst Media, Inc.
- Isola et al. (2011) Phillip Isola, Jianxiong Xiao, Antonio Torralba, and Aude Oliva. 2011. What makes an image memorable?. In CVPR. IEEE.
- Jiang et al. (2013) Yu-Gang Jiang, Yanran Wang, Rui Feng, Xiangyang Xue, Yingbin Zheng, and Hanfang Yang. 2013. Understanding and Predicting Interestingness of Videos.. In AAAI.
- Jin et al. (2016) Xin Jin, Jingying Chi, Siwei Peng, Yulu Tian, Chaochen Ye, and Xiaodong Li. 2016. Deep image aesthetics classification using inception modules and fine-tuning connected layer. In Wireless Communications & Signal Processing (WCSP), 2016 8th International Conference on. IEEE, 1–6.
- Ke et al. (2006) Yan Ke, Xiaoou Tang, and Feng Jing. 2006. The design of high-level features for photo quality assessment. In CVPR. IEEE.
- Kong et al. (2016) Shu Kong, Xiaohui Shen, Zhe Lin, Radomir Mech, and Charless Fowlkes. 2016. Photo aesthetics ranking network with attributes and content adaptation. In European Conference on Computer Vision. Springer, 662–679.
- Krizhevsky et al. (2012) Alex Krizhevsky, Ilya Sutskever, and Geoffrey E Hinton. 2012. Imagenet classification with deep convolutional neural networks. In NIPS.
- Lavie and Tractinsky (2004) Talia Lavie and Noam Tractinsky. 2004. Assessing Dimensions of Perceived Visual Aesthetics of Web Sites. International Journal of Human-Computer Studie 60, 3 (2004).
- Lerman et al. (2016) Kristina Lerman, Xiaoran Yan, and Xin-Zeng Wu. 2016. The majority illusion in social networks. PloS one 11, 2 (2016).
- Lu et al. (2014) Xin Lu, Zhe Lin, Hailin Jin, Jianchao Yang, and James Z. Wang. 2014. RAPID: Rating Pictorial Aesthetics Using Deep Learning. In Multimedia. ACM, 10. https://doi.org/10.1145/2647868.2654927
- Luo et al. (2011) Wei Luo, Xiaogang Wang, and Xiaoou Tang. 2011. Content-based photo quality assessment. In ICCV. IEEE, 2206–2213.
- Luo and Tang (2008) Yiwen Luo and Xiaoou Tang. 2008. Photo and Video Quality Evaluation: Focusing on the Subject. In ECCV. Springer. https://doi.org/10.1007/978-3-540-88690-7_29
- Machajdik and Hanbury (2010) Jana Machajdik and Allan Hanbury. 2010. Affective image classification using features inspired by psychology and art theory. In Multimedia. ACM.
- Mai et al. (2016) Long Mai, Hailin Jin, and Feng Liu. 2016. Composition-preserving deep photo aesthetics assessment. In CVPR, Proceedings of the IEEE Conference on Computer Vision and Pattern Recognition. 497–506.
- Marchesotti et al. (2011) Luca Marchesotti, Florent Perronnin, Diane Larlus, and Gabriela Csurka. 2011. Assessing the aesthetic quality of photographs using generic image descriptors. In ICCV. IEEE.
- Mason and Suri (2012) Winter Mason and Siddharth Suri. 2012. Conducting behavioral research on Amazon’s Mechanical Turk. Behavior Research Methods 44, 1 (2012), 1–23. https://doi.org/10.3758/s13428-011-0124-6
- Mislove et al. (2007) Alan Mislove, Massimiliano Marcon, Krishna P. Gummadi, Peter Druschel, and Bobby Bhattacharjee. 2007. Measurement and Analysis of Online Social Networks. In IMC. ACM, 14. https://doi.org/10.1145/1298306.1298311
- Miyamoto et al. (2006) Yuri Miyamoto, Richard E. Nisbett, and Takahiko Masuda. 2006. Culture and the Physical Environment: Holistic Versus Analytic Perceptual Affordances. Psychological Science 17, 2 (2006), 113–119. https://doi.org/10.1111/j.1467-9280.2006.01673.x arXiv:http://pss.sagepub.com/content/17/2/113.full.pdf+html
- Murray et al. (2012) Naila Murray, Luca Marchesotti, and Florent Perronnin. 2012. AVA: A large-scale database for aesthetic visual analysis. In CVPR. IEEE.
- Nishiyama et al. (2011) Masashi Nishiyama, Takahiro Okabe, Imari Sato, and Yoichi Sato. 2011. Aesthetic quality classification of photographs based on color harmony. In CVPR. IEEE.
- Obrador et al. (2009) Pere Obrador, Xavier Anguera, Rodrigo de Oliveira, and Nuria Oliver. 2009. The Role of Tags and Image Aesthetics in Social Image Search. In WSM. ACM, 8. https://doi.org/10.1145/1631144.1631158
- Obrador et al. (2012) Pere Obrador, Michele A Saad, Poonam Suryanarayan, and Nuria Oliver. 2012. Towards category-based aesthetic models of photographs. Springer.
- Olteanu et al. (2017) Alexandra Olteanu, Onur Varol, and Emre Kiciman. 2017. Distilling the Outcomes of Personal Experiences: A Propensity-scored Analysis of Social Media. In CSCW. ACM, New York, NY, USA, 370–386. https://doi.org/10.1145/2998181.2998353
- Redi et al. (2014a) Judith Alice Redi, Tobias Hoßfeld, Pavel Korshunov, Filippo Mazza, Isabel Povoa, and Christian Keimel. 2014a. Crowdsourcing-based multimedia subjective evaluations: a case study on image recognizability and aesthetic appeal. In Sixth International Workshop on Quality of Multimedia Experience (QoMEX 2014). 29–34.
- Redi and Merialdo (2012) Miriam Redi and Bernard Merialdo. 2012. Where is the Beauty?: Retrieving Appealing VideoScenes by Learning Flickr-based Graded Judgments. In Multimedia. ACM. https://doi.org/10.1145/2393347.2396486
- Redi et al. (2014b) Miriam Redi, Neil O’Hare, Rossano Schifanella, Michele Trevisiol, and Alejandro Jaimes. 2014b. 6 seconds of sound and vision: Creativity in micro-videos. In CVPR. IEEE.
- Redi et al. (2015) Miriam Redi, Nikhil Rasiwasia, Gaurav Aggarwal, and Alejandro Jaimes. 2015. The Beauty of Capturing Faces: Rating the Quality of Digital Portraits. In IEEE International Conference on Automatic Face and Gesture Recognition 2015. IEEE.
- Rosenbaum (2002) Paul R Rosenbaum. 2002. Observational studies. In Observational Studies. Springer, 1–17.
- Rubin (2001) Donald B Rubin. 2001. Using propensity scores to help design observational studies: application to the tobacco litigation. Health Services and Outcomes Research Methodology 2, 3 (2001), 169–188.
- Russakovsky et al. (2015) Olga Russakovsky, Jia Deng, Hao Su, Jonathan Krause, Sanjeev Satheesh, Sean Ma, Zhiheng Huang, Andrej Karpathy, Aditya Khosla, Michael Bernstein, Alexander C. Berg, and Li Fei-Fei. 2015. ImageNet Large Scale Visual Recognition Challenge. International Journal of Computer Vision 115, 3 (2015). https://doi.org/10.1007/s11263-015-0816-y
- Russell (1994) James A. Russell. 1994. Is there universal recognition of emotion from facial expression? A review of the cross-cultural studies. Psychological Bulletin 115 (1994), 102–141.
- Schifanella et al. (2010) Rossano Schifanella, Alain Barrat, Ciro Cattuto, Benjamin Markines, and Filippo Menczer. 2010. Folks in Folksonomies: Social Link Prediction from Shared Metadata. In WSDM. ACM. https://doi.org/10.1145/1718487.1718521
- Schifanella et al. (2015) Rossano Schifanella, Miriam Redi, and Luca Maria Aiello. 2015. An Image Is Worth More than a Thousand Favorites: Surfacing the Hidden Beauty of Flickr Pictures. In ICWSM. AAAI.
- Shalizi and Thomas (2011) Cosma Rohilla Shalizi and Andrew C Thomas. 2011. Homophily and contagion are generically confounded in observational social network studies. Sociological methods and research 40, 2 (2011).
- Siahaan et al. (2013) Ernestasia Siahaan, Judith Alice Redi, and Alan Hanjalic. 2013. Beauty is in the scale of the beholder: a comparison of methodologies for the subjective assessment of image aesthetic appeal. In Proceedings of the 2nd ACM international workshop on Crowdsourcing for multimedia. ACM, 29–34.
- Song et al. (2016) Yale Song, Miriam Redi, Jordi Vallmitjana, and Alejandro Jaimes. 2016. To Click or Not To Click: Automatic Selection of Beautiful Thumbnails from Videos. In CIKM. ACM, New York, NY, USA, 659–668. https://doi.org/10.1145/2983323.2983349
- Stuart (2010) Elizabeth A. Stuart. 2010. Matching Methods for Causal Inference: A Review and a Look Forward. Statist. Sci. 25, 1 (02 2010).
- Su et al. (2016) Jessica Su, Aneesh Sharma, and Sharad Goel. 2016. The Effect of Recommendations on Network Structure. In WWW. International World Wide Web Conferences Steering Committee, Republic and Canton of Geneva, Switzerland, 11. https://doi.org/10.1145/2872427.2883040
- Susarla et al. (2012) Anjana Susarla, Jeong-Ha Oh, and Yong Tan. 2012. Social networks and the diffusion of user-generated content: Evidence from YouTube. Information Systems Research 23, 1 (2012).
- Thomee et al. (2016) Bart Thomee, David A Shamma, Gerald Friedland, Benjamin Elizalde, Karl Ni, Douglas Poland, Damian Borth, and Li-Jia Li. 2016. YFCC100M: The new data in multimedia research. Commun. ACM 59, 2 (2016).
- Tibshirani et al. (2001) Robert Tibshirani, Guenther Walther, and Trevor Hastie. 2001. Estimating the number of clusters in a data set via the gap statistic. Journal of the Royal Statistical Society 63, 2 (2001). https://doi.org/10.1111/1467-9868.00293
- Wu et al. (2011) Ou Wu, Weiming Hu, and Jun Gao. 2011. Learning to predict the perceived visual quality of photos. In ICCV. IEEE.
- Yanai and Qiu (2009) Keiji Yanai and Bingyu Qiu. 2009. Mining Cultural Differences from a Large Number of Geotagged Photos. In Proceedings of the 18th International Conference on World Wide Web (WWW ’09). ACM, New York, NY, USA, 1173–1174. https://doi.org/10.1145/1526709.1526914
- Ye et al. (2017) Jianbo Ye, Jia Li, Michelle G Newman, Reginald B Adams, and James Z Wang. 2017. Probabilistic Multigraph Modeling for Improving the Quality of Crowdsourced Affective Data. IEEE Transactions on Affective Computing (2017).
- Zhou et al. (2016) Ke Zhou, Miriam Redi, Andrew Haines, and Mounia Lalmas. 2016. Predicting Pre-click Quality for Native Advertisements. In WWW. International World Wide Web Conferences Steering Committee, Republic and Canton of Geneva, Switzerland, 299–310. https://doi.org/10.1145/2872427.2883053