The MOSDEF survey: a stellar mass-SFR-metallicity relation exists at **affiliation: Based on data obtained at the W.M. Keck Observatory, which is operated as a scientific partnership among the California Institute of Technology, the University of California, and NASA, and was made possible by the generous financial support of the W.M. Keck Foundation.
Abstract
We investigate the nature of the relation among stellar mass, star-formation rate, and gas-phase metallicity (the -SFR-Z relation) at high redshifts using a sample of 260 star-forming galaxies at from the MOSDEF survey. We present an analysis of the high-redshift -SFR-Z relation based on several emission-line ratios for the first time. We show that a -SFR-Z relation clearly exists at . The strength of this relation is similar to predictions from cosmological hydrodynamical simulations. By performing a direct comparison of stacks of and galaxies, we find that galaxies have dex lower metallicity at fixed and SFR. In the context of chemical evolution models, this evolution of the -SFR-Z relation suggests an increase with redshift of the mass-loading factor at fixed , as well as a decrease in the metallicity of infalling gas that is likely due to a lower importance of gas recycling relative to accretion from the intergalactic medium at high redshifts. Performing this analysis simultaneously with multiple metallicity-sensitive line ratios allows us to rule out the evolution in physical conditions (e.g., N/O ratio, ionization parameter, and hardness of the ionizing spectrum) at fixed metallicity as the source of the observed trends with redshift and with SFR at fixed at . While this study highlights the promise of performing high-order tests of chemical evolution models at high redshifts, detailed quantitative comparisons ultimately await a full understanding of the evolution of metallicity calibrations with redshift.
Subject headings:
galaxies: abundances — galaxies: high-redshift1. Introduction
The formation and growth of the dark matter structure of the universe is now well-understood because of the relatively simple associated physics and the success of cosmological N-body simulations (e.g., Springel et al., 2005). In contrast, the physics governing the formation and growth of the baryonic content of galaxies that inhabit dark matter haloes is more complex. Thus, the buildup of the gaseous and stellar content of galaxies is still not fully understood. The chemical enrichment of the interstellar medium (ISM) and its scaling with galaxy properties provides a sensitive probe of the key processes governing galaxy growth, including accretion of pristine and recycled gas from the intergalactic medium (IGM) and circum-galactic medium (CGM), processing of that gas through star formation, and feedback from massive stars, supernovae, and AGN that can heat gas and drive outflows. The connection between ISM abundance and baryon cycling leads to a tight correlation between the stellar masses () and gas-phase oxygen abundances (12+log(O/H) or Z) of star-forming galaxies in the local universe, known as the mass-metallicity relation (MZR; e.g., Tremonti et al., 2004; Kewley & Ellison, 2008; Andrews & Martini, 2013). The MZR has been shown to exist out to , but evolves with redshift such that metallicity at fixed decreases with increasing redshift (e.g., Erb et al., 2006; Maiolino et al., 2008; Troncoso et al., 2014; Sanders et al., 2015; Onodera et al., 2016).
In addition to a fundamental scaling between stellar mass and metallicity, a secondary dependence of the MZR on star-formation rate (SFR) has been observed (e.g., Ellison et al., 2008; Mannucci et al., 2010; Lara-López et al., 2010; Yates et al., 2012; Andrews & Martini, 2013). The existence of a secondary SFR dependence was first reported by Ellison et al. (2008) as a separation in the -Z plane as a function of specific SFR (sSFR=SFR/). Subsequently, Mannucci et al. (2010) and Lara-López et al. (2010) independently reported a relation among , metallicity, and SFR for galaxies and found that the intrinsic scatter around the -SFR-Z relation is smaller than that of the MZR. The -SFR-Z relation is such that at fixed , galaxies with higher SFRs have lower metallicities. This relation has been interpreted through a theoretical picture in which the accretion of pristine or low-metallicity gas from the IGM increases the SFR while diluting the metallicity of the ISM. At the same time, metallicity increases as the gas reservoir is used up in galaxies for which this reservoir is not being replenished. Mannucci et al. (2010) further claim that galaxies up to lie on the same -SFR-Z relation as galaxies, which led these authors to conclude that the -SFR-Z relation is redshift invariant at . This non-evolving -SFR-Z relation is known as the “fundamental metallicity relation” (FMR). In the context of the FMR, the observed evolution of the MZR with redshift is tied to the evolution of the SFR- relation: at earlier epochs, galaxies have higher SFR at fixed on average, corresponding to a lower metallicity. The evolution of SFR at fixed with redshift is also tied to an evolution toward higher gas fraction at earlier times (Reddy et al., 2012; Tacconi et al., 2013).
A -SFR-Z relation is a fundamental feature of galaxy chemical evolution models, including the equilibrium model in which the accretion rate is equal to the sum of the SFR and outflow rates (Finlator & Davé, 2008; Davé et al., 2012), and the gas-regulator model in which the mass of the gas reservoir regulates the SFR that in turn determines the outflow rate (Lilly et al., 2013). The relationships between inflow rate, outflow rate, and SFR have a similar form at all redshifts in these models. As such, the theoretical framework through which we understand galaxy growth predicts the existence of both the MZR and a -SFR-Z relation at high redshifts.
When investigating the evolution of the -SFR-Z relation with redshift, there are two questions that must be addressed. First, do high-redshift galaxies fall on the locally-defined FMR such that the -SFR-Z relation is redshift invariant? Second, do high-redshift galaxies show evidence for the existence of a -SFR-Z relation independent of the data? It is of interest to confirm SFR dependence of the MZR at high redshifts, in addition to understanding the relation between high-redshift galaxies and the -SFR-Z relation. If the metallicities of high-redshift galaxies do not vary with SFR at fixed , then this conflict with current theoretical predictions must be understood in order to obtain a more complete picture of galaxy evolution.
There have been many recent studies investigating both of the aforementioned questions at , but no concensus has been reached about the existence of a high-redshift -SFR-Z relation and its possible redshift invariance. Several studies have claimed that galaxies at are consistent with the -SFR-Z relation, suggesting the existence of a redshift invariant -SFR-Z relation (Christensen et al., 2012; Wuyts et al., 2012, 2016; Belli et al., 2013; Henry et al., 2013; Stott et al., 2013; Maier et al., 2014; Yabe et al., 2015; Hunt et al., 2016). Many other studies have demonstrated that galaxies at the same redshifts do not follow the predictions of the FMR, suggesting an evolving -SFR-Z relation (Cullen et al., 2014; Yabe et al., 2014; Zahid et al., 2014b; Wuyts et al., 2014; Sanders et al., 2015; Salim et al., 2015; Grasshorn Gebhardt et al., 2016; Kashino et al., 2017). The majority of the literature investigating whether a non-evolving -SFR-Z relation exists compare the predictions of a parameterization of the -SFR-Z relation to high-redshift data, and thus often rely on an extrapolation of the relation into a SFR regime that few if any galaxies in the samples occupy. Sanders et al. (2015) and Salim et al. (2015) showed the advantages of instead performing direct, non-parametric comparisons of and high-redshift galaxies at fixed , avoiding the uncertainty associated with extrapolations. Both studies found that galaxies have lower metallicities than galaxies at fixed and SFR. It is worth noting that potential redshift evolution of the relations between strong-line ratios and metallicity due to evolving gas physical conditions may systematically bias comparisons of metallicity over wide redshift ranges and must be carefully considered when investigating the validity of the FMR (Steidel et al., 2014, 2016; Shapley et al., 2015; Sanders et al., 2016b).
The question of whether the MZR has a secondary SFR dependence at is naturally more difficult to address because it requires detection of a weak secondary effect within the high-redshift sample. Several works have searched for a high-redshift -SFR-Z relation and failed to detect any significant SFR dependence within the uncertainties (Wuyts et al., 2012, 2014, 2016; Steidel et al., 2014; Yabe et al., 2014, 2015; Sanders et al., 2015; Grasshorn Gebhardt et al., 2016). While these studies did not observe significant secondary SFR dependence, it is not ruled out due to the expected subtlety of the effect. The predicted metallicity difference at fixed over the range of SFR probed by such studies is small ( dex), and thus requires either high-precision measurements or large sample sizes to detect.
A handful of studies have claimed to detect a -SFR-Z relation at high redshifts. Salim et al. (2015) perform a non-parametric comparison between galaxies and a sample of star-forming galaxies. By comparing metallicity as a function of offset from the -sSFR relation, these authors claim to resolve secondary SFR dependence at fixed , albeit with very large scatter and low significance. Kacprzak et al. (2016) divided a sample of 117 star-forming galaxies at the median SFR, and by fitting linear relations to the subsamples found that galaxies with lower SFRs tend to have higher metallicities at log(/M. These authors additionally claim that the slope of the MZR changes with SFR. However, roughly half of the low-SFR subsample have only upper limits on the metallicity, and the low- and high-SFR subsamples overlap in a narrow range where limits are also present, making it difficult to interpret the significance of these results. Recently, Kashino et al. (2017) found some evidence for a -SFR-Z relation at among individual galaxies with metallicity estimates based on [N ii]6584/H, but do not observe the same trends in stacks including non-detections. The authors conclude that the exclusion of galaxies with non-detections of [N ii] may introduce a bias that falsely makes a -SFR-Z relation appear. Zahid et al. (2014b) presented a detection of the -SFR-Z relation, finding a coherent systematic shift in the MZR in three bins when dividing their sample of 168 galaxies at the median SFR.
To date, studies of the high-redshift -SFR-Z have either been based on large samples () with low S/N individual measurements, or small samples with moderate S/N measurements. Previous studies have also largely relied on a single metallicity indicator (most often [N ii]6584/H or R23=([O iii]4959,5007+[O ii]3726,3729)/H), which makes it difficult to ascertain the accuracy of results given the potential redshift evolution of various strong-line metallicity calibrations. Whether or not a -SFR-Z relation exists at remains an open question as evidenced by the disagreement in the literature. A clear confirmation of such a relation is needed to test the applicability of current galaxy chemical evolution models over cosmic time.
In this paper, we present a study of the -SFR-Z relation using data from the MOSFIRE Deep Evolution Field (MOSDEF) survey (Kriek et al., 2015). We present the first analysis of the high-redshift -SFR-Z relation that is based upon multiple metallicity-sensitive emission-line ratios, in combination with robust dust-corrected SFRs from measurements of H and H. The simultaneous use of multiple metallicity indicators allows us to evaluate whether evolution of metallicity calibrations could falsely introduce apparent SFR dependence and therefore provides a more robust test of the high-redshift -SFR-Z relation than previous studies. This paper is organized as follows. We describe the observations, measurements, sample selection, and stacking methodology that we employ in Section 2. In Section 3, we search for a -SFR-Z relation at and perform a direct comparison to galaxies to investigate the redshift evolution of the -SFR-Z relation. We discuss our results and consider the effect of potential biases in Section 4, and summarize in Section 5. We adopt the following abbrevations for emission-line ratios:
| (1) |
| (2) |
| (3) |
| (4) |
| (5) |
| (6) |
We use the term “metallicity” to refer to the gas-phase oxygen abundance (12+log(O/H)) unless otherwise specified. Emission-line wavelengths are given in air. We assume a CDM cosmology with km s-1 Mpc-1, , and .
2. Observations, Data, and Measurements
2.1. The MOSDEF survey
The MOSDEF survey was a 4-year program in which we utilized the Multi-Object Spectrometer For Infra-Red Exploration (MOSFIRE; McLean et al., 2012) on the 10 m Keck I telescope to obtain near-infrared (rest-frame optical) spectra of galaxies at (Kriek et al., 2015). Galaxies were targeted in three redshift ranges such that strong optical emission lines fall in near-infrared windows of atmospheric transmission: , , and . In this study, we focus on the middle redshift range at . Targets were selected from the photometric catalogs of the 3D-HST survey (Brammer et al., 2012; Skelton et al., 2014; Momcheva et al., 2016) based on their redshifts and observed -band (rest-frame optical) magnitudes. Spectroscopic or HST grism redshifts were used when available; otherwise photometric redshifts were utilized for selection. For the redshift bin, galaxies were targeted down to a fixed -band AB magnitude of as measured from HST/WFC3 F160W imaging. This targeting scheme effectively selects galaxies down to a rough stellar mass limit of log(/M, although the sample is not complete below log(/M (see Shivaei et al., 2015). At , [O ii]3726,3729 falls in the band; H and [O iii]4959,5007 fall in the band; and H, [N ii]6548,6584 and [S ii]6716,6731 fall in the band. Observations were completed in 2016 May, with the full survey having targeted galaxies and measured robust redshifts for galaxies, with at and at and 3.4, respectively. Full technical details of the MOSDEF survey observing strategy and data reduction can be found in Kriek et al. (2015).
2.2. Measurements and derived quantities
2.2.1 Stellar mass
MOSDEF targets have photometric coverage spanning the observed optical to mid-infrared (Spitzer/IRAC), from which stellar masses can be robustly determined. Stellar masses were estimated by fitting the broad- and medium-band photometry from the 3D-HST photometric catalogs (Skelton et al., 2014; Momcheva et al., 2016) using the SED fitting code FAST (Kriek et al., 2009) with the flexible stellar population synthesis models of Conroy et al. (2009). A Chabrier (2003) initial mass function (IMF), the Calzetti et al. (2000) dust reddening curve, solar metallicity, and constant star-formation histories were assumed. Photometric bands containing significant contamination from high equivalent width emission lines (H in band and [O iii]+H in band) were excluded when fitting the SED. Uncertainties on the stellar masses were estimated by perturbing the input photometry according to the uncertainties and refitting 500 times.
2.2.2 Emission-line fluxes and redshift
Emission-line fluxes were determined by fitting Gaussian profiles to the 1D science spectra where spectral emission features of interest are expected. Uncertainties on the emission-line fluxes were taken to be the 68th-percentile width of the distribution of line fluxes obtained by perturbing the spectrum according to the error spectrum and remeasuring the line fluxes 1000 times (Reddy et al., 2015). After fitting and subtracting a linear continuum, all lines were fit by single Gaussian profiles except for [N ii]6548,6584+H and [O ii]3726,3729, which were respectively fit by triple and double Gaussians simultaneously. In the case of [O ii], the width of each component of the doublet was required to be identical. Redshifts were measured from the line with the highest S/N ratio for each object, most often H or [O iii]5007, and its width was used to constrain the width of weaker emission lines. Prior to the measurement of line fluxes, science spectra were corrected for slit losses on an object-by-object basis, as described in Kriek et al. (2015). Hydrogen Balmer line fluxes were corrected for underlying stellar Balmer absorption by estimating the absorption flux from the best-fit SED template, since the stellar continuum is not significantly detected for typical MOSDEF targets (Reddy et al., 2015). The Balmer absorption corrections were typically % for H and % for H.
2.2.3 Reddening correction and star-formation rate
SFRs were estimated using dust-corrected H luminosities by applying the calibration of Hao et al. (2011), an update to the Kennicutt (1998) calibration, converted to a Chabrier (2003) IMF. Reddening corrections were applied by estimating E(B-V) from the Balmer decrement (H/H) assuming an intrinsic ratio of 2.86 and the Cardelli et al. (1989) Milky Way extinction curve. Emission-line ratios involving lines significantly separated in wavelength were calculated using reddening-corrected line fluxes (N2O2, O32, R23), while uncorrected line fluxes were used otherwise (O3N2, N2, O3). Uncertainties on both SFRs and reddening-corrected line ratios include the uncertainty in E(B-V) in addition to the measurement uncertainties of the line fluxes, and SFR uncertainties include an additional 16% uncertainty added in quadrature to account for uncertainty in the slit loss corrections (Kriek et al., 2015). With the assumption that the source size is not a strong function of wavelength, the additional uncertainty associated with slit loss corrections does not affect the uncertainty of ratios of emission lines in the same filter, and does not significantly increase the uncertainty of line ratios with lines in multiple filters.
2.3. Sample selection
2.3.1 MOSDEF sample
We selected a sample of star-forming galaxies from the full MOSDEF data set with which we can investigate the existence of a -SFR-Z relation at . We required a secure redshift determination at , log(/M, and a detection of both H and H at signal-to-noise ratio S/N3 so that robust estimates of the reddening-corrected SFR may be obtained. The stellar mass cut removed six objects with lower stellar masses than the MOSDEF targeting scheme was designed to select. Four of these objects were not main targets but were instead serendipitously detected. Both the number of objects targeted and spectroscopic success rate drops precipitously below log(/M (Kriek et al., 2015). We rejected objects identified as AGN by their X-ray or infrared properties (Coil et al., 2015; Azadi et al., 2017), and additionally removed objects with [N ii]6584/H when [N ii]6584 is detected at S/N3, which are not likely to be dominated by star formation. We additionally rejected objects with significant sky-line contamination of H or H such that the line flux is unreliable. The requirement that H is cleanly detected at S/N3 was the most restrictive of these cuts, removing 45% of 462 galaxies that satisfy all other criteria. We discuss potential biases introduced by the H detection requirement below. This selection yielded a sample of 260 galaxies at with stellar masses spanning the range log(/M and SFRs ranging from 1.4 to 260 M⊙ yr-1. The median stellar mass and SFR of the sample is log(/M and 22 M⊙ yr-1, respectively.
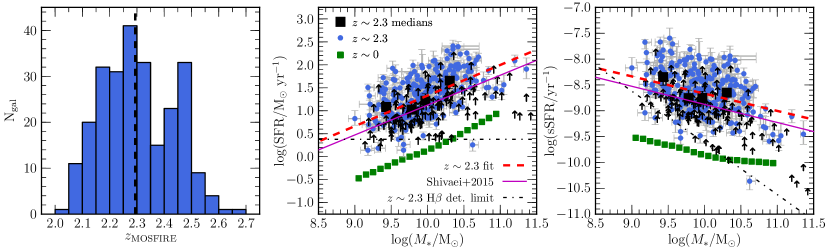
The redshift distribution, and the SFR and specific SFR (sSFR=SFR/) as a function of stellar mass, of the sample are shown in Figure 1. Galaxies in this sample scatter about the mean SFR- relation at , with the mean properties falling on the relations seen in past studies (e.g., Whitaker et al., 2012; Speagle et al., 2014; Shivaei et al., 2015). At log(/M, galaxies below the mean SFR- relation begin to fall below the MOSDEF H detection threshold at (Kriek et al., 2015). Shivaei et al. (2015) showed that excluding objects with H non-detections did not significantly bias a smaller sample of MOSDEF star-forming galaxies at log(/M. Galaxies for which H is detected but H is not detected, shown as SFR and sSFR lower limits in Figure 1 due to a lack of constraints on reddening, are distributed relatively uniformly with . Above log(/M⊙)=9.5, most limits lie well above the H detection threshold at , suggesting that most of the H non-detections are due to sky-line contamination. Since sky-line contamination is essentially a uniform redshift selection that does not correlate with other galaxy properties, excluding these H non-detections does not bias our sample (see Section 3.2 for additional discussion of H selection effects). Shivaei et al. (2015) also demonstrated that below log(/M, MOSDEF samples may be incomplete due to a bias against young objects with small Balmer and 4000 Å breaks for which the photometric redshifts used in our target selection may be inaccurate. This incompleteness does not significantly affect our results because the majority of our sample lies above log(/M. The results of our analysis do not significantly change if we restrict the sample to log(/M.
We also investigated whether spectroscopic incompleteness biases our sample. Of galaxies targeted at in the MOSDEF survey, 93 failed to produce spectroscopic redshifts. Half of these (45/93) are quiescent galaxies based on their rest-frame colors and thus do not affect our sample of star-forming galaxies. Red star-forming galaxies at failed to yield redshifts 15% of the time, while redshifts were not measured for only 6% of blue star-forming galaxies. These statistics agree with what Kriek et al. (2015) reported based on one-third of the full MOSDEF data set. The spectroscopic failures do not occupy any region of color space in which there are no objects with measured redshifts. Our sample is thus slightly biased against red star-forming galaxies. However, our sample is dominated by blue star-forming galaxies (85%) such that the bias against red star-forming galaxies has minimal impact on our results.
2.3.2 SDSS comparison sample
We compare the high-redshift sample to star-forming galaxies using measurements from the composite spectra of Andrews & Martini (2013, hereafter AM13). These authors selected a sample of 208,529 star-forming galaxies at from the SDSS (York et al., 2000) Data Release 7 (Abazajian et al., 2009) MPA-JHU catalog,111111Available at http://www.mpa-garching.mpg.de/SDSS/DR7/., which includes derived stellar masses (Kauffmann et al., 2003) and aperture-corrected SFR estimates based on emission lines (Brinchmann et al., 2004; Salim et al., 2007). The spectra of these galaxies were stacked in 0.1 dex wide bins in alone, as well as 0.10.1 dex bins in both and SFR. The and SFR assigned to each stack was taken to be the median stellar mass and median SFR of the individual galaxies in each bin. We restricted the AM13 stacks to in order to match the stellar mass range in which the majority of the sample falls. We utilize the AM13 -only stacks to determine the mean relations between , SFR, sSFR, and emission-line ratios, and investigate the scatter about these mean relations using the -SFR stacks. The comparison sample has the same set of emission lines measured as the sample and SFR measurements based on optical emission lines. This similarity allows us to estimate metallicities in the same way as for the sample, and perform a direct comparison of line ratios and metallicities at fixed and SFR.
2.4. Metallicities
The MOSDEF data set crucially provides coverage of several strong rest-optical emission features, allowing us to measure multiple metallicity indicators widely applied in the local universe. We utilize multiple emission-line ratios to estimate metallicity in this analysis, including N2, O3N2, N2O2, and O32. We do not utilize R23 to estimate metallicity for reasons described below, but retain the use of this metallicity-sensitive line ratio empirically, along with O3.
For N2 and O3N2, we use the empirically calibrated relations of Pettini & Pagel (2004) based on individual H ii regions:
| (7) |
and
| (8) |
The intrinsic uncertainties associated with these calibrations are 0.14 and 0.18 dex for N2 and O3N2, respectively. The N2 calibration is valid over the range , while the O3N2 calibration is applicable for . All of the sample and the entire high-redshift MOSDEF sample except for six galaxies fall within these bounds.
Brown et al. (2016) provided a calibration of galaxy metallicity as a function of N2O2 and offset from the mean sSFR- sequence (log(sSFR)):
| (9) |
The log(sSFR) term was included because these authors found that N2O2 systematically increases at fixed direct-method metallicity as log(sSFR) increases. Sanders et al. (2017) demonstrated that the separation of galaxies of different log(sSFR) in the N2O2-metallicity plane is a result of contamination of the integrated emission-line fluxes from diffuse ionized gas (DIG), which more strongly affects galaxies with lower log(sSFR). After correcting the Brown et al. (2016) strong-line ratios and direct-method metallicities for DIG contamination, the dependence on log(sSFR) disappears and the galaxies are shifted onto the H ii region metallicity scale. To estimate metallicities from N2O2, we perform a linear fit to the corrected Brown et al. (2016) datapoints from Sanders et al. (2017), obtaining the following expression:
| (10) |
The intrinsic scatter around this relation is 0.2 dex, and the calibration is valid over the range . The entire comparison sample falls in this range. Only 10 galaxies in the sample have , while the remainder fall in the range over which the calibration is valid.
We utilize the O32 calibration of Jones et al. (2015):
| (11) |
The intrinsic calibration uncertainty is 0.11 dex. This relation was calibrated using a sample of 113 star-forming galaxies with metallicity estimates based on electron temperatures, and no evolution in this calibration is seen out to (Jones et al., 2015). The calibrating data set only covers the range , with the majority of the data set lying at . While 91 galaxies in the sample and all of the local comparison sample has log(O32)0.0, other empirical and theoretical calibrations do not show significant changes to the slope of O32 calibrations below log(O32)=0.0 (Maiolino et al., 2008; Curti et al., 2017). We therefore apply the Jones et al. (2015) O32 calibration to galaxies with while noting that a systematic bias in metallicity estimates from this calibration may be introduced at log(O32)0.0.
While R23 is commonly employed as a metallicity indicator in the local universe, we do not estimate metallicity from R23. R23 is double-valued as a function of metallicity, with the turnover occurring at and (e.g., McGaugh, 1991; Kewley & Dopita, 2002; Pilyugin & Thuan, 2005). The majority of our sample lies in this region of parameter space, where small observational uncertainties lead to large uncertainties in metallicity and assigning an object to the upper or lower R23 branch is non-trivial. Breaking the upper and lower branch degeneracy is usually achieved using N2 or N2O2 in combination with R23 (e.g., Kewley & Dopita, 2002). Star-forming galaxies at display significant offsets from the population in strong-line ratio diagrams involving lines of nitrogen (Masters et al., 2014; Steidel et al., 2014; Shapley et al., 2015; Sanders et al., 2016b), however, suggesting that the criterion for upper or lower R23 branch assignment based on N2 or N2O2 evolves with redshift. Due to these uncertainties in R23-based metallicities for the high-redshift sample, we do not convert R23 values to metallicities but instead utilize R23 in an empirical sense only.
While all 260 individual galaxies in the sample have detections of H and H, some do not have S/N3 for [N ii]6584, [O ii]3726,3729, and/or [O iii]5007. The sample contains 143 N2 detections, 126 O3N2 detections, 118 N2O2 detections, 169 O32 and R23 detections, and 223 O3 detections. Each of the detected line-ratio subsets has median stellar mass in the range and median SFR within . We incorporate information from galaxies with metal line non-detections using a stacking analysis as described below.
2.5. Correcting for diffuse ionized gas contamination
As mentioned previously, DIG is a significant contaminant of global galaxy spectra at and introduces systematic biases in galaxy emission-line ratios and metallicity estimates (Sanders et al., 2017). In order to obtain accurate metallicities from strong-line calibrations, both the measured line ratios and the metallicity calibrations must be free of the effects of DIG contamination. Relations calibrated using individual H ii regions such as the Pettini & Pagel (2004) N2 and O3N2 calibrations are free from this issue. We have explicitly corrected the sample of Brown et al. (2016) to the H ii region metallicity scale. While the calibrating data set of the Jones et al. (2015) O32 relation has not been corrected, we do not expect a high level of DIG contamination in this case. The galaxies selected by Jones et al. (2015) are highly star-forming and have high sSFR and large H surface brightness. Oey et al. (2007) found that the importance of DIG to total galaxy emission decreases with increasing H surface brightness, such that DIG emission is negligible in starburst galaxies. Using the calibration from Sanders et al. (2017) based on the Oey et al. (2007) data set, we estimate that the fraction of total Balmer emission originating from DIG () is % for the galaxies in the Jones et al. (2015) sample based on their H surface brightnesses. This result suggests that H ii region emission dominates the Jones et al. (2015) calibrating sample and the correction for DIG contamination would be minor compared to what is required for typical galaxies with 55% (Sanders et al., 2017).
We corrected the comparison sample for DIG contamination using the results of Sanders et al. (2017), which are based upon empirical models treating galaxies as ensembles of H ii and DIG regions. These models also correct for flux-weighting biases present in integrated galaxy measurements because the line-emitting regions falling in the spectroscopic aperture have a range of metallicites. The AM13 stacks were corrected using the model with =0.55. For the AM13 SFR- bins, Sanders et al. (2017) determined the median H surface brightness in each bin and constructed a model matched to the corresponding , since the relative importance of DIG varies with SFR. These corrections allow us to obtain more robust metallicity estimates for the comparison sample by using the corrected line ratios with the metallicity calibrations described above.
There are currently no observational constraints on the importance of DIG at high redshifts. However, if high-redshift galaxies follow a similar relation between and H surface brightness as local galaxies, the high SFRs and compact sizes of high-redshift galaxies suggest that DIG emission is negligible at . We operate under this assumption, although high-resolution spatially resolved emission-line observations of high-redshift galaxies are ultimately required to reveal the role of DIG in the early universe. In addition to compact sizes and high SFRs, galaxies have much larger gas fractions at fixed at than at (Tacconi et al., 2013), and likely display differences in the distribution and importance of different ISM phases. In light of such differences, the assumption that the relation between and H surface brightness does not change with redshift may need to be revisited.
2.6. Stacking methodology
We selected a subset of the sample of 260 star-forming galaxies with which we perform a stacking analysis. For this stacking subsample, we additionally required that the spectrum of each object had wavelength coverage of [O ii]3726,3729, H, [O iii]5007, H, and [N ii]6584, and that the stellar mass fell in the range /M. The wavelength coverage criterion allows for the measurement of all emission-line ratios of interest in this study from the stacked spectra. The stellar mass criterion is designed to only stack over the mass range in which the MOSDEF star-forming sample is not obviously incomplete based on target selection and/or spectroscopic success rate. Kriek et al. (2015) showed that both the number of galaxies targeted and the spectroscopic success rate sharply decrease at log(/M using data from the first 2 years of the MOSDEF survey. Such behavior is expected because of the target selection down to fixed -band magnitude and the inherent faintness of low-mass targets. A drop in the spectroscopic success rate at log(/M was also identified and found to be partially caused by a significantly lower success rate for red star-forming and quiescent galaxies compared to blue star-forming galaxies (Kriek et al., 2015). We have confirmed these trends in success rate with the full MOSDEF sample. Applying the above criteria yields a stacking subsample of 195 galaxies at with median stellar mass log(/M and median SFR of 18 M⊙ yr-1. The stacking subsample has slightly lower median stellar mass and SFR than the larger sample it was selected from, primarily because of the upper stellar mass cut.
We used two different binning methods for this analysis. We binned in stellar mass in order to determine mean line-ratio and metallicity relations as a function of stellar mass. Galaxies were stacked in four stellar mass bins selected such that an equal number of galaxies fell in each bin (48-49 galaxies per bin). We refer to the stacks binned in stellar mass only as the “ stacks.” We also binned in both stellar mass and offset from the mean sSFR- relation (log(sSFR)) in order to assess the presence of a -SFR-Z relation at and its evolution from . We found that dividing the stacking sample at log(sSFR/yr splits the sample into three roughly equal parts, with 68 galaxies in the highly star-forming subsample with log(sSFR, 67 galaxies falling within 0.2 dex of the mean relation, and 60 galaxies with log(sSFR. Since these bins were selected with respect to the mean sSFR- relation, the stellar mass distribution in each bin is similar except for the log(sSFR bin, in which objects with log(/M fall below the MOSDEF H detection limit at . The log(sSFR bin is thus biased toward higher . After dividing the sample in log(sSFR), galaxies in each log(sSFR) bin were stacked in two stellar mass bins divided at the median stellar mass, yielding a total of 6 -log(sSFR) bins. We refer to the stacks binned in both and log(sSFR) as the “-sSFR stacks.”
We produced composite spectra by first shifting each spectrum into the rest frame and converting from flux density to luminosity density using the spectroscopic redshift. Since some of the line ratios of interest require reddening correction, we corrected each individual spectrum for reddening by applying a reddening correction to the luminosity density at each wavelength element based on the Balmer decrement (H/H) of each galaxy, assuming the Cardelli et al. (1989) extinction curve. This process effectively only corrects the nebular lines, since the continuum is not significantly detected for individual galaxies in our stacking sample. Each reddening-corrected spectrum was then normalized by the dust-corrected H luminosity. Spectra were interpolated onto a wavelength grid with spacing equal to the wavelength sampling at the median redshift of the sample, equal to 0.40 Å in band, 0.50 Å in band, and 0.66 Å in band. Normalized composite spectra were created by taking the median value of the normalized spectra at each wavelength increment, and multiplying by the median dust-corrected H luminosity to produce the final composite spectrum in units of luminosity density.
Emission-line luminosities were measured from stacked spectra by fitting a flat continuum to regions around emission features and Gaussian profiles to the emission lines following the fitting methodology for individual spectra. Uncertainties on emission-line fluxes were estimated using a Monte Carlo technique in which we perturbed the stellar masses according to the uncertainties and divided the perturbed sample into the same stellar mass bins as before, bootstrap resampled each bin to account for sample variance, perturbed the individual spectra according to the error spectra, perturbed the individual E(B-V) values and applied them to correct the individual spectra for reddening, stacked according to the method described above, and remeasured the emission-line luminosities. This process was repeated 100 times, and the uncertainties on line luminosities were obtained from the 68th-percentile width of the distribution of remeasured line luminosities. The median Balmer absorption luminosity of the individual galaxies in each bin was utilized to apply Balmer absorption corrections to the stacked H and H luminosities.
Emission-line ratios and uncertainties were calculated using the line luminosities and uncertainties measured from the stacked spectra. We found that the stacking method described above robustly reproduces line ratios characteristic of the individual galaxies in a stack by comparing the stacked line ratios to median line ratios of individual galaxies with significant detections of all of the emission lines of interest. Stellar mass and SFR were assigned to each stack using the median and median SFR of the individual galaxies in each bin. Uncertainties on the median and SFR were estimated using the distribution of median values produced by the Monte Carlo simulations. The median and SFR of galaxies in each bin and measured line ratios of the and -sSFR stacks are presented in Table 1.
| Naafootnotemark: | bbfootnotemark: | SFRccfootnotemark: | logddfootnotemark: | log(N2) | log(O3) | log(O3N2) | log(N2O2) | log(O32) | log(R23) |
|---|---|---|---|---|---|---|---|---|---|
| M∗ stacks | |||||||||
| 49 | 9.0-9.62; | ||||||||
| 49 | 9.62-9.89; | ||||||||
| 49 | 9.89-10.13; | ||||||||
| 48 | 10.14-10.50; | ||||||||
| M∗-sSFR stacks: log(sSFR/yr | |||||||||
| 30 | 9.18-9.90; | ||||||||
| 30 | 9.90-10.49; | ||||||||
| M∗-sSFR stacks: (sSFR/yr | |||||||||
| 34 | 9.00-9.86; | ||||||||
| 33 | 9.86-10.47; | ||||||||
| M∗-sSFR stacks: log(sSFR/yr | |||||||||
| 34 | 9.20-9.92; | ||||||||
| 34 | 9.92-10.5; | ||||||||
3. Results
A sensitive test of secondary dependences in the MZR is to look for correlations between deviations from the mean MZR and deviations from mean relations of other galaxy properties as a function of stellar mass, such as SFR, or H i and H2 gas fraction. In particular, a signature of a -SFR-Z relation is an anticorrelation between residuals about the mean MZR (log(O/H)) and residuals about the mean sSFR- relation (log(sSFR)). We search for this signature of a -SFR-Z relation at . We first fit the mean sSFR- relation, as well as the mean relations between and the emission-line ratios O3N2, N2, N2O2, O32, O3, and R23. We additionally fit the mean MZR based on metallicities determined using each of the line ratios O3N2, N2, N2O2, and O32. We then examine the relationship between the residuals in line ratios (and the corresponding metallicity values) and sSFR relative to the mean relations. A similar method was employed by Salim et al. (2015) and Kashino et al. (2017).
While we use sSFR residuals in order to make a comparison to the simulation predictions of Davé et al. (2017), we note that using residuals around the mean SFR- relation would give the same result since an offset of a galaxy above or below the mean SFR- relation in log(SFR) is equal to the offset of that galaxy from the mean sSFR- relation in log(sSFR). Accordingly, the slope of the log(O/H) vs. log(sSFR) relation provides a direct probe of the dependence of O/H on SFR at fixed .
3.1. Mean relations
The stacks are shown in the SFR- and sSFR- planes in Figure 1. We determine the mean sSFR- relation by fitting a linear function to the stacks in the sSFR- plane. The best-fit coefficients are listed in Table 2. We determine the residuals about the mean -sSFR relation by subtracting this mean relation from the sSFR estimate for each galaxy in the sample. In Figure 1, we compare our mean relation to that obtained by Shivaei et al. (2015) using the first 2 years of MOSDEF data. The two relations are generally consistent, although we find a slightly higher normalization, likely due in part to different SED fitting assumptions and the resulting stellar masses. We note that the MOSDEF H detection limit biases the SFR in the lowest-mass bin high, and thus the fit we derive here may be steeper in the sSFR- plane and shallower in the SFR- plane than the true mean relation of the star-forming population. However, our results do not change significantly if we instead fit mean relations excluding the lowest-mass bin. Incompleteness in the lowest-mass bin due to the H detection limit thus does not affect our conclusions.
| property | slope | intercept |
|---|---|---|
| star formationaafootnotemark: | ||
| SFR | 0.67 | |
| sSFR | ||
| line ratiosaafootnotemark: | ||
| O3N2 | 10.72 | |
| N2 | 0.59 | |
| N2O2 | 0.41 | |
| O32 | 5.51 | |
| O3 | 3.90 | |
| R23 | 2.03 | |
| 12+log(O/H)bbfootnotemark: | ||
| O3N2 | 0.30 | 5.30 |
| N2 | 0.34 | 5.01 |
| N2O2 | 0.30 | 5.27 |
| O32 | 0.26 | 5.79 |
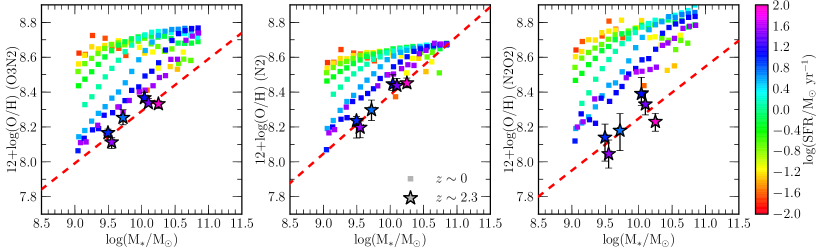
In Figure 2, we present the excitation- and metallicity-sensitive line ratios O3N2, N2, N2O2, and O32 vs. . The line ratios O3N2 and O32 are sensitive to the ionization parameter, containing both a high and low ionization energy ionic species. N2 is also sensitive to changes in ionization parameter, as well as the nitrogen abundance (N/H), such that higher ionization parameter and lower N/H lead to lower N2. In contrast, N2O2 is primarily sensitive to changes in the N/O abundance ratio (Kewley & Dopita, 2002). We observe a clear progression toward higher ionization parameter and lower N/O and N/H at fixed stellar mass from to . These results are in agreement with what has been found for other samples at (e.g., Erb et al., 2006; Steidel et al., 2014; Shapley et al., 2015; Holden et al., 2016). While recent results for high-redshift samples have suggested the possibility of redshift evolution of physical conditions such as the ionizing spectrum, ionization parameter, or N/O at fixed O/H (e.g., Kewley et al., 2013a; Masters et al., 2014, 2016; Steidel et al., 2014, 2016; Shapley et al., 2015; Sanders et al., 2016b; Strom et al., 2017), the observation of both higher ionization parameter and lower nitrogen abundance at fixed is difficult to explain without chemical evolution (i.e., lower O/H at fixed with increasing redshift) playing a major role. We determine the mean relation between these strong-line ratios and by fitting linear functions to the stacks, and present the best-fit coefficients in Table 2.
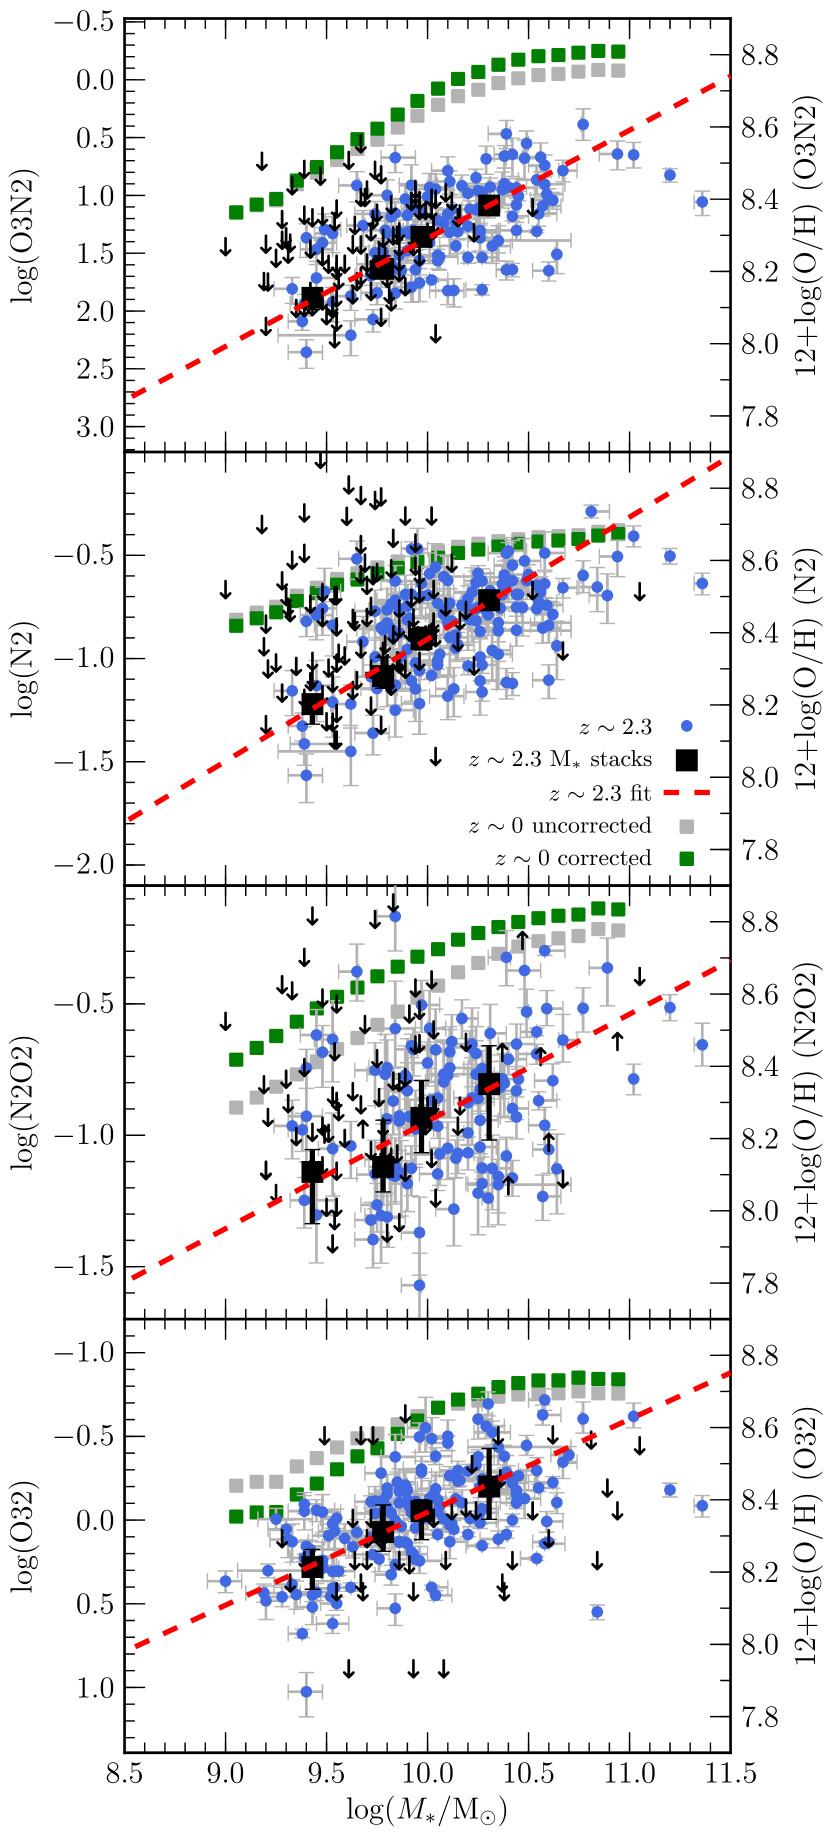
All four line ratios indirectly trace oxygen abundance, since ionization parameter is tightly anticorrelated with metallicity (Dopita et al., 2006a, b; Pérez-Montero, 2014; Sánchez et al., 2015), while N/O and N/H are correlated with metallicity due to the secondary production channel of nitrogen (Kewley & Dopita, 2002; Pettini & Pagel, 2004; Pérez-Montero & Contini, 2009). The observation of such correlations in the local universe has led to the construction of metallicity calibrations based on these strong-line ratios. The translation of the strong-line ratios O3N2, N2, N2O2, and O32 into metallicity is shown by the right set of y-axes in Figure 2. All four panels are matched to the same range in metallicity (7.712+log(O/H)8.9). Under the assumption that metallicity calibrations do not strongly evolve with redshift, the presence of higher excitation and lower N/O at corresponds to lower metallicity at fixed compared to . We find that galaxies are offset toward lower metallicities at fixed by 0.37, 0.25, 0.46, and 0.25 dex on average for metallicities based on O3N2, N2, N2O2, and O32, respectively. The best-fit linear MZR for these indicators can be found by passing the line-ratio vs. fits through the metallicity calibrations (equations 7, 8, 10, and 11). We list the best-fit coefficients for the MZR in Table 2, and calculate O/H residuals relative to these best-fit linear relations.
The ability of such locally calibrated relations to accurately estimate nebular metallicities in high-redshift galaxies has been called into question by recent studies (e.g., Steidel et al., 2014; Sanders et al., 2015; Shapley et al., 2015; Steidel et al., 2016; Strom et al., 2017). We note here that the method we employ to search for a -SFR-Z relation at using residuals around mean relations is immune to changes in the normalizations of metallicity calibrations since we are looking at relative differences in metallicity, but would be affected by changes in the slopes. The interpretation of our results could also be affected by changes in ionized gas physical conditions that correlate with sSFR at fixed . We discuss these potential systematic effects on our results in Section 4.1.
3.2. Is there SFR dependence of the MZR?
As previously mentioned, while it is of interest to determine whether or not and high-redshift galaxies lie on the same -SFR-Z relation (i.e., the FMR holds out to high redshifts), it is more fundamental to establish whether the metallicities of high-redshift galaxies display a secondary dependence on SFR at fixed . The existence of a high-redshift -SFR-Z relation is a prerequisite for interpreting the position of high-redshift galaxies relative to the FMR observed at . We look for a -SFR-Z relation at by searching for correlated scatter around the MZR and -sSFR relation.
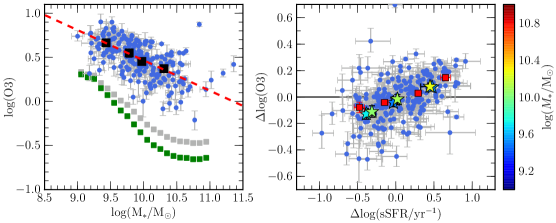
In the left column of Figure 3, we show the residuals around the mean relations for the line ratios O3N2, N2, and N2O2, and the corresponding O/H residuals, all as a function of residuals around the mean -sSFR relation. We show both individual galaxies and the -sSFR stacks, the latter color-coded by stellar mass. There is a clear trend among both the stacks and individual galaxies such that the sSFR residuals correlate with O3N2 residuals and anticorrelate with residuals in N2 and N2O2. These trends are as expected in the presence of a -SFR-Z relation, given that O3N2 decreases with increasing metallicity while N2 and N2O2 increase. Furthermore, the correlations are statistically significant based on Spearman correlation tests. The correlation coefficients and -values are shown in Table 3. The corresponding trends in log(O/H) are similar for all three metallicity indicators: log(O/H) decreases with increasing log(sSFR). This trend in the residuals demonstrates that galaxies with higher SFR have lower O/H at fixed stellar mass, confirming the existence of a -SFR-Z relation at . This is the first time that such a relation has been clearly demonstrated to exist at this redshift.
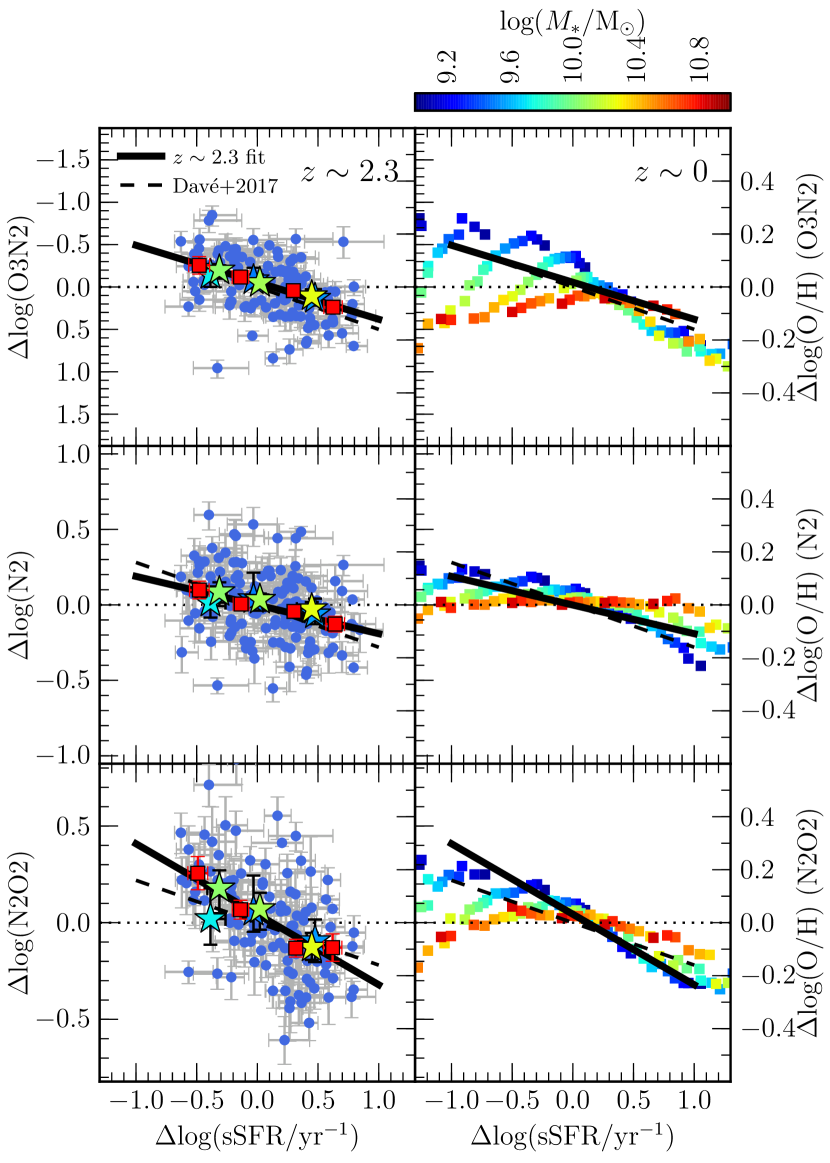
We quantify the strength of the -SFR-Z relation by fitting linear relations to the median log(O/H) in bins of log(sSFR). The best-fit lines are shown in the middle column of Figure 3, and the best-fit slopes are given in Table 3. These slopes are inconsistent with a flat relation (i.e., no dependence of O/H on SFR at fixed ) at . The -sSFR stacks fall on the same relations as the medians of the individual galaxies. The high-mass -sSFR stacks most clearly follow the same relation as the medians of the individual points, while the low-mass -sSFR stacks are noisier but all fall within 1 of the best-fit relations. The position of the stacks relative to the individual detections suggests that galaxies with non-detections in these emission-line ratios lie on the same anticorrelations. We conclude that requiring line-ratio detections in the individual galaxies does not significantly bias these results.
| line ratio | slope | aafootnotemark: | -valuebbfootnotemark: |
|---|---|---|---|
| O3N2 | 0.48 | ||
| N2 | |||
| N2O2 | |||
| O32 | 0.14 | 0.07 |
The right column of Figure 3 displays the line-ratio and O/H residuals as a function of log(sSFR) for the -SFR stacks, color-coded by . In each panel, we include the best-fit line to the sample for comparison. The stacks show similar trends at log(/M, but display the well-known decrease in the strength and disappearance of the SFR dependence at high stellar masses (Mannucci et al., 2010; Yates et al., 2012; Salim et al., 2014), as evidenced by the tendency of high-mass stacks to lie closer to log(O/H at fixed log(sSFR/yr. A weakening of the sSFR dependence at log(sSFR/yr is also apparent in all three indicators, as pointed out by Salim et al. (2014). There is no evidence for such a flattening of the -SFR-Z relation at high masses or log(sSFR/yr among the -sSFR stacks. However, we note that the mass range in which the sample displays little to no SFR dependence (log(/M) lies above the mass range probed by the sample.
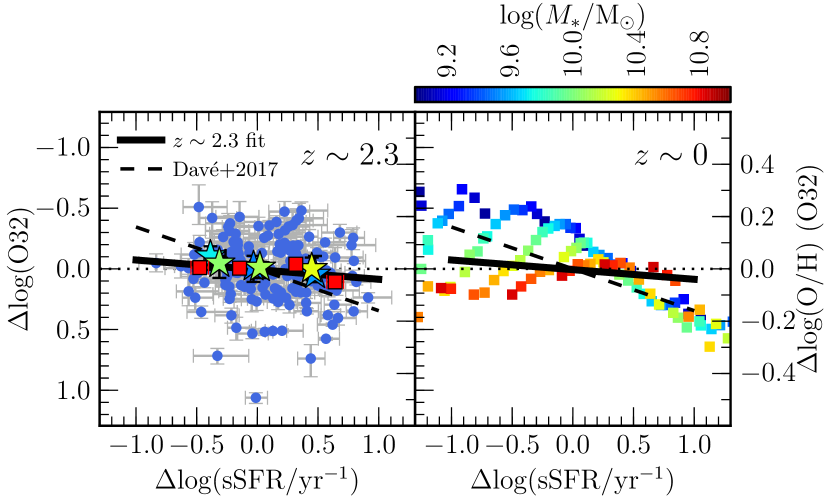
We show the line-ratio and MZR residual plots for O32 in Figure 4. There is no clear trend toward lower metallicity with increasing log(sSFR) among the galaxies when utilizing the O32 indicator. There is no statistically significant correlation present (Table 3). In contrast, a clear -SFR-Z relation is present at for O32. We discuss the lack of SFR dependence at for the O32 MZR in Section 4.3.
The strong-line ratio O3 is sensitive to both ionization parameter and metallicity. As such, trends indicative of a -SFR-Z relation should be present in the O3 residuals as well. We show O3 as a function of in the left panel of Figure 5. The best-fit coefficients are given in Table 2. The right panel of Figure 5 displays the O3 residuals as a function of sSFR residuals for individual galaxies and the -sSFR stacks. A clear correlation is present, with Spearman correlation coefficient and probability of being drawn from an uncorrelated distribution of . The correlation between log(O3) and log(sSFR) is consistent with a decrease in metallicity (increase in O3) as sSFR increases at fixed . This result agrees with what is found using O3N2, N2, and N2O2.
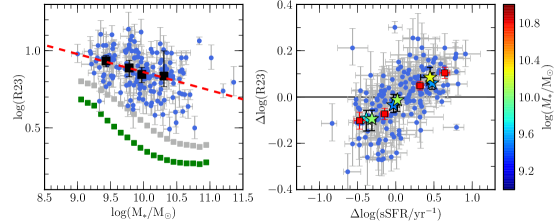
The strong-line ratio R23 as a function of and the log(R23) vs. log(sSFR) deviation plot are presented in Figure 6. R23 is primarily sensitive to O/H because it is a ratio of both low and high ionization state oxygen lines to a hydrogen Balmer line, but has significant ionization parameter dependence as well (Kewley & Dopita, 2002). R23 is not a strong function of for the sample, which is anticipated since the R23 values lie close to the turnover regime in the R23-O/H relation, as described in Section 2.4. However, R23 does increase slightly with decreasing , suggesting that our sample mostly lies on the upper metal-rich R23 branch where R23 increases with decreasing O/H. In this case, a positive correlation between log(R23) vs. log(sSFR) is expected if a -SFR-Z relation is present. This positive correlation is observed in the right panel of Fig. 6 with high statistical significance (, ), in agreement with the trends observed using O3N2, N2, N2O2, and O3.
One important question is whether the SFR dependence we find in the MZR is a result of selection effects. We investigated the effect of requiring H S/N3 on these results by repeating the analysis to search for a -SFR-Z relation at without this requirement. Because we cannot reliably correct for reddening without detections of both H and H, we utilized SFRs estimated from FAST SED fitting instead of dust-corrected H luminosities. Furthermore, this test could only be performed for the portions of the analysis that involve line ratios that do not require reddening correction (i.e., O3, N2, and O3N2). We found similar results based on these line ratios, although the trends were somewhat weaker for a few reasons. First, there is significant scatter in the correlation between SFR(SED) and SFR(H) (Reddy et al., 2015). Second, SFR(H) traces star formation on 10 Myr timescales while SFR(SED) probes longer timescales of 100 Myr. It is thus expected that signatures of a -SFR-Z relation are weaker when relying on SFR(SED) since the -SFR-Z relation is thought to be driven by a reaction of SFR and metallicity on short timescales to recent accretion of metal-poor gas (Mannucci et al., 2010; Davé et al., 2012). Finally, a smaller dynamic range of SFR at fixed is probed in this test because and SFR(SED) are not independent of one another, both being estimated by FAST SED fitting. This covariance artificially tightens the -(s)SFR relation, making it more difficult to resolve SFR dependence of metallicity at fixed . Because our results persist when utilizing SFR(SED) without the H detection criterion, we conclude that requiring H S/N3 does not strongly bias our results.
3.3. Do galaxies lie on the FMR?
Having established the existence of a -SFR-Z relation for star-forming galaxies, we next address the question of whether or not these galaxies lie on the -SFR-Z relation. In other words, we test whether or a FMR exists that extends out to . Many studies have attempted to address this question by extrapolating parameterizations of the FMR (e.g., Mannucci et al., 2010; Lara-López et al., 2010) to the high-SFR and high-sSFR regime occupied by high-redshift galaxies (e.g., Wuyts et al., 2012, 2014; Christensen et al., 2012; Belli et al., 2013; Henry et al., 2013; Cullen et al., 2014; Yabe et al., 2014; Zahid et al., 2014b; Kashino et al., 2017). Such extrapolations may not be representative of the true -SFR-Z relation because a parametric form must be assumed that may not represent the underlying physical relation, and the small fraction of objects with SFRs similar to those of high-redshift galaxies will not carry much weight toward the fit, allowing the possibility of a poor fit in the high-SFR regime. Recent studies have shown the benefit of performing non-parametric comparisons instead, relying on the small number of objects with extreme SFRs to directly compare at fixed and SFR (Sanders et al., 2015; Salim et al., 2015; Ly et al., 2016).
We directly compare the position of the -sSFR stacks and the -SFR stacks in the mass-metallicity plane in Figure 7, with metallicities based on the O3N2, N2, and N2O2 indicators. Both high- and low-redshift stacks are color-coded by SFR on the same scale so that a direct comparison of metallicity at fixed and SFR is possible. The highest-SFR stack, with log(M∗/M and log(SFR/M⊙ yr, does not have any local analogue in the AM13 -SFR sample. However, all other stacks have analogous counterparts matched in and SFR. In the O3N2, N2, and N2O2 -Z planes, galaxies display metallicities that are systematically lower than their counterparts by dex at fixed and SFR. This offset is consistent across a range of and log(sSFR) using three different metallicity indicators. We found a similar offset using only O3N2 and N2 with a smaller MOSDEF sample in Sanders et al. (2015). We conclude that there is not a FMR that can simultaneously match the properties of star-forming galaxies from out to .
We note that the presence of a -SFR-Z relation can be seen in Figure 7 in the -sSFR stacks, with the lowest-SFR bins at a given falling above the mean relation and the highest-SFR bins falling below. This trend is most evident in the O3N2 and N2O2 mass-metallicity planes (Fig. 7) for the stacks with log(M∗/M, as shown by a progression from higher to lower O/H as SFR increases, and the symbol color changes from blue to purple to pink. The presence of such SFR gradients perpendicular to the mean MZR is a manifestation of the sSFR dependence shown in Figure 3.
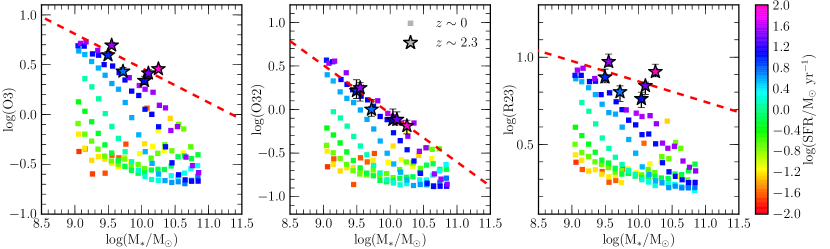
We directly compare the strong-line ratios O3, O32, and R23 at fixed and SFR for and stacks in Figure 8. The stacks display higher O3 and R23 than stacks at fixed and SFR, suggesting higher excitation and lower metallicity at fixed and SFR at . This result is consistent with what was found using O3N2, N2, and N2O2. The -sSFR stacks also display separation perpendicular to the mean O3- and R23- relations as a function of SFR, consistent with the existence of a -SFR-Z relation at . The O32 values of the stacks are not obviously offset from the stacks matched in and SFR. Once again, results based upon O32 are inconsistent with those from O3N2, N2, N2O2, O3, and R23. We discuss the differences in results based on O32 in Section 4.3.
4. Discussion
4.1. Potential evolution in metallicity calibrations and ionized gas physical conditions
We have clearly demonstrated the existence of a -SFR-Z relation at based on multiple emission-line ratios (O3N2, N2, N2O2, O3, and R23) and metallicities inferred using calibrations. We furthermore showed that galaxies are offset dex lower in metallicity from galaxies at fixed and SFR, arguing against the existence of a redshift invariant -SFR-Z relation. We now consider whether the appearance of a -SFR-Z relation at and its evolution with respect to could be produced by other effects in the absence of metallicity variations. Recent work has suggested that the physical conditions of ionized gas in star-forming regions evolve with redshift (e.g., Steidel et al., 2014, 2016; Shapley et al., 2015; Sanders et al., 2016b; Strom et al., 2017; Kashino et al., 2017). The physical conditions of interest are the ionization parameter, N/O abundance ratio, electron density, and the shape of the ionizing spectrum. Changes in these properties lead to changes in emission-line ratios at fixed nebular oxygen abundance (Kewley et al., 2013a). The ionization parameter, N/O ratio, and shape of the ionizing spectrum must be considered at fixed metallicity because of correlations between these properties and the nebular and stellar metallicity.
The only evolving physical condition for which there is a consensus is the electron density. The typical electron density in star-forming regions increases with redshift, and is an order of magnitude higher at compared to (e.g., Steidel et al., 2014; Sanders et al., 2016b; Kashino et al., 2017). The typical densities at and (25 and 250 cm-3, respectively) are both well below the density where strong-line ratios become strongly affected (1000 cm-3; Steidel et al., 2014). Thus, evolution in electron density has a negligible impact on our results.
There is not a consensus about the evolution (or lack thereof) of N/O, ionization parameter, and hardness of the ionizing spectrum at fixed metallicity. While this ambiguity makes it difficult to assess the impact of such evolution on metallicity studies, the MOSDEF sample crucially provides access to multiple strong-line ratios, enabling us to determine if evolution in a particular property leads to false conclusions. It has been suggested that high-redshift galaxies have elevated N/O at fixed O/H compared to galaxies, explaining observed evolution in line-ratio diagrams involving nitrogen (Masters et al., 2014; Steidel et al., 2014; Shapley et al., 2015; Sanders et al., 2016b). The elevated N/O could be caused by an unusually high occurrence rate of Wolf-Rayet stars (Masters et al., 2014) or a dilution of O/H by pristine gas inflows while N/O remains roughly constant (Köppen & Hensler, 2005; Amorín et al., 2010; Sanders et al., 2016b). Other studies have argued for a harder ionizing spectrum at fixed nebular abundance in high-redshift star-forming regions (Steidel et al., 2016; Strom et al., 2017). Some have also suggested a higher ionization parameter at fixed metallicity as sSFR increases, leading to an elevated ionization parameter in high-redshift galaxies due to their larger sSFR than galaxies on average (Kewley et al., 2013a, b, 2015, 2016; Kashino et al., 2017). In what follows, we consider the possible effects of these proposed scenarios on our results.
4.1.1 Nitrogen-to-oxygen ratio
We observe the -SFR-Z relation using the O3N2, N2, and N2O2 metallicity indicators (Fig. 3), all of which involve nitrogen. Even if high-redshift galaxies have elevated N/O at fixed O/H, such an effect could only lead to a false inference of a -SFR-Z relation at if N/O depends on SFR and sSFR at fixed . We observe higher O3N2, lower N2, and lower N2O2 with increasing sSFR at fixed . For these trends to be introduced by variations in nitrogen abundance in the absence of metallicity variation, N/O would have to decrease with increasing sSFR at fixed O/H. Such a relation between N/O and sSFR at fixed O/H is inconsistent with the Wolf-Rayet scenario because it requires that high-sSFR environments underproduce Wolf-Rayet stars and thus have lower N/O values at fixed O/H. In contrast, evolutionary scenario proposed by Masters et al. (2014) predicts that high-sSFR environments overproduce Wolf-Rayet stars, leading to elevated N/O at fixed O/H in high-redshift galaxies. Accordingly, this scenario cannot reproduce our results on the -SFR-Z relation involving N-based indicators.
In addition to a -SFR-Z relation, we found that galaxies are offset dex lower in metallicity at fixed and SFR compared to the sample (Fig. 7). If N/O is higher at fixed O/H at high redshifts, then high-redshift metallicities based on O3N2, N2, and N2O2 would be overestimated. Consequently, the dex metallicity offset would be underestimated and our conclusion that the -SFR-Z relation evolves with redshift from to still holds, as argued in Sanders et al. (2015). At fixed , we observe an offset toward lower N2 and N2O2, and higher O3N2, for the sample. For this offset to be the product of N/O evolution at fixed O/H, high-redshift galaxies would need to have lower N/O at fixed O/H compared to . Such a scenario would shift high-redshift galaxies toward lower N2 at fixed O/H. In fact, high-redshift galaxies are observed to be offset significantly higher N2 at fixed O3 compared to the star-forming population in the N2 vs. O3 diagram (e.g., Shapley et al., 2005, 2015; Steidel et al., 2014; Sanders et al., 2016b; Strom et al., 2017). It is thus implausible that evolution toward lower N/O at fixed O/H drives the redshift evolution of O3N2, N2, and N2O2 at fixed and SFR.
It is important to note that both the -SFR-Z relation and the offset toward lower O/H at fixed and SFR compared to are also observed using O3 and R23, which have no dependence on variations in N/O at fixed O/H (Figs. 5, 7 and 8, left and right panels). Simultaneously obtaining consistent results in N-based and O-based metallicity-sensitive line ratios strongly suggests that possible evolution in N/O at fixed O/H does not lead us to false conclusions regarding the -SFR-Z relation, demonstrating the power of using multiple line ratios to study the evolution of metallicity scaling relations.
4.1.2 Ionization parameter and hardness of the ionizing spectrum
Steidel et al. (2016) suggested that the ionizing spectrum is harder at fixed nebular metallicity at high redshifts because of low Fe/O (and therefore low Fe/H at fixed O/H) driven by the young ages of high-redshift stellar populations (see also Strom et al., 2017). This deficiency of Fe relative to O is thought to be a result of the time-delayed nature of Fe enrichment from Type Ia supernovae compared to the prompt enrichment of O from Type II supernovae. In a harder ionizing spectrum, the increased abundance of high-energy ultraviolet photons relative to those at lower energy leads to larger fractions of ions in high ionization states (i.e., [O iii]) relative to low-ionization states (i.e., [O ii]). Thus a harder ionizing spectrum at fixed metallicity would result in higher excitation-sensitive line ratios at fixed O/H, including O3 and O3N2. The scenario in which the ionization parameter is higher at fixed O/H due to higher sSFR or more concentrated star-formation at high-redshift similarly predicts higher O3 and O3N2 at fixed O/H (Kewley et al., 2013a, 2016; Kashino et al., 2017). However, the two scenarios predict different changes in N2, with a harder ionizing spectrum increasing N2 at fixed O/H, while a higher ionization parameter decreases N2 at fixed O/H.
In the scenario proposed by Steidel et al. (2016), galaxies with the highest sSFR should also have the youngest stellar populations in which Fe/H is lowest. This low Fe abundance in turn produces a harder ionizing spectrum at fixed O/H, such that the highest-sSFR galaxies should have the hardest ionizing spectra at fixed . If this scenario holds, then it could introduce the observed trends in log(O3) and log(O3N2) as a function of log(sSFR) in the absence of a -SFR-Z relation. However, if a harder ionizing spectrum at fixed oxygen abundance is present, then N2 should increase with increasing sSFR at fixed . We observe the opposite trend. Additionally, this scenario predicts that galaxies should have higher O3N2, O3, and N2 than galaxies at fixed O/H. We observe higher O3N2 and O3, but lower N2 at compared to galaxies at fixed and SFR. Therefore, a harder ionizing spectrum at fixed metallicity driven by Fe/O variations cannot simultaneously reproduce the observed trends in O3N2, O3, and N2, and if present would not lead us to falsely infer the presence of both a -SFR-Z relation and an evolving -SFR-Z relation.
Since the evolving ionization parameter scenario suggests that ionization parameter increases at fixed O/H with increasing sSFR, it is straighforward to understand how the trends of log(O3), log(O3N2), and log(N2) vs. log(sSFR) could appear in the absence of metallicity variation. A higher ionization parameter at fixed O/H at high redshift could also introduce the offsets observed in O3N2, N2, and O3 between and galaxies at fixed and SFR. It is thus possible that an increase in ionization parameter at fixed O/H that is dependent on sSFR could reproduce the observed trends in O3N2, N2, and O3 at .
However, N2O2 would not be significantly affected by changes in the ionization parameter, since it is a ratio of collisionally excited lines of two low-ionization species with similar ionization energies (Kewley & Dopita, 2002). The observation of the -SFR-Z relation and the metallicity offset between and galaxies at fixed and SFR based on N2O2 suggests that the trends in O3, O3N2, and N2 are not purely driven by changes in ionization parameter at fixed metallicity. We conclude that our evidence for the existence of a -SFR-Z relation is not introduced by changes in ionization parameter at fixed O/H as a function of sSFR, and that the inferred evolution of the -SFR-Z relation from to is also not a consequence of such evolution.
Collectively, our analyses of potential biases introduced by evolving N/O, ionization parameter, and ionizing spectrum at fixed metallicity suggest that the observed trends in O3N2, N2, N2O2, and O3 are primarily driven by metallicity variations, and that the -SFR-Z relation and evolution in O/H at fixed and SFR are real. We note that the above discussion does not preclude evolution in gas physical conditions with redshift, but instead shows that the examined evolutionary scenarios cannot simultaneously produce our results over the range of emission-line ratios used here in the absence of metallicity variation. We have considered evolution in each property separately, but it may be the case that a combination of the proposed evolutionary scenarios is required to explain high-redshift observations (e.g., both a harder ionizing spectrum and higher N/O at fixed O/H). In that case, a more careful analysis accounting for the magnitude of shifts in line ratios from changes in each property would be needed. However, our results are consistent with a change in metallicity with SFR at fixed being the primary driver of the observed trends in O3, O3N2, N2, and N2O2. Evolution in other gas properties likely has a secondary effect on the strength of these trends.
4.2. Implications of the evolution of the -SFR-Z relation
The existence of a -SFR-Z relation at confirms that the current theoretical framework for galaxy growth through the interplay of inflows, outflows, and star formation is applicable at high redshifts. A -SFR-Z relation is predicted to exist at high redshifts in analytical chemical evolution models (Finlator & Davé, 2008; Davé et al., 2012; Lilly et al., 2013) as well as cosmological hydrodynamical simulations including chemical evolution (Ma et al., 2016; Davé et al., 2017; De Rossi et al., 2017). There are both observational evidence and theoretical predictions that the -SFR-Z relation is a manifestation of a more fundamental relation with gas mass, where the SFR is modulated by the amount of gas in a galaxy (Hughes et al., 2013; Bothwell et al., 2013, 2016a, 2016b; Zahid et al., 2014a; Ma et al., 2016; Davé et al., 2017). Confirmation of a -SFR-Z relation at suggests that galaxy chemical evolution is linked to gas content at high redshifts as well. The increasing number of observations of the cold gas content of high-redshift galaxies (e.g., Tacconi et al., 2013) will allow for investigations of the relation between , SFR, Z, and gas fraction at high redshifts.
By comparing residuals in metallicity and sSFR around the MZR and mean -sSFR relation, we have quantified the strength of the SFR dependence of the -SFR-Z relation at both and . Current cosmological hydrodynamical simulations predict that the strength of the SFR dependence does not change with redshift (Davé et al., 2017; De Rossi et al., 2017). Using the mufasa simulations (Davé et al., 2016), Davé et al. (2017) predicted the slope of the log(O/H) vs. log(sSFR) relation, finding the preferred slope to be and independent of redshift. We have quantified this measure of the -SFR-Z relation for our sample, providing best-fit slopes based on the O3N2, N2, and N2O2 metallicity indicators in Table 3.
We compare our observed log(O/H) vs. log(sSFR) relations to the prediction of Davé et al. (2017) in the middle column of Figure 3, and perform the same comparison for the sample in the right column. In each panel, the solid black line is the best-fit relation and the dashed black line shows the prediction of Davé et al. (2017). We find weaker SFR dependence at than predicted by Davé et al. (2017) based on O3N2 and N2, and stronger SFR dependence when using N2O2 to estimate metallicites. The O3N2, N2, and N2O2 best-fit slopes all agree with the Davé et al. (2017) prediction within 2. Taking the uncertainty-weighted average of the three slopes yields a slope of , which is within 1 of a slope of . Our results are thus consistent with the predictions of the mufasa simulations, although both the measurement and systematic uncertainties remain large.
The SFR dependence of the sample displays a similar strength to that of galaxies with log(/M and log(sSFR/yr when using the N2 and N2O2 indicators (Fig. 3). When using the O3N2 indicator, the relation appears to be somewhat stronger than at . Overall, the observations do not suggest large changes in the strength of the SFR dependence of metallicity at fixed and SFR over the past 10.5 Gyr. We caution that a detailed comparison of the strength of the and -SFR-Z relation requires a more complete understanding of the redshift evolution of gas physical conditions and the corresponding effects on metallicity indicators. Recalibration of strong-line ratio metallicity relations at high redshift using electron-temperature-based direct metallicities provides a promising avenue to eliminate these systematics (e.g., Jones et al., 2015; Sanders et al., 2016a).
The dex offset toward lower metallicity at fixed and SFR observed from to demonstrates that the -SFR-Z relation is not redshift invariant. While this shift in metallicity is fairly small, a systematic offset is observed across more than an order of magnitude in and SFR using four different metallicity-sensitive line ratios (O3N2, N2, N2O2, and O3). Observing the evolution of the -SFR-Z relation in multiple line ratios simultaneously allowed us to show that this metallicity offset cannot be a false inference due to potential evolution of metallicity calibrations with redshift.
In Sanders et al. (2015), we found a similar evolution in O/H at fixed and SFR, and speculated that such an offset could be introduced if the inflow rate exceeded the sum of the SFR and outflow rate such that the gas reservoir grows faster than it can be processed via star formation. While such a gas-accumulation phase is predicted to exist, both models and observations suggest that it should only occur at (Davé et al., 2012; Papovich et al., 2011). This phase can be made to reach in models with no outflows (Davé et al., 2012), which are clearly unphysical given the observational constraints on the occurrence of galactic winds at high redshifts (e.g., Steidel et al., 2010). It is thus unlikely that we are observing the buildup of galaxy gas reservoirs.
If the most fundamental relation is between , metallicity, and gas content and that relation is redshift invariant, then an evolving -SFR-Z relation would be indicative of an evolving relation between SFR and gas mass. If a non-evolving relation between , gas fraction, and metallicity exists, then galaxies at and have the same gas mass at fixed and metallicity. The observed trend of decreasing metallicity at fixed and SFR with increasing redshift could then be understood as decreasing SFR at fixed and gas fraction (i.e., lower star-formation efficiency). However, an inferred decrease in star-formation efficiency at fixed is in conflict with the interpretation of recent observations of cold gas in high-redshift galaxies. Scoville et al. (2016, 2017) found that, at fixed star-formation efficiency per unit ISM gas mass increases with increasing redshift using ALMA observations of luminous star-forming galaxies at . Furthermore, molecular gas depletion timescales of galaxies on the mean -SFR relation are shorter at than at (Tacconi et al., 2013; Genzel et al., 2015), suggesting an increase in star-formation efficiency with redshift. Reconciling these observations with the observed evolution of the -SFR-Z relation requires an evolving relationship among , gas fraction, and metallicity such that metallicity decreases at fixed and gas fraction with increasing redshift. Since a decreasing star-formation efficiency with increasing redshift at fixed conflicts with observational constraints, we must investigate other drivers of -SFR-Z evolution.
The cause of an evolving -SFR-Z relation can also be understood through analytical chemical evolution models. The gas-regulator model of Lilly et al. (2013) allows for an evolving -SFR-Z relation if the gas consumption timescale and/or the mass-loading factor (=outflow rate/SFR) at fixed change with redshift. In this context, an evolving relation toward lower metallicity at fixed and SFR with increasing redshift suggests that, at fixed , either the gas consumption timescale is longer (i.e., star-formation efficiency is lower) at higher redshifts or is higher at earlier times. The equilibrium model of Davé et al. (2012) similarly predicts lower O/H at fixed and SFR at high redshifts if increases at fixed with increasing redshift. Although a lower star-formation efficiency at higher redshift appears to be in conflict with the observations detailed above, a larger typical high-redshift mass-loading factor is at least broadly consistent with observational constraints over a wide range of and redshift (e.g., Pettini et al., 2002; Rupke et al., 2005; Weiner et al., 2009; Steidel et al., 2010; Heckman et al., 2015; Chisholm et al., 2017). We do note, however, that estimates of carry large systematic uncertainties.
In both the equilibrium model of Davé et al. (2012) and the gas-regulator model of Lilly et al. (2013), the ISM metallicity at fixed and SFR decreases if the metallicity of the inflowing gas decreases. Although accreted gas is relatively unenriched compared to the ISM, it is not metal-free. Numerical simulations have shown that accreted gas is a mix of relatively pristine gas from the IGM and enriched gas that was ejected in past outflows (e.g., Oppenheimer et al., 2010; Segers et al., 2016; Anglés-Alcázar et al., 2017). Recycled gas can even become the dominant source of fuel for star formation at (Oppenheimer et al., 2010). Thus evolution toward lower metallicity at fixed and SFR at could also be explained by a decrease in the metallicity of infalling gas at high redshift caused by a lower importance of recycled gas accretion relative to pristine accretion from the IGM. Numerical simulations agree with this scenario. Indeed, in the models of Davé et al. (2011), an increase in the metallicity of infalling gas relative to that of the ISM was the primary driver of the increase in metallicity at fixed with decreasing redshift. Anglés-Alcázar et al. (2017) found that the relative importance of recycled gas to total accretion increases with decreasing redshift in the FIRE zoom-in simulations and additionally suggest that transfer of metals between galaxies via galactic winds occurs at , further increasing the metallicity of infalling gas at compared to that at .
We conclude that the offset toward lower O/H at fixed and SFR with increasing redshift is most likely caused by an increase in the mass-loading factor at fixed from to and a decrease in the metallicity of infalling gas due to a higher relative importance of pristine accretion from the IGM at .
4.3. The inconsistency of results based on O32
While results based on O3N2, N2, N2O2, O3, and R23 are all consistent with respect to both the existence of a -SFR-Z relation and the dex offset toward lower metallicity at fixed and SFR, performing the same analysis using O32 yields different results. The log(O32) vs. log(sSFR) diagram shows no evidence for SFR dependence of O/H at fixed (Fig. 4). Furthermore, there is little if any evolution in O32 at fixed and SFR from to (Fig. 8, middle panel). The disagreement between results based on O32 compared to those based on the other line ratios requires closer examination.
Since the emission lines in O32 are widely separated in wavelength, it is natural to suspect that incorrect reddening corrections may give rise to discrepant results based on O32. If there are large galaxy-to-galaxy deviations from the assumed Cardelli et al. (1989) attenuation curve, a trend in O32 with SFR at fixed could be washed out. However, systematic effects associated with galaxy-to-galaxy variations in the attenuation curve do not appear to have a significant effect on the O32 results, since we see strong trends in N2O2 and R23 (which also require a reddening correction) with SFR at fixed .
SFR dependence of O32 at fixed could also be hidden if our assumed dust-correction recipe overestimates E(B-V) for galaxies lying above the mean SFR- relation and/or underestimates E(B-V) in the opposite regime. In this case, O32 values at low log(sSFR) would be overestimated while the opposite would occur at high log(sSFR), masking the presence of a -SFR-Z relation. Interestingly, such a scenario would steepen log(R23) vs. log(sSFR) and log(N2O2) vs. log(sSFR) beyond what is expected based on the -SFR-Z relation because R23 increases and N2O2 decreases with increasing SFR at fixed (Figs. 3 and 6). Indeed, we find that the slope of log(O/H) vs. log(sSFR) is steepest when metallicities are based on N2O2, and that log(R23) vs. log(sSFR) displays the strongest correlation of all line ratios considered here. It is therefore possible that our dust-correction recipe leads to either underestimated E(B-V) for galaxies below the SFR- relation, overestimated E(B-V) for objects above the SFR- relation, or both. If true, a bias in E(B-V) dependent on SFR suggests that the nebular attenuation curve systematically changes with SFR at fixed at . Studies of the stellar continuum attenuation curve and the differential reddening between the continuum and nebular emission lines at high redshifts have similarly suggested a systematic dependence of the shape of the attenuation curve on SFR and sSFR (Kriek & Conroy, 2013; Price et al., 2014; Reddy et al., 2015). We note that the resulting bias would affect the measured strength of the SFR dependence of O/H at fixed using O3N2, N2, and O3 as well, since biases in E(B-V) will change log(sSFR).
Biases in reddening corrections may also explain why no evolution in O32 at fixed and SFR is observed from to . If E(B-V) is systematically overestimated in the sample, then the high-redshift O32 values would be underestimated and fall closer to the galaxies, reducing any offset present. If this is the case, then the offset in O/H at fixed and SFR based on N2O2 is overestimated. In Figure 7, the metallicity offset at fixed and SFR based on N2O2 is larger than what is found using O3N2 and N2, consistent with an overestimate of the reddening correction at . It is thus plausible that biases in the dust-correction can explain the discrepant O32 results.
Unlike O3, O3N2, N2, N2O2, and R23, O32 directly probes the ionization parameter and is only sensitive to metallicity because of the anticorrelation between ionization parameter and metallicity. This anticorrelation arises because gas-phase metallicity and stellar metallicity are correlated, giving rise to harder ionizing spectra and, consequently, higher ionization parameters in lower metallicity star-forming regions (Dopita et al., 2006a, b). The O32 results could be explained if ionization parameter does not depend on metallicity at . However, such a scenario would weaken trends in O3N2 and O3, both of which are strongly sensitive to ionization parameter in addition to metallicity. We observe clear trends in O3N2 and O3 as a function of SFR at fixed . Furthermore, O32 is clearly still related to metallicity given that O32 is anticorrelated with stellar mass, and a similar MZR is obtained when using O32 compared to those based on O3N2, N2, and N2O2 (Fig. 2). We conclude that ionization parameter and metallicity are still anticorrelated at , though not necessarily in the same form as at .
Another possibility is that the scatter in the ionization parameter vs. metallicity relation is significantly larger at high redshifts than at . If this is the case, additional scatter would be introduced in the relationship between O32 and metallicity, potentially washing out trends in O32 with SFR at fixed . This scenario can be tested by measuring the scatter in O32 at fixed metallicity at , where metallicity is based on temperature-sensitive auroral-line measurements, but a data set on which to perform such an analysis does not yet exist.
Based on the information currently available, biases arising from the reddening correction are the most likely explanation of the discrepant O32 results. These biases are such that E(B-V) is systematically overestimated at , and the magnitude of this overestimate increases with increasing SFR at fixed .
5. Summary and conclusions
We have investigated the relationship between , SFR, and gas-phase oxygen abundance at high redshifts using a large, representative sample of star-forming galaxies from the MOSDEF survey. The MOSDEF data set allows us to study this relation using multiple metallicity- and excitation-sensitive line ratios (O3N2, N2, N2O2, O32, O3, R23), and derive robust dust-corrected SFRs based on H luminosity. We searched for the presence of a -SFR-Z relation at by looking for correlations between the scatter around the MZR and the mean -sSFR relation. We additionally performed a direct comparison of stacks of and galaxies matched in and SFR to determine whether or not the -SFR-Z relation evolves with redshift. Our main results are summarized below.
We presented the detection of a -SFR-Z relation at based on metallicities estimated using three different emission-line ratios (O3N2, N2, and N2O2). While it is non-trivial to estimate metallicity using O3 and R23 due to a double-valued nature, results based on observed O3 and R23 are consistent. This study uniquely performed an analysis of the -SFR-Z relation using multiple emission lines simultaneously, which allowed us to rule out the possibility of evolving physical conditions in high-redshift star-forming regions introducing the observed trends in the absence of a -SFR-Z relation. Our results cannot be reproduced by the proposed redshift evolution of electron density, N/O, ionization parameter, or shape of the ionizing spectrum at fixed metallicity in the absence of metallicity variations. However, our analysis does not confirm or rule out the presence of any of the proposed evolutionary scenarios in our high-redshift sample. We find that the SFR dependence of the observed -SFR-Z relation is similar in strength to the predictions from the recent mufasa cosmological hydrodynamical simulations of Davé et al. (2017).
We show strong evidence that the -SFR-Z relation is not redshift invariant, but evolves with redshift such that galaxies have dex lower metallicity than galaxies at fixed and SFR. Our results are consistent between five different line ratios (O3N2, N2, N2O2, O3, and R23). These results argue against the existence of a non-evolving -SFR-Z relation (Mannucci et al., 2010). The evolving -SFR-Z relation suggests an evolving relation between , gas fraction, and metallicity based on observations implying higher star-formation efficiency and lower molecular gas depletion times at high redshifts (Tacconi et al., 2013; Genzel et al., 2015; Scoville et al., 2016, 2017). Furthermore, we found that the trend toward lower O/H at fixed and SFR is likely driven by an increase in the mass-loading factor and a decrease in the metallicity of infalling gas with redshift at fixed . The latter suggests that accretion of recycled gas is less important relative to accretion of pristine gas from the IGM at than at .
Despite observing consistent trends using O3N2, N2, N2O2, O3, and R23, we found that results based upon O32 do not display the presence of a -SFR-Z relation or significant redshift evolution in metallicity at fixed and SFR. Given the agreement of results based on all other line ratios, we conclude that systematic effects must bias the observed trends in O32. A comparison of results based on O32, N2O2, and R23 (all of which require reddening corrections) suggests that E(B-V) is overestimated at when E(B-V) is determined using H/H and the Cardelli et al. (1989) Milky Way extinction curve, and that the magnitude of this overestimate increases with increasing SFR at fixed . Reevaluation of the nebular attenuation curve may be required at high redshifts.
The existence of a -SFR-Z relation at confirms that the theoretical framework through which we view galaxy evolution is applicable at high redshifts. Interplay among gas inflows, the gas reservoir, star formation, feedback, and gas outflows have shaped the growth history of the baryonic content of galaxies since at least . This analysis shows the promise of statistical high-redshift samples to make higher-order tests of cosmological hydrodynamical simulations including chemical evolution. Our ability to utilize rich high-redshift spectroscopic data sets such as the MOSDEF data set to the fullest requires a complete understanding of the evolution of physical conditions in star-forming regions and metallicity calibrations with redshift. Until such understanding is attained, detailed quantitative comparisons of high-redshift data and chemical evolution models will necessarily need caveats. New observational facilities on the horizon such as the James Webb Space Telescope (JWST) and Thirty Meter Telescope (TMT) will obtain large samples of temperature-sensitive auroral-line measurements for high-redshift galaxies that will revolutionize the determination of metallicities at high redshifts.
References
- Abazajian et al. (2009) Abazajian, K. N., Adelman-McCarthy, J. K., Agüeros, M. A., et al. 2009, ApJS, 182, 543
- Amorín et al. (2010) Amorín, R. O., Pérez-Montero, E., & Vílchez, J. M. 2010, ApJ, 715, L128
- Andrews & Martini (2013) Andrews, B. H., & Martini, P. 2013, ApJ, 765, 140
- Anglés-Alcázar et al. (2017) Anglés-Alcázar, D., Faucher-Giguère, C.-A., Kereš, D., et al. 2017, MNRAS, 470, 4698
- Azadi et al. (2017) Azadi, M., Coil, A. L., Aird, J., et al. 2017, ApJ, 835, 27
- Belli et al. (2013) Belli, S., Jones, T., Ellis, R. S., & Richard, J. 2013, ApJ, 772, 141
- Bothwell et al. (2016a) Bothwell, M. S., Maiolino, R., Cicone, C., Peng, Y., & Wagg, J. 2016a, A&A, 595, A48
- Bothwell et al. (2013) Bothwell, M. S., Maiolino, R., Kennicutt, R., et al. 2013, MNRAS, 433, 1425
- Bothwell et al. (2016b) Bothwell, M. S., Maiolino, R., Peng, Y., et al. 2016b, MNRAS, 455, 1156
- Brammer et al. (2012) Brammer, G. B., van Dokkum, P. G., Franx, M., et al. 2012, ApJS, 200, 13
- Brinchmann et al. (2004) Brinchmann, J., Charlot, S., White, S. D. M., et al. 2004, MNRAS, 351, 1151
- Brown et al. (2016) Brown, J. S., Martini, P., & Andrews, B. H. 2016, MNRAS, 458, 1529
- Calzetti et al. (2000) Calzetti, D., Armus, L., Bohlin, R. C., et al. 2000, ApJ, 533, 682
- Cardelli et al. (1989) Cardelli, J. A., Clayton, G. C., & Mathis, J. S. 1989, ApJ, 345, 245
- Chabrier (2003) Chabrier, G. 2003, PASP, 115, 763
- Chisholm et al. (2017) Chisholm, J., Tremonti, C. A., Leitherer, C., & Chen, Y. 2017, MNRAS, 469, 4831
- Christensen et al. (2012) Christensen, L., Richard, J., Hjorth, J., et al. 2012, MNRAS, 427, 1953
- Coil et al. (2015) Coil, A. L., Aird, J., Reddy, N., et al. 2015, ApJ, 801, 35
- Conroy et al. (2009) Conroy, C., Gunn, J. E., & White, M. 2009, ApJ, 699, 486
- Cullen et al. (2014) Cullen, F., Cirasuolo, M., McLure, R. J., Dunlop, J. S., & Bowler, R. A. A. 2014, MNRAS, 440, 2300
- Curti et al. (2017) Curti, M., Cresci, G., Mannucci, F., et al. 2017, MNRAS, 465, 1384
- Davé et al. (2011) Davé, R., Finlator, K., & Oppenheimer, B. D. 2011, MNRAS, 416, 1354
- Davé et al. (2012) —. 2012, MNRAS, 421, 98
- Davé et al. (2017) Davé, R., Rafieferantsoa, M. H., Thompson, R. J., & Hopkins, P. F. 2017, MNRAS, 467, 115
- Davé et al. (2016) Davé, R., Thompson, R., & Hopkins, P. F. 2016, MNRAS, 462, 3265
- De Rossi et al. (2017) De Rossi, M. E., Bower, R. G., Font, A. S., Schaye, J., & Theuns, T. 2017, ArXiv e-prints, arXiv:1704.00006
- Dopita et al. (2006a) Dopita, M. A., Fischera, J., Sutherland, R. S., et al. 2006a, ApJ, 647, 244
- Dopita et al. (2006b) —. 2006b, ApJS, 167, 177
- Ellison et al. (2008) Ellison, S. L., Patton, D. R., Simard, L., & McConnachie, A. W. 2008, ApJ, 672, L107
- Erb et al. (2006) Erb, D. K., Shapley, A. E., Pettini, M., et al. 2006, ApJ, 644, 813
- Finlator & Davé (2008) Finlator, K., & Davé, R. 2008, MNRAS, 385, 2181
- Genzel et al. (2015) Genzel, R., Tacconi, L. J., Lutz, D., et al. 2015, ApJ, 800, 20
- Grasshorn Gebhardt et al. (2016) Grasshorn Gebhardt, H. S., Zeimann, G. R., Ciardullo, R., et al. 2016, ApJ, 817, 10
- Hao et al. (2011) Hao, C.-N., Kennicutt, R. C., Johnson, B. D., et al. 2011, ApJ, 741, 124
- Heckman et al. (2015) Heckman, T. M., Alexandroff, R. M., Borthakur, S., Overzier, R., & Leitherer, C. 2015, ApJ, 809, 147
- Henry et al. (2013) Henry, A., Scarlata, C., Domínguez, A., et al. 2013, ApJ, 776, L27
- Holden et al. (2016) Holden, B. P., Oesch, P. A., González, V. G., et al. 2016, ApJ, 820, 73
- Hughes et al. (2013) Hughes, T. M., Cortese, L., Boselli, A., Gavazzi, G., & Davies, J. I. 2013, A&A, 550, A115
- Hunt et al. (2016) Hunt, L., Dayal, P., Magrini, L., & Ferrara, A. 2016, MNRAS, 463, 2002
- Jones et al. (2015) Jones, T., Martin, C., & Cooper, M. C. 2015, ApJ, 813, 126
- Kacprzak et al. (2016) Kacprzak, G. G., van de Voort, F., Glazebrook, K., et al. 2016, ApJ, 826, L11
- Kashino et al. (2017) Kashino, D., Silverman, J. D., Sanders, D., et al. 2017, ApJ, 835, 88
- Kauffmann et al. (2003) Kauffmann, G., Heckman, T. M., White, S. D. M., et al. 2003, MNRAS, 341, 33
- Kennicutt (1998) Kennicutt, Jr., R. C. 1998, ARA&A, 36, 189
- Kewley & Dopita (2002) Kewley, L. J., & Dopita, M. A. 2002, ApJS, 142, 35
- Kewley et al. (2013a) Kewley, L. J., Dopita, M. A., Leitherer, C., et al. 2013a, ApJ, 774, 100
- Kewley et al. (2013b) —. 2013b, ApJ, 774, 100
- Kewley & Ellison (2008) Kewley, L. J., & Ellison, S. L. 2008, ApJ, 681, 1183
- Kewley et al. (2015) Kewley, L. J., Zahid, H. J., Geller, M. J., et al. 2015, ApJ, 812, L20
- Kewley et al. (2016) Kewley, L. J., Yuan, T., Nanayakkara, T., et al. 2016, ApJ, 819, 100
- Köppen & Hensler (2005) Köppen, J., & Hensler, G. 2005, A&A, 434, 531
- Kriek & Conroy (2013) Kriek, M., & Conroy, C. 2013, ApJ, 775, L16
- Kriek et al. (2009) Kriek, M., van Dokkum, P. G., Labbé, I., et al. 2009, ApJ, 700, 221
- Kriek et al. (2015) Kriek, M., Shapley, A. E., Reddy, N. A., et al. 2015, ApJS, 218, 15
- Lara-López et al. (2010) Lara-López, M. A., Cepa, J., Bongiovanni, A., et al. 2010, A&A, 521, L53
- Lilly et al. (2013) Lilly, S. J., Carollo, C. M., Pipino, A., Renzini, A., & Peng, Y. 2013, ApJ, 772, 119
- Ly et al. (2016) Ly, C., Malkan, M. A., Rigby, J. R., & Nagao, T. 2016, ApJ, 828, 67
- Ma et al. (2016) Ma, X., Hopkins, P. F., Faucher-Giguère, C.-A., et al. 2016, MNRAS, 456, 2140
- Maier et al. (2014) Maier, C., Lilly, S. J., Ziegler, B. L., et al. 2014, ApJ, 792, 3
- Maiolino et al. (2008) Maiolino, R., Nagao, T., Grazian, A., et al. 2008, A&A, 488, 463
- Mannucci et al. (2010) Mannucci, F., Cresci, G., Maiolino, R., Marconi, A., & Gnerucci, A. 2010, MNRAS, 408, 2115
- Masters et al. (2016) Masters, D., Faisst, A., & Capak, P. 2016, ApJ, 828, 18
- Masters et al. (2014) Masters, D., McCarthy, P., Siana, B., et al. 2014, ApJ, 785, 153
- McGaugh (1991) McGaugh, S. S. 1991, ApJ, 380, 140
- McLean et al. (2012) McLean, I. S., Steidel, C. C., Epps, H. W., et al. 2012, in Society of Photo-Optical Instrumentation Engineers (SPIE) Conference Series, Vol. 8446, Society of Photo-Optical Instrumentation Engineers (SPIE) Conference Series
- Momcheva et al. (2016) Momcheva, I. G., Brammer, G. B., van Dokkum, P. G., et al. 2016, ApJS, 225, 27
- Oey et al. (2007) Oey, M. S., Meurer, G. R., Yelda, S., et al. 2007, ApJ, 661, 801
- Onodera et al. (2016) Onodera, M., Carollo, C. M., Lilly, S., et al. 2016, ApJ, 822, 42
- Oppenheimer et al. (2010) Oppenheimer, B. D., Davé, R., Kereš, D., et al. 2010, MNRAS, 406, 2325
- Papovich et al. (2011) Papovich, C., Finkelstein, S. L., Ferguson, H. C., Lotz, J. M., & Giavalisco, M. 2011, MNRAS, 412, 1123
- Pérez-Montero (2014) Pérez-Montero, E. 2014, MNRAS, 441, 2663
- Pérez-Montero & Contini (2009) Pérez-Montero, E., & Contini, T. 2009, MNRAS, 398, 949
- Pettini & Pagel (2004) Pettini, M., & Pagel, B. E. J. 2004, MNRAS, 348, L59
- Pettini et al. (2002) Pettini, M., Rix, S. A., Steidel, C. C., et al. 2002, ApJ, 569, 742
- Pilyugin & Thuan (2005) Pilyugin, L. S., & Thuan, T. X. 2005, ApJ, 631, 231
- Price et al. (2014) Price, S. H., Kriek, M., Brammer, G. B., et al. 2014, ApJ, 788, 86
- Reddy et al. (2012) Reddy, N. A., Pettini, M., Steidel, C. C., et al. 2012, ApJ, 754, 25
- Reddy et al. (2015) Reddy, N. A., Kriek, M., Shapley, A. E., et al. 2015, ApJ, 806, 259
- Rupke et al. (2005) Rupke, D. S., Veilleux, S., & Sanders, D. B. 2005, ApJS, 160, 115
- Salim et al. (2015) Salim, S., Lee, J. C., Davé, R., & Dickinson, M. 2015, ApJ, 808, 25
- Salim et al. (2014) Salim, S., Lee, J. C., Ly, C., et al. 2014, ApJ, 797, 126
- Salim et al. (2007) Salim, S., Rich, R. M., Charlot, S., et al. 2007, ApJS, 173, 267
- Sánchez et al. (2015) Sánchez, S. F., Pérez, E., Rosales-Ortega, F. F., et al. 2015, A&A, 574, A47
- Sanders et al. (2017) Sanders, R. L., Shapley, A. E., Zhang, K., & Yan, R. 2017, ApJ, 850, 136
- Sanders et al. (2015) Sanders, R. L., Shapley, A. E., Kriek, M., et al. 2015, ApJ, 799, 138
- Sanders et al. (2016a) —. 2016a, ApJ, 825, L23
- Sanders et al. (2016b) —. 2016b, ApJ, 816, 23
- Scoville et al. (2016) Scoville, N., Sheth, K., Aussel, H., et al. 2016, ApJ, 820, 83
- Scoville et al. (2017) Scoville, N., Lee, N., Vanden Bout, P., et al. 2017, ApJ, 837, 150
- Segers et al. (2016) Segers, M. C., Crain, R. A., Schaye, J., et al. 2016, MNRAS, 456, 1235
- Shapley et al. (2005) Shapley, A. E., Coil, A. L., Ma, C.-P., & Bundy, K. 2005, ApJ, 635, 1006
- Shapley et al. (2015) Shapley, A. E., Reddy, N. A., Kriek, M., et al. 2015, ApJ, 801, 88
- Shivaei et al. (2015) Shivaei, I., Reddy, N. A., Shapley, A. E., et al. 2015, ApJ, 815, 98
- Skelton et al. (2014) Skelton, R. E., Whitaker, K. E., Momcheva, I. G., et al. 2014, ApJS, 214, 24
- Speagle et al. (2014) Speagle, J. S., Steinhardt, C. L., Capak, P. L., & Silverman, J. D. 2014, ApJS, 214, 15
- Springel et al. (2005) Springel, V., White, S. D. M., Jenkins, A., et al. 2005, Nature, 435, 629
- Steidel et al. (2010) Steidel, C. C., Erb, D. K., Shapley, A. E., et al. 2010, ApJ, 717, 289
- Steidel et al. (2016) Steidel, C. C., Strom, A. L., Pettini, M., et al. 2016, ApJ, 826, 159
- Steidel et al. (2014) Steidel, C. C., Rudie, G. C., Strom, A. L., et al. 2014, ApJ, 795, 165
- Stott et al. (2013) Stott, J. P., Sobral, D., Bower, R., et al. 2013, MNRAS, 436, 1130
- Strom et al. (2017) Strom, A. L., Steidel, C. C., Rudie, G. C., et al. 2017, ApJ, 836, 164
- Tacconi et al. (2013) Tacconi, L. J., Neri, R., Genzel, R., et al. 2013, ApJ, 768, 74
- Tremonti et al. (2004) Tremonti, C. A., Heckman, T. M., Kauffmann, G., et al. 2004, ApJ, 613, 898
- Troncoso et al. (2014) Troncoso, P., Maiolino, R., Sommariva, V., et al. 2014, A&A, 563, A58
- Weiner et al. (2009) Weiner, B. J., Coil, A. L., Prochaska, J. X., et al. 2009, ApJ, 692, 187
- Whitaker et al. (2012) Whitaker, K. E., van Dokkum, P. G., Brammer, G., & Franx, M. 2012, ApJ, 754, L29
- Wuyts et al. (2012) Wuyts, E., Rigby, J. R., Sharon, K., & Gladders, M. D. 2012, ApJ, 755, 73
- Wuyts et al. (2014) Wuyts, E., Kurk, J., Förster Schreiber, N. M., et al. 2014, ApJ, 789, L40
- Wuyts et al. (2016) Wuyts, E., Wisnioski, E., Fossati, M., et al. 2016, ApJ, 827, 74
- Yabe et al. (2014) Yabe, K., Ohta, K., Iwamuro, F., et al. 2014, MNRAS, 437, 3647
- Yabe et al. (2015) Yabe, K., Ohta, K., Akiyama, M., et al. 2015, PASJ, 67, 102
- Yates et al. (2012) Yates, R. M., Kauffmann, G., & Guo, Q. 2012, MNRAS, 422, 215
- York et al. (2000) York, D. G., Adelman, J., Anderson, Jr., J. E., et al. 2000, AJ, 120, 1579
- Zahid et al. (2014a) Zahid, H. J., Dima, G. I., Kudritzki, R.-P., et al. 2014a, ApJ, 791, 130
- Zahid et al. (2014b) Zahid, H. J., Kashino, D., Silverman, J. D., et al. 2014b, ApJ, 792, 75