Ejecta Mass Diagnostics of Type Ia Supernovae
Abstract
We present one-dimensional non-local thermodynamic equilibrium time-dependent radiative transfer simulations (using cmfgen) of two sub-Chandrasekhar (sub-), one and one super- Type Ia SN ejecta models. Three originate from delayed detonation models, and the fourth is a sub- detonation model. Ejecta masses are 1.02, 1.04, 1.40, and 1.70 M⊙, and all models have 0.62 M⊙ of . Sub- model light curves evolve faster, reaching bolometric maximum 2–3 days earlier and having 3–4 days shorter bolometric half light widths. The models vary by 12 per cent at maximum bolometric luminosity and by 0.17 mag in . While increases with ejecta mass it only varies by 5 per cent around 1 mag. Sub- models are 0.25 mag bluer in at . Optical spectra share many similarities, but lower mass models exhibit less UV line blanketing during the photospheric phase. At nebular times, significant NIR spectroscopic differences are seen. In particular, emission lines of the Ca ii NIR triplet; [S iii] 9068,9530; [Ca ii] 7291,7324; [Ar iii] 7135,7751; and [Ni ii] 1.939 m are stronger in higher mass models. The [Ni ii] 1.939 m line is absent in the sub- detonation model, and provides a valuable potential tool to distinguish sub- explosions from explosions. In general, the nebular phase models are too highly ionized. We attribute this to the neglect of clumping and/or the distribution of intermediate mass and iron group elements. The two sub- models, while exploded by different mechanisms, can be distinguished in the and bands at late times (e.g., days).
keywords:
radiative transfer – supernovae: general – white dwarfs1 Introduction
Type Ia supernovae (SNe Ia) are thought to be thermonuclear runaway explosions of carbon-oxygen (C/O) white dwarfs (WDs) (Hoyle & Fowler, 1960), but the formation channel of the progenitor remains uncertain. Determining the progenitor channel(s) of SNe Ia, and their diversity, is of crucial importance since it will improve their use as probes of cosmological parameters (Riess et al., 1998; Perlmutter et al., 1999). Further, understanding the progenitor channel allows us to probe stellar evolution of binary systems prior to the SN occurring, and hence place constraints on both binary synthesis models and binary evolution.
There are two main progenitor channels invoked to explain the origin of SNe Ia – the single degenerate (SD) channel and double degenerate channel. In the “classic” SD channel, the WD accretes matter (usually hydrogen and/or helium) from a non-degenerate star due to binary interaction via Roche lobe overflow. However, mass transfer in the SD channel is not limited to Roche lobe overflow – it can also be mediated by wind mass loss as, for example, in symbiotic systems (see Maoz et al., 2014, for a review). In the SD channel matter accumulates on the white dwarf, where stable burning can occur, until the star approaches the Chandrasekhar mass (1.4 ) and explodes leading to a SN Ia (Whelan & Iben, 1973; Nomoto, 1982).
How the WD explodes has long been a matter of study within the astrophysics community. The different explosion mechanisms include pure detonation (Arnett, 1969; Sim et al., 2010), pure deflagration (Nomoto et al., 1976), delayed detonation and pulsating delayed detonation (Khokhlov, 1991a, b; Gamezo et al., 2005; Livne et al., 2005; Röpke & Niemeyer, 2007; Jackson et al., 2010; Seitenzahl et al., 2013), and gravitationally-confined detonation (GCD) (Plewa et al., 2004). More recent research on the GCD, including 3D full star simulations, was presented by Seitenzahl et al. (2016). For sub- WD masses, a double detonation scenario has been explored (Woosley & Weaver, 1994; Livne & Arnett, 1995; Fink et al., 2007; Fink et al., 2010).
One of the most successful theories at reproducing the properties of standard SNe Ia is the delayed-detonation transition (DDT) model where the WD first undergoes a subsonic deflagration phase. The resulting expansion of the WD creates lower density fuel, which is necessary for the production of intermediate mass elements (IMEs). At a particular density, the burning switches from subsonic to supersonic (Khokhlov, 1991a, b). This scenario is required to recreate the observed chemical stratification. Pure detonation models produce too many iron group elements (IGEs) such as iron and nickel but not enough IMEs at high velocities to reproduce SN Ia spectra. On the other hand, deflagration models produce abundant amounts of IMEs but not enough to power the SN luminosity. This mechanism is a possible channel for under-luminous SNe Ia (Travaglio et al., 2004; Phillips et al., 2007; Jordan et al., 2012; Kromer et al., 2013). One dimensional (1D) DDT models have been very successful in reproducing the observed properties of SNe Ia. However, these models describe the turbulent flame propagation only in a parametrized way. Three dimensional (3D) models better capture the fluid instabilities and mixing. This lead to different ejecta structures that do not reproduce observables as well as 1D models (see e.g. Seitenzahl et al., 2013; Sim et al., 2013b).
The double degenerate scenario corresponds to the merger of two WDs through loss of angular momentum by gravitational wave emission. It is not understood how the merger triggers the explosion, although it is thought that during the merger the smaller mass WD donates matter to the more massive WD. Recently, modeling by Sato et al. (2015) has shown that, depending on the masses of the two WDs, explosions can occur either during the merger phase, provided both WDs are within a mass range between 0.9–1.1 M⊙, or within the merger remnant phase when the more massive object reaches . From their models, the authors estimate that 9 per cent of galactic SNe Ia can be attributed to mergers. One problem in this scenario is that rapid mass accretion of carbon and oxygen leads to an off-centre carbon ignition and subsequently an O/Ne/Mg WD (Saio & Nomoto, 1985). Accretion induced collapse creates additional problems for high accretion rates, leading to the formation of a neutron star instead of a SN Ia. For an extensive review about progenitors of SNe Ia, see Maoz et al. (2014).
When almost the entire C/O WD has burnt, releasing ergs (more energy than the gravitational binding energy of a WD), the energy liberated unbinds the WD, producing an ejecta with no remnant. Ejecta velocities of the order of 10 000 km s-1 are produced, and within minutes, the ejecta reaches a homologous coasting phase (radiation pressure from decay produces second order effects). At early times the ejecta is radiation dominated and heated by the decay of ( for post-maximum evolution). It is because of this main decay chain of , with roughly 1.7 MeV of energy release per decay for and 3.7 MeV per decay for , that these objects are so luminous. However, Dessart et al. (2014a) show the importance of heating the outer (20 000 km s-1) ejecta from other decay channels.
Early work by Stritzinger et al. (2006) suggested sub- WDs as progenitors for some SNe Ia based on comparisons of light curves of 16 SNe with analytical models of nuclear decay luminosities and energy deposition. Scalzo et al. (2014a, b), Sim et al. (2010); Sim et al. (2013a), and Blondin et al. (2017) have shown that there is both observational and theoretical evidence for sub- explosions. From photometric model fitting, Scalzo et al. (2014a, b) shows that the mass distribution for SNe Ia includes both sub- and super- events. Scalzo et al. (2014b) argue that 25–50 per cent of SN Ia events deviate from events, with most of these occurring as sub- explosions. Therefore, for given measured masses, one can compare SNe Ia to better understand how ejecta mass affects light curves and spectral evolution.
Sim et al. (2010); Sim et al. (2013a) found good agreement with photometric observations at maximum and reproduced IME features in synthetic spectra at maximum with 1D pure detonations of sub- explosions. However, these models decline too rapidly post maximum. This idealized approach ignores the influence of any accreted helium layer. Previous works (Woosley & Weaver, 1994; Livne & Arnett, 1995; Hoeflich & Khokhlov, 1996; Hoeflich et al., 1996; Nugent et al., 1997; Kromer et al., 2010) found difficulties reproducing the observed light curves, colours and spectral evolution after treating the burnt helium layer, which synthesizes a significant amount of .
Woosley et al. (2007) explored a grid of SN Ia models coming from 1.38 M⊙ WDs with varying amounts of mixing and , finding models of similar to have large variations of decline rates ( – which is the change in -band magnitude 15 days after -band maximum (Phillips, 1993)) and anti width-luminosity relationships. Woosley & Kasen (2011) computed hydrodynamic and radiative transfer simulations of sub- mass models for helium-accreting WDs, but the authors only found reasonable agreement with spectra and light curves of common SNe Ia for the most massive white dwarfs with the smallest helium layers they considered. Blondin et al. (2017) looks at broadening our understanding of the width-luminosity relation (WLR) using pure detonations of sub- WDs. Their work shows promising agreement with observations of faint SNe Ia, confirming the need for two WD populations to explain the full behavior of the WLR seen at high and low SN Ia brightnesses.
Observations have shown high-velocity features (HVFs) in early-time spectra of SNe Ia. These features have been used to constrain the explosion scenario (Mazzali et al., 2005a, b; Tanaka et al., 2006; Blondin et al., 2013; Childress et al., 2013; Childress et al., 2014; Silverman et al., 2015; Zhao et al., 2015; Pan et al., 2015). Studying the formation of these features as well as their correlation with galaxy environment can improve our understanding of Type Ia progenitors. We can gain insights, for example, into the density and temperature structure of the outer layers. The latter will reveal itself through changes in ionization and hence the strength of spectral features.
In this paper we study two sub- models (1 M⊙), a model (1.4 M⊙), and a super- model (1.7 M⊙), all with the same mass by design, to determine the effects of ejecta mass. One model is a standard DDT model, two models are standard DDT models whose density have been scaled to give the desired ejecta mass, while the final model arises from a pure detonation in a sub- model. The original DDT models are also somewhat artificial. For example, the onset of detonation in a DDT model is a free parameter. Further, it is impossible in current models to resolve and adequately model the thermonuclear flame (see Ciaraldi-Schoolmann et al. (2013) and references therein). We consider evolution over more than two hundred days in time – from 1 day after the explosion until approximately 220 days after the explosion, and look for diagnostics of ejecta mass () for our mass that can be used to distinguish between the different models. Since the precise explosion mechanism is uncertain, the two sub- models were exploded using different assumptions. Spectra and light curves were computed using non-LTE and time-dependent radiative transfer. Looking for SN Ia diagnostics, we wanted to remove sensitivity of while focusing on ejecta mass to uncover insights in SN Ia evolution, both spectroscopically and photometrically.
The paper is organized as follows. In Section 2, we discuss the techniques used and initial ejecta properties. We compare the bolometric light curves as well as synthetic photometric light curves in Section 3. We discuss the spectral evolution, highlighting the strong spectral differences, in Section 4. In Section 5, we further highlight the distinctions between our two sub- models. In Section 6.1 we comment on the lack of high velocity features. Section 6.2 shows spectral comparison to a few SNe Ia that are close in measured and mass. In Section 6.3 we discuss shortcomings of our models in reproducing spectral characteristics of SNe Ia beyond 20 days post-maximum. Section 7 summarizes our results and conclusions.
2 Technique
To determine spectral and light curve diagnostics we utilize hydrodynamical models that have been evolved from explosion until 0.75 days. Homologous expansion of the ejecta is well established at 100 seconds, and it is assumed to strictly hold at all times thereafter. We allow for non-local thermodynamic equilibrium (non-LTE) and solve the spherically symmetric, time-dependent, relativistic radiative transfer equation in order to produce emergent synthetic spectra from which synthetic light curves (LCs) can be produced.
2.1 Ejecta and Radiative Transfer Modeling
Our models correspond to scaled ejecta of model DDC0 (density scaled by 0.73, model SUB2) and DDC15 (density scaled by 1.22, model SUP), complemented with models DDC10 (no scaling applied, model CHAN) – see Blondin et al. (2013) – and SCH5p5 (density scaled by 0.98, model SUB1) – see Blondin et al. (2017). This density scaling is applied to produce ejecta with the same mass initially (0.62 M⊙), but differing in ejecta mass so that they lie below, at, and above the . This scaling, applied exclusively to the density at 10 seconds after explosion, is obviously artificial. An advantage of this scaling method is that, while the mass varies, the chemical stratification does not. This ensures the models retain their fundamental characteristic of all SN Ia ejecta. We do not compute the combustion nor make any claim that a flame would behave in the way adopted for the corresponding WD mass (i.e., deflagration followed by detonation in the DDC models; pure detonation in the SCH model). Even in the original (unscaled) model, the treatment of combustion is largely imposed rather than computed from first principles. The purpose of the study is to investigate the signatures sensitive to variations in ejecta mass, keeping the mass the same between all models in order to retain only one variable quantity. Model masses, kinetic energies, and important species masses are summarized in Table 1.
The use of scaled DDT models for SUB2 and SUP is problematical since the explosion properties will depend on the mass of the WD. For example, differences in the initial central densities before the explosion will likely lead to different abundance profiles within the ejecta. In particular, sub- WDs, unlike their counterpart with stable IGEs in their inner ejecta, do not exhibit a ‘56Ni hole’ which is a low abundance inside an expansion velocity of 2500 km s-1. However, a comparison of SUB2 with SUB1 will allow us to test the sensitivity of the results to the adopted explosion model. The explosion mechanism for ejecta with super-Chandrasekhar masses is extremely uncertain, and any adopted model will have limitations.
The radiative transfer models have been computed using cmfgen (Hillier & Miller, 1998; Hillier & Dessart, 2012; Dessart et al., 2014a, b), which solves the spherically symmetric, non-local thermodynamic equilibrium (non-LTE), time-dependent, relativistic radiative transfer equation in the co-moving frame. To advance in time, we used a 10 per cent time step for each model starting from 0.75 days until 100 days, after which we used a time step of 10 days. At early times (7 days) during the time sequence, we assumed that -ray photons created from radioactive decays are locally deposited. Otherwise, we approximate the -ray deposition as grey, adopting the procedure from Swartz et al. (1995) and a cm2 g-1. The kinetic energy of decay positrons is locally deposited at all epochs. cmfgen currently treats both one- and two-step decay chains for calculating non-thermal heating.
| Model | Mass | C | O | Na | Mg | Si | S | Ar | ||
|---|---|---|---|---|---|---|---|---|---|---|
| (M⊙) | ( ergs) | (km s-1) | (M⊙) | (M⊙) | (M⊙) | (M⊙) | (M⊙) | (M⊙) | (M⊙) | |
| SUB1 | 1.04 | 1.22 | 10821 | 3.295 | 5.196 | 1.306 | 2.441 | 1.553 | 1.022 | 2.248 |
| SUB2 | 1.02 | 1.17 | 10695 | 8.803 | 3.906 | 4.466(-6) | 2.615 | 1.185 | 7.488 | 1.654 |
| CHAN | 1.40 | 1.51 | 10415 | 2.419 | 9.595 | 1.244 | 9.557 | 2.551 | 1.661 | 3.693 |
| SUP | 1.70 | 1.81 | 10351 | 3.333 | 1.293 | 2.044 | 1.387 | 3.805 | 2.443 | 5.223 |
| Model | Ca | Ti | Cr | Fe | Co | + | ||||
| (M⊙) | (M⊙) | (M⊙) | (M⊙) | (M⊙) | (M⊙) | (M⊙) | ||||
| SUB1 | 2.361 | 2.665 | 1.030 | 2.226 | 5.526 | 1.1 | 5.684 | |||
| SUB2 | 1.822 | 1.083 | 1.516 | 6.654 | 5.680 | 2.6 | 5.710 | |||
| CHAN | 4.120 | 1.486 | 2.689 | 1.020 | 5.713 | 2.5 | 5.708 | |||
| SUP | 5.562 | 1.828 | 2.977 | 1.224 | 5.777 | 3.0 | 5.707 |
2.2 Ejecta Conditions for Radiative Transfer
Table 1 shows the yields for the most abundant species in our ejecta models at 0.75 days. Since the mass is fixed, there are substantial variations in the mass of the IMEs. In particular, the mass of individual IMEs in model SUP is a factor of 3 to 5 larger than in model SUB2; model SUB1 has 1.3 to 1.4 times the mass of IMEs and 1/3 times the iron mass of SUB2. The initial iron abundance in SUB1 is almost a factor of 6 lower than in SUP. The mass of stable nickel ( and ) is 0.011, 0.026, 0.025, and 0.030 M⊙ for SUB1, SUB2, CHAN, and SUP. The presence of stable nickel features in nebular spectra, and the ability to measure the nickel abundance, is discussed in Sections 4 and 6.3.
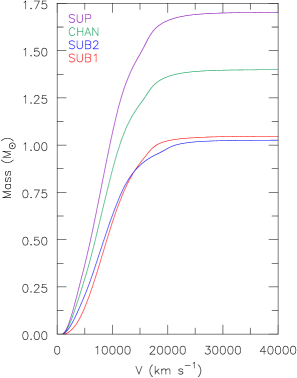
In Fig. 1 we show the outward cumulative mass as a function of velocity. Less than 1 per cent of the mass lies beyond 25 000 km s-1 for all models, and hence we restrict future model ejecta comparisons to velocities less than 30 000 km s-1. Higher velocity material makes very minor contributions to synthetic spectra.
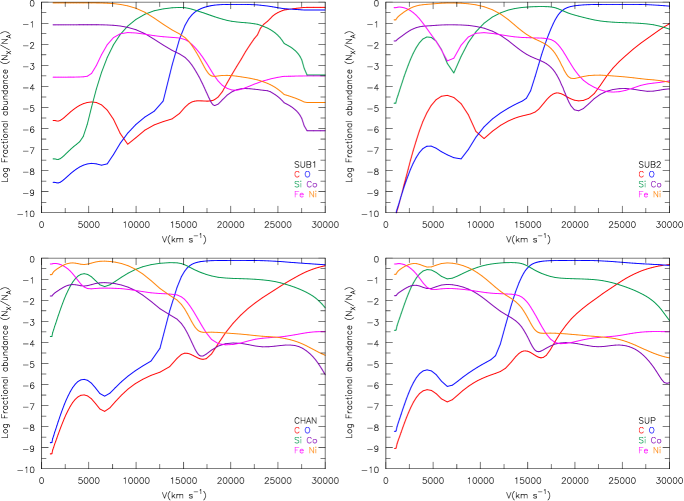
Fig. 2 compares the initial mass fraction at 0.75 days for all models. All but model SUB1 exhibit an ‘ hole’ at velocities less than 2500 km s-1. As noted earlier, the hole in SUB2 is artificial, and arises since the model was scaled from a model based on the explosion of a WD which has a higher central density.
3 Light Curves
The light curves and colour evolution of Type Ia models depends on the progenitor system, and potentially offer a means to distinguish between progenitor systems. Due to differences in ejecta mass, the diffusion time varies between models, giving rise to morphological separations in both the width of each bolometric light curve and the peak luminosity. However, from work by Pinto & Eastman (2000a, b), we expect this effect to be small.
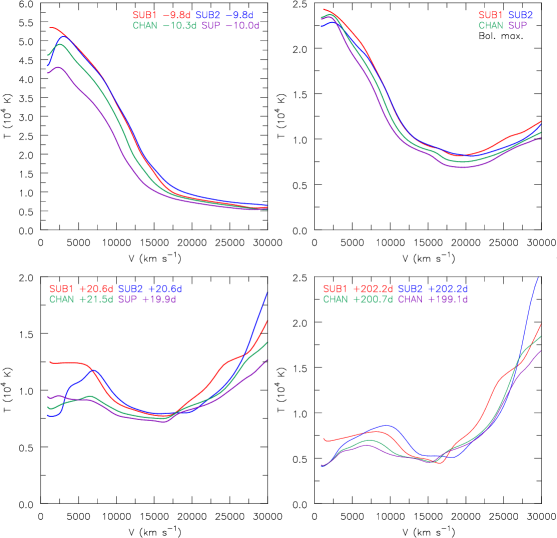
Fig. 3 shows the bolometric light curves of all models relative to the time of explosion. Decreasing ejecta mass (shorter diffusion time) corresponds to a faster evolving supernova. In days since explosion, the bolometric luminosity maximum occurs at 14.4 (3.80 L⊙), 14.4 (3.96 L⊙), 15.84 (3.63 L⊙), and 17.42 (3.47 L⊙) for models SUB1, SUB2, CHAN, and SUP respectively. To characterize the bolometric light curves, we list (time of bolometric maximum), and (the times to rise from half bolometric maximum luminosity to maximum and to decline from bolometric maximum back to half of maximum – see Contardo et al. (2000)) in Table 2. Between 1–1.7 M⊙, we have roughly a 1 day difference in half light rise times (), with SUB ejecta models rising faster. After bolometric maximum, the SUP ejecta model takes roughly days longer than the SUB ejecta models to decline to half light (). With precise measurement determinations of the rise time in , we can put stronger constraints on the ejecta mass for a given mass.
As the mass is the same for all models, differences in the bolometric light curve evolution are primarily due to ejecta mass. However, despite differences in ejecta mass of 70 per cent, the differences are relatively small, though measurable. This effect of ejecta mass should be clearly visible from a statistical sample of deep high cadence observations of SNe Ia.
Fig. 4 shows synthetic light curves plotted in days since -band maximum. The light curves for the two sub- ejecta models tend to be more luminous at maximum (with the exception of the NIR bands) but have fainter nebular luminosities. The former arises because at bolometric maximum and since the peak is earlier, the decay rate is greater. The latter arises because of the less efficient trapping of -rays. Table 2 also lists the peak LC absolute magnitudes for different Johnson bands (), rise times (in days since explosion), and decline parameter for a given band . All bands show a faster rise time for lower-mass ejecta models, just as they do for .
Observational evidence suggests that -band photometry for SNe Ia can provide higher accuracy than the -band calibration galactic distances (Krisciunas et al., 2004, 2007; Wood-Vasey et al., 2008). However, our models have a spread of almost one magnitude in the -band at the time of -band maximum light. Following the temperature separation between models (higher mass cooler ejecta), the higher mass ejecta also show larger flux in the -band at all epochs. Our light curves still show two peaks in the -band as normal SNe Ia do, a consequence of the ionization shift in iron (and other IGEs) going from ionization states 2+1+ (Kasen, 2006). The second peak is of the same brightness for our SUB models compared to higher ejecta mass models. Past the second -band peak, we see roughly a constant decline in all models until close to 150 days past maximum light.
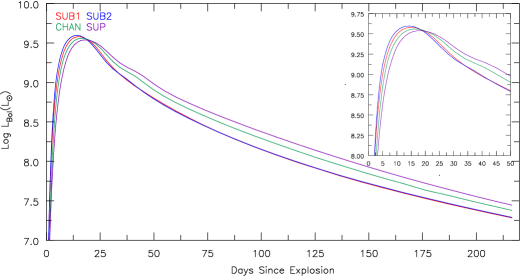
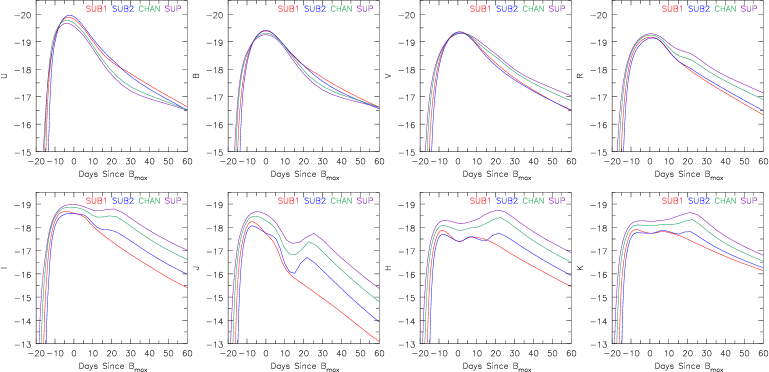
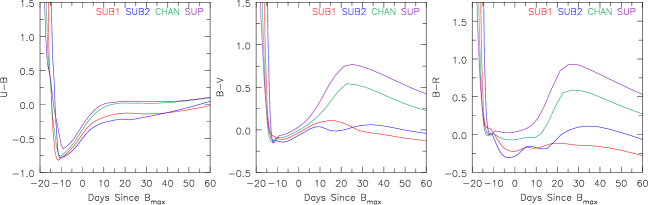
Fig. 5 shows the , , and colour evolution relative to -band maximum. It shows that the lower mass models are bluer at most epochs. There is over a magnitude difference in from sub- to super- around 25 days after . SUB models are bluest in color post -band maximum compared to higher mass models. Post maximum, model SUP remains the most red of all the models, while SUB1 remains bluer than other models after days, a result of higher temperatures and ionization due to larger . This is explored in Figs. 6 and 7 and then in Section 4 where we discuss the spectral evolution.
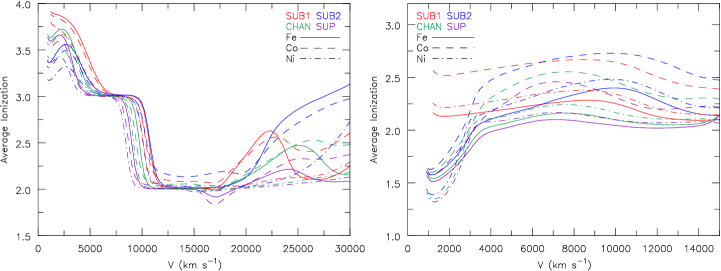
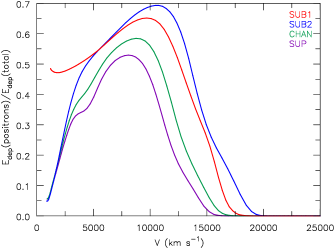
Fig. 6 shows the temperature evolution of our models, with SUB1 and SUB2 maintaining higher temperatures at all epochs. Fig. 7 shows the average ionization for a few IGEs such as iron, cobalt, and nickel. SUB models show a higher ionization compared to higher mass models, producing ejecta with bluer colors. The monotonic temperature distribution of SUB1 below 5000 km s-1 is due to the lack of a ‘ hole’. Fig. 8 shows the fraction of the energy deposition from positrons to the total energy deposition at about 216 days post explosion. At late times SUB1 maintains a higher ionization in the innermost ejecta due to more assumed local positron energy deposition. Generally speaking, SUB1 and SUB2 have higher temperatures at comparable epochs than those of CHAN and SUP. We further discuss the implications of higher temperatures in Section 4.
| Model | ||||||||||||
| (mag) | (days) | (mag) | (mag) | (days) | (mag) | (mag) | (days) | (mag) | (mag) | (days) | (mag) | |
| SUB1 | 19.89 | 14.13 | 1.07 | 19.39 | 16.97 | 0.95 | 19.36 | 17.99 | 0.88 | 19.17 | 17.40 | 0.89 |
| SUB2 | 19.96 | 13.35 | 1.08 | 19.41 | 15.64 | 0.94 | 19.36 | 16.48 | 0.96 | 19.14 | 17.01 | 0.91 |
| CHAN | 19.78 | 14.90 | 1.06 | 19.31 | 18.54 | 0.94 | 19.31 | 19.91 | 0.68 | 19.24 | 18.92 | 0.76 |
| SUP | 19.67 | 15.92 | 1.03 | 19.25 | 19.86 | 0.99 | 19.31 | 21.89 | 0.60 | 19.29 | 20.48 | 0.59 |
| (mag) | (days) | (mag) | (mag) | (days) | (mag) | (mag) | (days) | (mag) | (mag) | (days) | (mag) | |
| SUB1 | 18.68 | 12.86 | 0.70 | 18.24 | 9.60 | 1.54 | 17.87 | 8.76 | 0.29 | 17.90 | 9.62 | 0.08 |
| SUB2 | 18.60 | 13.76 | 0.64 | 18.06 | 8.39 | 1.03 | 17.70 | 7.81 | 0.09 | 17.77 | 9.27 | 0.08 |
| CHAN | 18.87 | 16.41 | 0.44 | 18.48 | 12.73 | 1.26 | 18.08 | 10.73 | 0.10 | 18.10 | 12.40 | 0.02 |
| SUP | 18.99 | 19.01 | 0.27 | 18.67 | 15.29 | 1.17 | 18.30 | 12.91 | 0.02 | 18.28 | 15.25 | 0.07 |
| (mag) | (days) | (mag) | L⊙) | |||||||||
| SUB1 | 8.18 | 13.0 | 14.4 | 3.80 | ||||||||
| SUB2 | 8.02 | 12.44 | 14.4 | 3.96 | ||||||||
| CHAN | 8.83 | 14.75 | 15.84 | 3.63 | ||||||||
| SUP | 9.27 | 16.57 | 17.42 | 3.47 |
4 Spectral Diagnostics
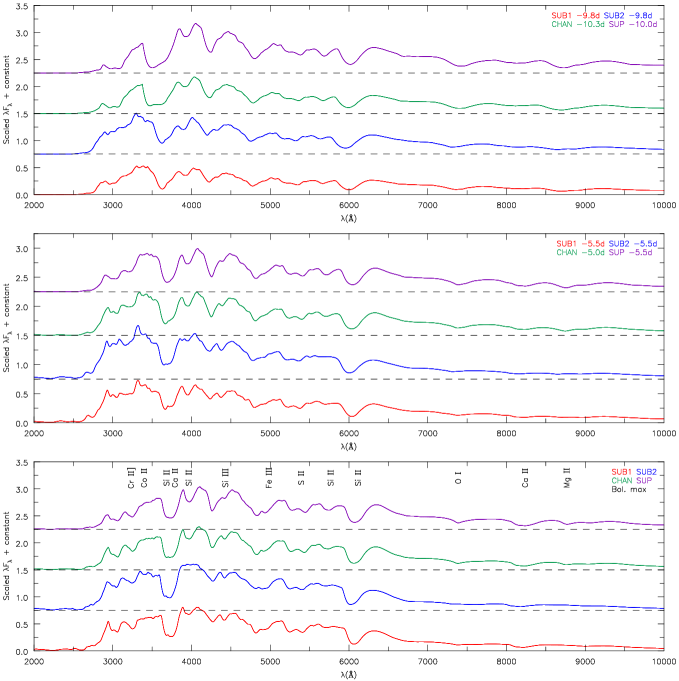
Spectra provide important constraints for distinguishing progenitor and explosion models. However, despite a 70 per cent difference in mass, model optical spectra (Figs. 9, 10, 11, 12, and 13) at most phases are similar, consistent with work by Blondin et al. (2013) who concluded that SNe Ia are mainly distinguished by their mass. This similarity is observed for classical SNe Ia where differences in optical spectra are generally rather subtle (Filippenko, 1997), which presumably occurs because of similarities in composition. Interestingly, optical spectra of models SUB1 and SUB2 are remarkably similar for most phases of evolution, despite the different methods to produce these ejecta models. However, there are differences between models, particularly in the infrared, and these do give rise to useful diagnostics. We investigate these diagnostics by comparing model spectra at time steps of approximately , , , , , , , , and days from bolometric maximum (Figs. 9, 10, 11, 12, and 13). Thus, when comparing observational spectra of SNe Ia from comparable mass, these diagnostics will separate events by ejecta mass. Note that model spectra are plotted for vacuum wavelengths; however, wavelengths 2000 Å listed are quoted in air.
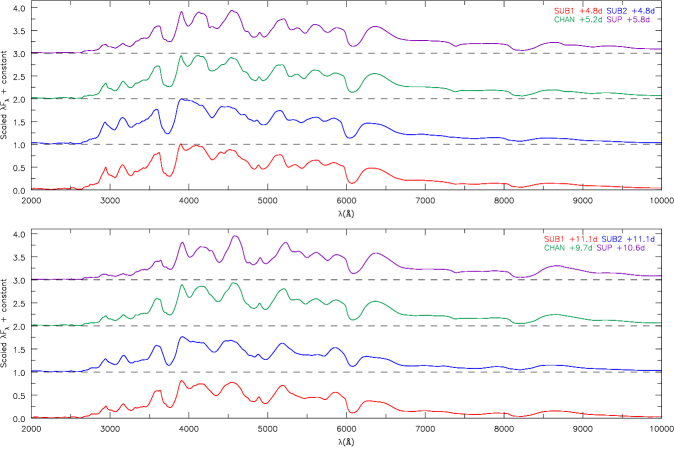
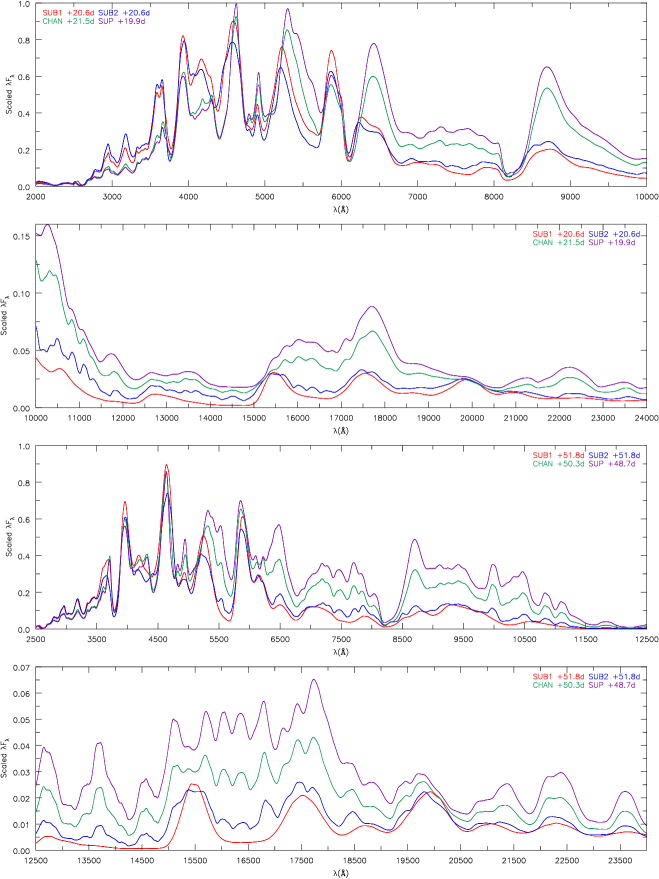
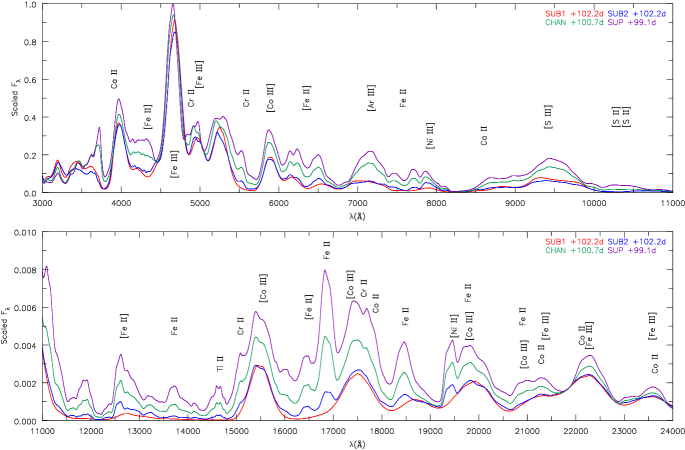
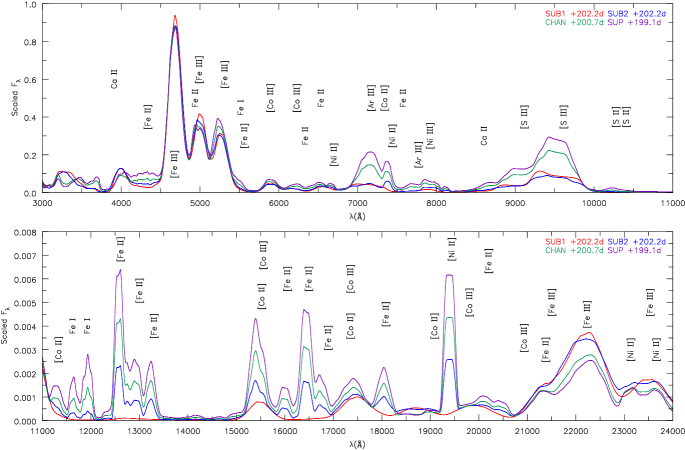
Fig. 9 shows the early spectral evolution (, , and 0 days relative to bolometric maximum) plotted in (arbitrary units). We label the contributions of important species at bolometric maximum. Figs. 10 and 11 show the post maximum photospheric phase (, , , ) plotted in (arbitrary units). Figs. 12 and 13 show nebular spectra at and days post bolometric maximum plotted in (arbitrary units). Contributions from important species are labelled. Notice the transition towards predominantly forbidden lines in nebular spectra. These figures are used to highlight important diagnostics.
4.1 [Ni ii] 1.939 m
In SNe Ia, the nickel abundance is sensitive to the progenitor mass and/or explosion scenario. In 1D explosion modeling, higher central densities have higher neutronisation that leads to more stable being produced during nuclear burning (Nomoto, 1984; Khokhlov, 1991a, b). This 1D modeling implies that sub- SNe Ia will show a lower abundance of compared to SNe Ia (for the same mass). However, 3D DDT modeling suggests that the hole predicted in 1D WD DDT models may be absent, and both and extend from the lowest velocities to about 10 000 km s-1(Kasen et al., 2009; Seitenzahl et al., 2013). settling in sub- has also been proposed as a way to enhance the neutronisation; however, the time-scale for gravitational settling can be yrs (Bildsten & Hall, 2001). Therefore, nickel diagnostics, particularly at nebular times, may constrain the progenitor scenario, nucleosynthesis, and explosion mechanism (Woosley, 1997; Iwamoto et al., 1999; Stehle et al., 2005; Mazzali & Podsiadlowski, 2006; Gerardy et al., 2007; Maeda et al., 2010; Mazzali et al., 2011; Mazzali & Hachinger, 2012; Mazzali et al., 2015). At nebular times most of the will have decayed, and any nickel emission features are due to stable nickel, and in particular and , which are expected to be underabundant in (1D) sub- DDT models compared with models. The width of any observed nebular nickel feature will constrain the hydrodynamic width of the emitting region, thus testing model predictions about the presence of a hole. Therefore, nickel features may offer the best diagnostic for ejecta masses below if ejecta do or do not have holes as predicted by 1D modeling.
In the optical nebular spectra at and days (Figs. 12 and 13), the [Ni ii] 7378,7412 lines are blended, and hence not very useful for abundance determinations. However, in the NIR there is a forbidden [Ni ii] transition (3d8(3F)4s2 F3d8(3F)4s4 F9/2) at 1.939 m which in our synthetic spectra is relatively blend-free. It overlaps with telluric lines in low-redshift SNe, but higher redshift () SNe avoid telluric absorption. While observations of this line appear to be rare, Friesen et al. (2014) find evidence for this line in spectra of SN2011fe, SN2014J, and SN2003du.
In our models, SUB1 shows no evidence of [Ni ii] 1.939 m. On the other hand, SUB2, CHAN, and SUP show the line, with a strength that correlates with ejecta mass. The absence of [Ni ii] 1.939 m in SUB1 arises from two effects — SUB1 has a smaller amount of stable nickel (see Table 1) and a higher ionization than the other models. The presence of under 3000 km s-1 in SUB1 means that there is a great amount of heating from positrons, which deposit their energy locally (Fig. 8). This, combined with the lower densities, leads to both a higher temperature, and a higher ionization (Figs. 6 and 7). Surprisingly, and despite their similar ionization potentials, Fe ii cannot be used as an ionization tracer for Ni ii. In SUB1 Ni iii/Ni ii is significantly larger than Fe iii/Fe ii. This arises because the photoionization of Ni ii is dominated by large resonances in its photoionization cross-section. Therefore, the absence of [Ni ii] 1.939 m in SN Ia spectra at 100–200 days indicates that the mass of the progenitor is below . However, we re-emphasize that SUB2 is a scaled model, so it is not a true sub- model. SUB2 has a stable nickel core and shows [Ni ii] 1.939 m.
4.2 Ionization
Once the mass is determined via “Arnett’s rule”, which states that the luminosity at bolometric maximum is equal to the decay chain luminosity, or using LC fitting like that of Scalzo et al. (2014a, b), one can separate different SNe Ia based on ejecta mass using differences in ionization/temperature (see Fig. 6). This result follows from the heating per gram available to the gas. The greater the ejecta mass is, the lower the heating rate per gram is. Consequently, ejecta with a larger are hotter – see Blondin et al. (2017) for . Indeed our models indicate that low mass WD models, for a given mass, maintain higher ionizations throughout their spectral evolution.
4.2.1 UV-Blanketing
Previous studies focused on the UV variability and used the UV spectral region for understanding SNe Ia. These studies looked at the role of metallicity on UV blanketing (Lentz et al., 2000; Walker et al., 2012; Wang et al., 2012; Foley & Kirshner, 2013) finding that lower metallicities shift the blanketing blueward. Foley et al. (2016) looked at a sample of SNe Ia and found the UV diversity linearly correlates with the optical LC shape. In particular, the strength of UV line flux measurements (2030 & 2535 Å) increases with increasing . Other studies of UV variation hope to use it as a cosmological utility (Ellis et al., 2008; Sullivan et al., 2009) to improve standardizability. Therefore, understanding how for a given mass influences the UV spectrum is important to the astronomical community.
Until the ejecta begins entering its nebular phase (100 days), we see larger UV blanketing shortward of 4000 Å for larger mass ejecta. This effect is attributed to a temperature difference between models. We see in Figs. 6 and 7 that below 25 000 km s-1models with higher temperatures have higher ionizations, seen as a shift in the line blanketing to higher frequencies. Pre-maximum spectra show the Ca ii feature (H & K lines near 3500) is affected by UV blanketing, making it difficult to distinguish in SUP and CHAN (Fig. 9). Ti ii contributes to much of the blanketing more than 5 days before maximum, while Ti ii, Fe ii, and Fe iii shape the UV spectra just prior to maximum. Around maximum, Co ii contributes much of the UV blanketing (below 3500 Å) with the strongest blanketing occurring in model SUP. Looking inwards of 25 000 km s-1, SUB1 and SUB2 show a higher ionization of cobalt than that of models SUP and CHAN. For Co ii there is about a half dex difference in ionization between SUB1 and SUP. These Co ii differences show up as absorption affecting the slope of the feature at Å. Post-maximum (Figs. 10 and 11), there is less variation in UV blanketing between the models.
If we compare the peak fluxes at bolometric maximum (Fig. 9) of three UV features (namely the features near 2850 Å, 3150 Å, and 3550 Å), we can characterize the level of blanketing by comparing the flux at peak in each feature. For all ejecta models, the flux ratio is close to unity (0.93, 1.07, 1.03, and 1.11 for SUB1, SUB2, CHAN, and SUP). However, comparing these lines to the feature just short of the Ca ii H&K and Si ii 3660 Å absorption profile, we see that the flux ratio is strongly dependent on ejecta mass. This flux ratio is 0.99, 1.01, 1.20, and 1.75 for SUB1, SUB2, CHAN, and SUP. These UV features reflect the temperature and ionization of the ejecta and offer a diagnostic of ejecta mass for a given mass.
4.2.2 Optical and IR
Besides variations in UV blanketing, other ionization diagnostics are seen in optical and infrared spectra. For instance, leading up to maximum (Fig. 9), each model shows a different strength of the Si iii triplet (4553,4568,4575) absorption, which is strongest in the models SUB1 and SUB2. SNe Ia typically classified as normal, such as SN2011fe, show the Si iii feature around 4400 Å (Pereira et al., 2013) as our model CHAN does. SNe Ia such as SN2003hv, thought to be a sub- event (Mazzali et al., 2011), show this absorption feature much more strongly (Leloudas et al., 2009), as in our SUB models.
Post maximum (Fig. 11), the near-infrared part of the spectrum begins to show prominent permitted Fe ii (9997.58, 10501.50, 10862.64, 16787.18, and 16873.20 Å) and Co ii features (11829.72, 15758.43, 16064.48, 16360.46, 16687.30, 21344.70, 21503.28, 22202.92, 22475.63, and 23612.53 Å), as well as forbidden [Fe iii] (22178.21, 22420.43, and 23478.80 Å) and [Co iii] (12724.19, 15483.56, 17408.66, 19575.24, 20022.57, and 20973.15 Å) lines. Many of the Co ii and Fe ii features are absent in SUB1, a result of the higher ionization.
Optical nebular spectra typically exhibit emission lines of Fe iii and Co iii (Figs. 12 and 13). In the NIR S2+ and Ar2+ show up in our model spectra as [S iii] 9068,9530, and [Ar iii] 7135,7751, with the strength of these features relative to [Fe iii] 4658 correlating with higher ejecta mass. As will be discussed in Section 6.3, our model spectra tend to exhibit too high an ionization, especially after 40 days. In particular, they lack strong [Fe ii] (e.g., [Fe ii] 4350 Å). However [Fe ii] and [Co ii] features are readily identified in the IR, except for model SUB1. Since SUB1 comes from the explosion of a sub- WD, its inner density is lower throughout its evolution compared to SUB2, and this hinders recombination. Further, SUB1 lacks the ‘ hole’ seen in the later models, and hence the temperature in the inner region is higher than in the other models (see Figs. 6, 7, and 8).
4.3 C/O and IMEs
As the mass of C/O and IMEs is strongly correlated (by design from the density scalings) with the ejecta mass for a given mass (see Table 1), one should expect that lines from C/O and IMEs will provide a useful diagnostic tool for ejecta mass. As to be expected, our models show stronger absorption features for oxygen and IMEs for increasing ejecta mass. For example, the strength of absorption due to the O i 7772,7774,7775 triplet absorption correlates with ejecta mass in pre-maximum spectrum (Fig. 9). The feature fades by a few weeks post bolometric maximum. Mg ii 9218,9244 is another feature whose strength correlates with high ejecta mass–see Table 3 which lists the pseudo-equivalent widths (pEWs) measured by a straight line across the maxima of the absorption profile; it also fades within a few weeks post bolometric maximum.
Si ii 5958,5979, observed roughly around 5750, is a spectroscopic classification diagnostic for SNe Ia ((Si) pEW(Si ii 5750)/pEW(Si ii 6100)) and, like other IME features, its strength correlates with ejecta mass. Table 3 highlights the correlation of pEWs of various features with ejecta mass of our models. Post maximum (Figs. 10 and 11), we see the strength of the emission increase, giving a large morphological separation between models. Calcium (as Ca ii) also shows the same behaviour as Si ii. The absorption and emission strength of the Ca ii NIR triplet distinguishes models throughout the spectral evolution. We find that the strength of this feature correlates with ejecta mass. We further discuss the Ca ii NIR triplet and the Si ii 6347,6371 doublet in Section 6.1.
5 Explosion Scenario: SUB1 versus SUB2
Since the explosion process and progenitor system are unknown, we highlight and summarize useful diagnostics for distinguishing our models of the same . As mentioned earlier, SUB1 comes from a detonation model of a sub- WD, while SUB2 comes from the DDT of a WD, which was scaled in density to have the same mass as SUB1 and the same mass. Since SUB1 was detonated as a sub- WD, it had lower densities when exploded compared to SUB2 and lacks the ‘ hole’. Without the ‘ hole’, SUB1 has a larger (assumed) local deposition fraction from decay positrons compared to the total decay energy deposition (Fig. 8) for velocities less than 5000 km s-1. This keeps the inner region of SUB1 hotter than SUB2, which shows stronger features of higher ionization states of IGEs as the ejecta evolves past the photospheric phase and exposes the inner iron-rich material. At nebular times, the strength of [Ni ii] 1.939 m gives a clear distinction between SUB1 and SUB2, as lower density ejecta model SUB1 does not show this feature.
Up to maximum light, SUB1 and SUB2 possess very similar spectra (Fig. 9), especially in the optical. However, as the photosphere begins to recede inwards differences are seen in the NIR – Fe ii and Co ii features are absent in SUB1 but present in SUB2 (Figs. 10 and 11). Below 5000 km s-1, the densities in SUB1 are roughly a factor of 3 lower than in SUB2. Further, SUB1 has a larger fraction of local radioactive heating from positrons. These factors inhibit recombination and a higher ionization persists in SUB1 compared to SUB2. The NIR region is potentially the best diagnostic for the ionization state of the ejecta in SNe Ia (shown in Figs. 12 and 13).
6 Additional Investigations
In this section we present additional investigations of our ejecta models focusing on high velocity features and comparisons to observational data. We also explore shortcomings with our ejecta models.
6.1 High Velocity Features – Si ii & Ca ii
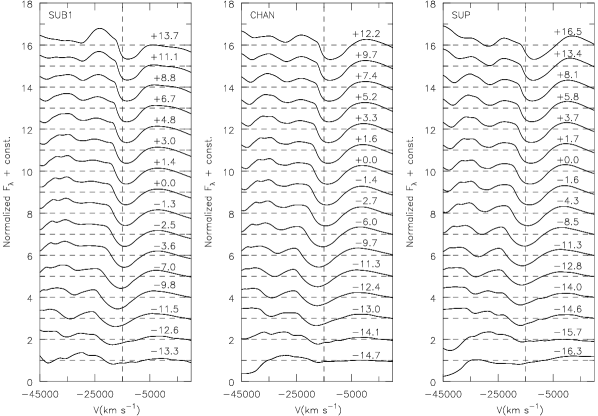
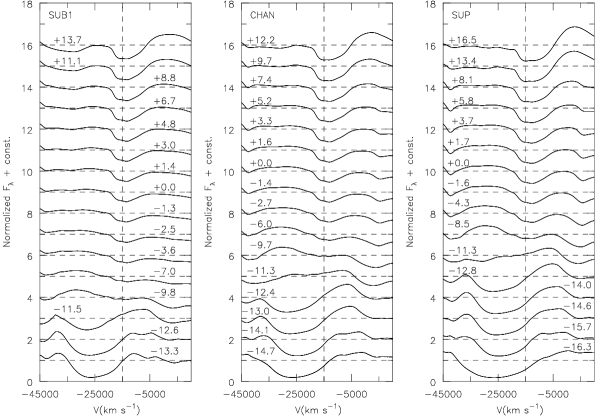
High velocity features (HVFs) are absorption features, seen in the strongest lines, that show a distinct difference in velocity (often early and prior to maximum), by more than a few thousand km s-1 from the lower velocity, photospheric component (Gerardy et al., 2004; Mazzali et al., 2005a, b). Note the two strongest components of the Ca ii NIR triplet (8542 & 8662) are separated by 4000 km s-1. Thus, any single Ca ii NIR profile may show an absorption feature with two components separated by a few thousand km s-1 which is different from a HVF. In many SNe Ia, HVFs have even been observed at maximum for the Ca ii NIR triplet but not for Si ii 6347,6371 (Childress et al., 2014). There is no clear indication when HVFs start to disappear in all observed cases. Silverman et al. (2015) state that the HVF Ca ii triplet begins to disappear around days prior to maximum for to 1.6 mag, however discoveries of HVFs are potentially biased towards those that persist closer to maximum light.
Shown in Figs. 14 and 15 is the evolution of the Si ii doublet and the Ca ii NIR triplet, with a vertical line at km s-1 as a reference. In all models, Ca ii HVFs are seen before bolometric maximum ( days). However, no HVF for Si ii 6347,6371 is seen. Notice the striking difference in the pre-maximum Ca ii triplet profile ( days) and the profile at later dates. The lack of a Si ii doublet HVF could just be a byproduct of atomic physics. Although both the Ca ii NIR triplet and the Si ii doublet are not resonance transitions, the lower level of the Ca ii triplet is metastable. The lower level of the Si ii 6355 doublet is the 4s state which is coupled to the ground state by a permitted transition. Therefore, when compared to the Si ii 6355 doublet, the Ca ii NIR triplet persists longer because the metastable lower level population persists longer.
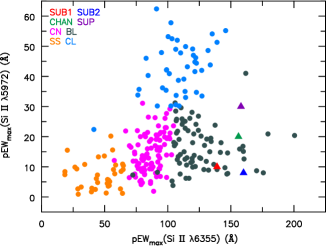
By defining a straight line between the maxima on either side of the absorption profiles of these Si ii features, we are able to compute our models’ pEWs (listed in Table 3). Comparing our work to fig. 8 of Blondin et al. (2012), we find our spectra are clustered around those labelled broad-lined Ia as seen in Fig. 16. Branch et al. (2006) looked at the pEWs of Si ii features near and in these spectra at maximum in order to group these spectra in different classifications: “core-normal”, “broad-line”, “shallow-silicon”, and “cool”. For the most massive model (SUP), it might fall under the “cool” classification from Branch et al. (2006), but it lacks the strong Ti ii absorption.
| Model | Si ii 5750 | Si ii 6100 | O i 7400 | Mg ii 8700 |
|---|---|---|---|---|
| SUB1 | 10 | 139 | 17 | 1 |
| SUB2 | 8 | 160 | 9 | 1 |
| CHAN | 20 | 156 | 32 | 32 |
| SUP | 30 | 158 | 50 | 53 |
6.2 Comparison to Data
Here we present both light curve and spectral comparisons to data for a span of spectral epochs. We focus on SNe Ia that have claimed masses similar to that of our models (0.6 M⊙) or similar and those tagged as sub- (SN2005el), (SN1995D), and similar Branch types (SN2001ay). We used the supernova identification program SNID (Blondin & Tonry, 2007) on models at bolometric maximum to find additional SNe Ia to compare (SN1994ae). The spectra are taken from the CfA Supernova Archive (Blondin et al., 2012). Archived light curve photometry is taken from Open Supernova Catalog (Guillochon et al., 2017). When comparing models to observations, the spectra are normalized between =4000 Å and =7000 Å, such that
| (1) |
Normalizing spectra allows us to better compare spectral features, removes uncertainties in distance, and compensates for small differences in mass. To compare LCs, we correct for extinction using the CCM reddening law (Cardelli et al., 1989) and literature and values. We normalize the LCs by adding a constant offset (model and object dependent), such that = 0 mag at . We also shift the LCs so that time of -band maxima agree. Thus, uncertainties in distance and explosion time are reduced. A constant value of 0.05 mag is included with the photometric error bars for uncertainty in reddening. -corrections, expected to be small, have not been applied. Photometric band magnitudes and bolometric luminosities of the models at maximum are provided in Table 2.
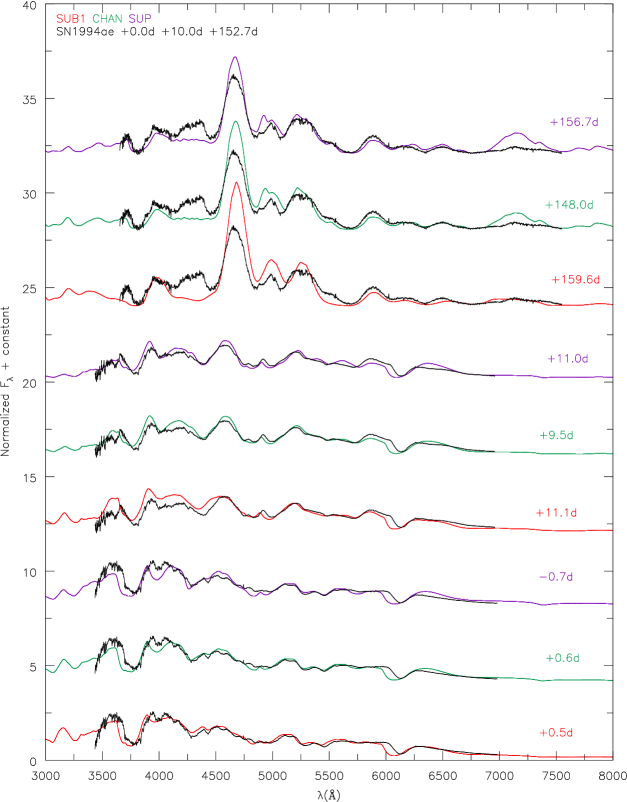
6.2.1 SN1994ae
SN1994ae exploded in NGC 3370 ( – Riess et al., 1999; Jha et al., 2007) and was first discovered on 14 November 1994 by van Dyk et al. (1994). It reached -band maximum ( mag) on MJD 49685.5 with =0.96 mag (Riess et al., 1999; Jha et al., 2007). For comparison, we reddened our models using mag and (Jha et al., 2007). Fig. 17 shows the spectral comparison of SN1994ae at , , and days after -band maximum and normalized LCs relative to band maximum are shown in Fig. 18.
At days, our model spectra do not reproduce the velocity of the Si ii 6355 doublet and UV Si ii triplet. Results by Dessart et al. (2014a) suggest SNe Ia resulting from pulsational-delayed detonations (PDD) retain more unburnt carbon and have little mass at high velocity (15 000 km s-1) due to pulsations. Therefore, spectral features of SN1994ae might be best explained by PDD modeling, and would resemble similar radiative properties of DDT models. The spectra also show evidence of the Si iii triplet (4553,4568,4575) absorption as in our SUB models (an indication of high ionization). Later spectra show cooler ejecta and model SUP is closest to reproducing the features. However, at nebular times (+152.7 d) our model optical [Fe iii] lines appear too strong and [S iii] 9068,9530 are absent in the observational data.
For the light curve comparison, we shifted the LCs to give the same time of and reddened the models with = 0.091, = 0.070, = 0.057, and = 0.041 mag, obtained using mag and from Jha et al. (2007). We normalized the light curves to 0 mag at and shifted the observational data by 12.98 mag. We see in Fig. 18 that our -band LC is consistent until 20 days post maximum, where our LCs begin showing roughly half a magnitude more flux. Model CHAN matches well the -band observations. However, our models fail to reproduce the second peak in the -band, and the disagreement is greater in lower mass models.

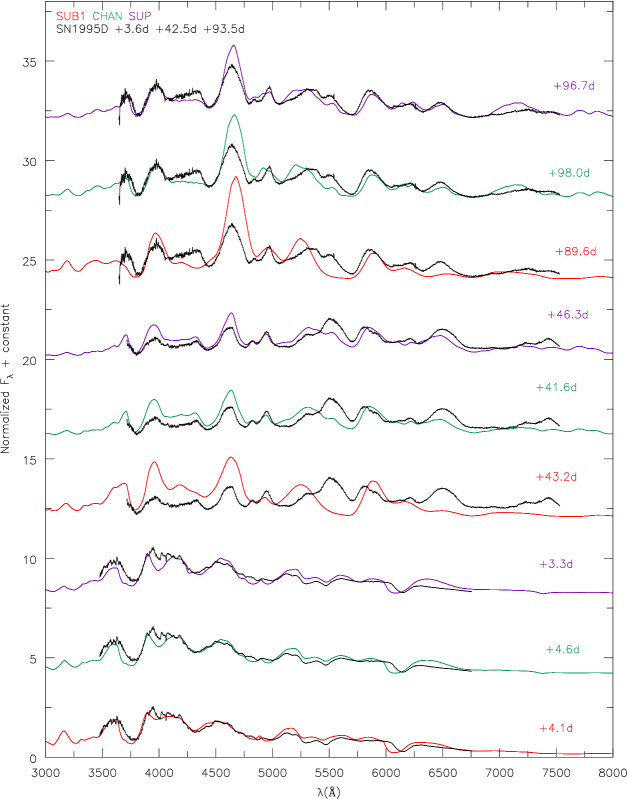
6.2.2 SN1995D
SN1995D exploded in NGC 2962 and was discovered on 10 February 1995 (Nakano et al., 1995). Its redshift is , and it reached -band maximum (=13.44 mag) on MJD 49768.7 (Riess et al., 1999; Jha et al., 2007). SN1995D has been argued as having a mass of about 0.58 M⊙ and an ejecta mass around 1.45 M⊙ (Childress et al., 2015). For comparison, we reddened our models using mag and (Jha et al., 2007).
Fig. 19 shows the spectral comparison of SN1995D at , , and days after -band maximum. The early epochs ( days) show good qualitative agreement with SUB1 except our model shows a larger blueshifted Si ii doublet. This may be best explained by a PDD model (Dessart et al., 2014a). SUB1 also matches the UV spectrum shortward of 4000 Å. At later epochs like and days, we see a better agreement to model SUP and to CHAN, due to lower temperatures and ionization. Roughly all features at days are matched by SUP. Despite the calculated and ejecta mass being closest to CHAN, SN1995D shows only moderate qualitative agreement at later epochs. SN1995D transitions from looking like our SUB1 into that of SUP from early to late epochs.
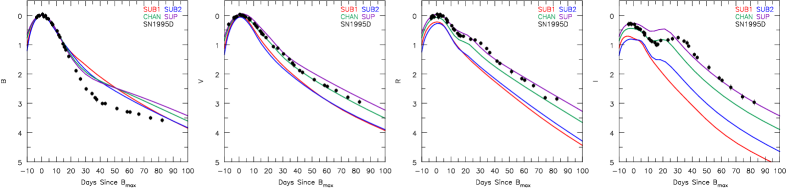
To compare light curves, we shifted the LCs to give the same time of and reddened the models with = 0.106, = 0.081, = 0.066, and = 0.048 mag, obtained using mag and (Jha et al., 2007). We normalized the light curves to 0 mag at and shift the observational data by 13.35 mag.
In Fig. 20, we see that our -band LC is consistent with all models until 12 days post maximum, where our LCs then begin showing roughly half a magnitude more flux. Model CHAN matches well the -band observations. Our models fail to reproduce the second peak in the -band (it occurs 10 to 20 days too early) although the SUP model matches the data at late times. Model SUP also seems consistent with the peak flux ratios in SN1995D.
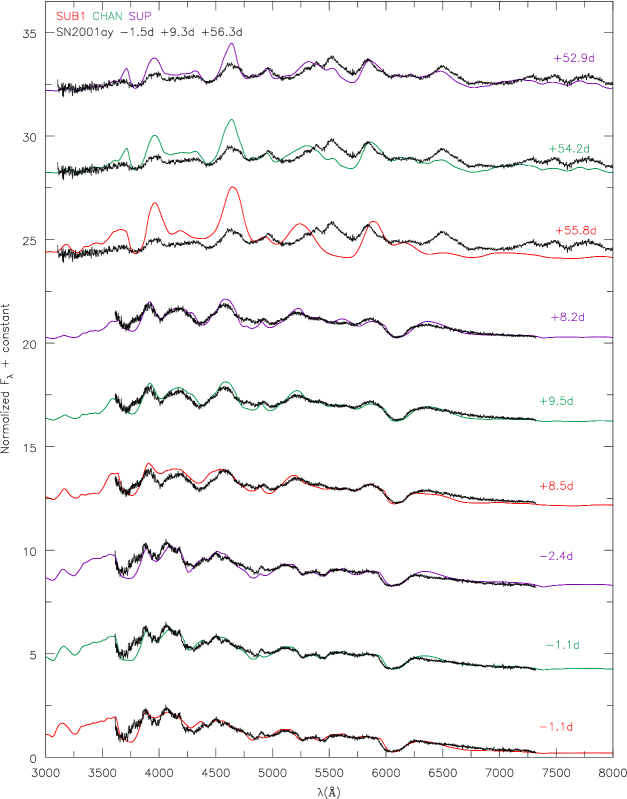
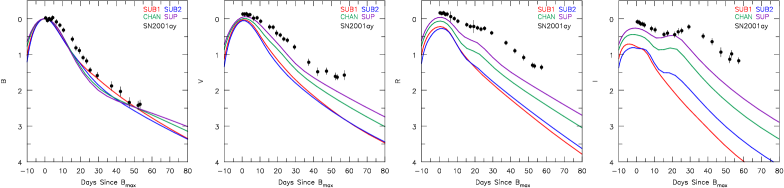
6.2.3 SN2001ay
SN2001ay exploded outside IC 4423 and was discovered on 18 April 2001 by Swift et al. (2001). Krisciunas et al. (2011) and references therein cite its redshift as and indicate that it reached -band maximum ( mag) on 23 April 2001. For spectral comparison, we reddened our model spectra using = 0.026 mag, = 0.072 mag, and = 3.1 (Krisciunas et al., 2011). Krisciunas et al. (2011) states a of (0.580.15)/ M⊙, for an , typically between 1–1.2. Given the close proximity between the estimated mass for SN2001ay and that of our model set, we explore the spectral similarities.
Fig. 21 shows the spectral comparison for epochs , , and days relative to -band maximum. All models provide a good qualitative fit to the optical spectrum at days, with SUP exhibiting the worst fit. While all models fit the Si ii 6347,6371 doublet in absorption strength and velocity, our models show stronger absorption in the Si ii 5041,5056,5056.3 triplet around 4800 Å. Blended with this feature is absorption arising from Fe ii 5018, and this is also somewhat too strong in the models. The biggest discrepancy between model and observation for the blend occurs for model SUP. SUB1 lacks absorption at 4000 Å, which is clearly present in the observations, and all of the other models. No model reproduces the shape of the UV absorption near 3700 Å, which could be due to a discrepancy with the Ca ii H&K lines.
Later, model SUP qualitatively agrees the SN2001ay spectra at and days best. At days, SUP shows agreement despite its stronger Fe ii absorption lines around 4800 Å. At days, the spectra is dominated by Fe ii features, which SUP matches well given its cooler temperatures and lower ionization. Models SUB1, SUB2, and CHAN are too highly ionized, and exhibit too much emission from higher ionization states such as Fe iii. Despite matching much of the optical spectrum, SUP does not match well the absorption features associated with the Ca ii NIR triplet and the Ca ii H&K lines. Given the discrepancy with calcium at days, this may indicate that the calcium abundance is too high, or that the distribution in velocity space is incorrect.
For the light curve comparison, we reddened the models with = 0.397, = 0.307, = 0.148, and = 0.178 mag, by combining host and MW values as =0.098 mag and =3.1 (Krisciunas et al., 2011). We normalize the light curves to 0 mag at and shift the observed data by 16.35 mag. Fig. 22 shows our models fail to reproduce the post maximum decline except for -bands. Our models show too little flux in the decline post maximum, but SUP agrees in peak flux ratios between bands with SN2001ay.
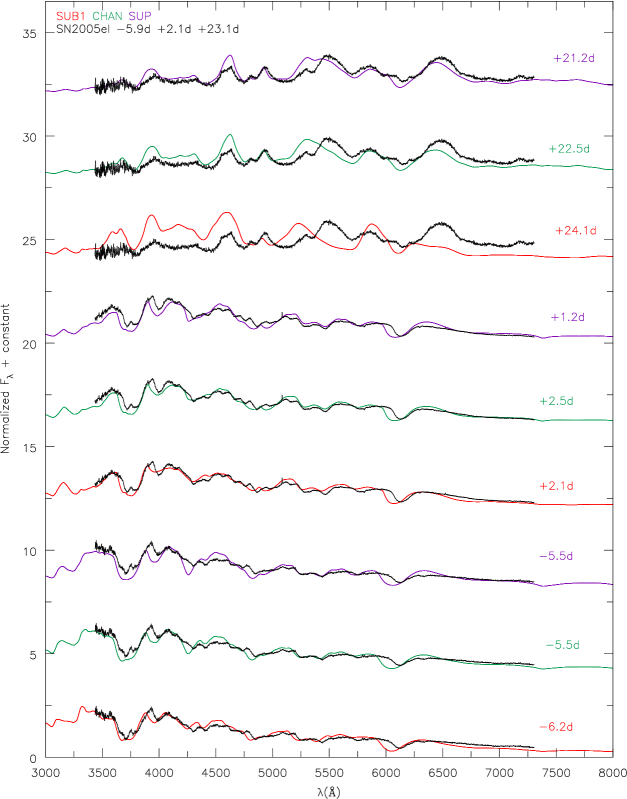
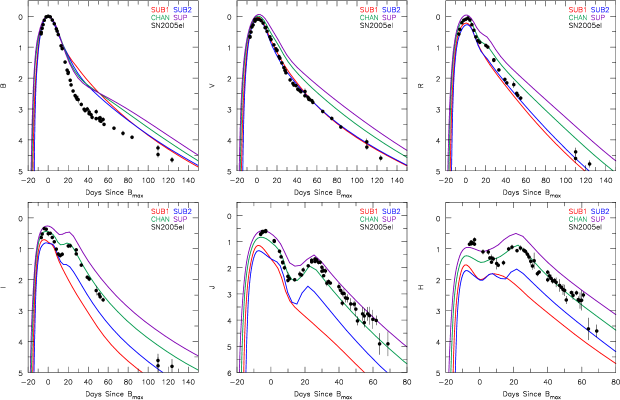
6.2.4 SN2005el
SN2005el exploded in NGC 1819 and was discovered on 19 September 2005 (Madison et al., 2005) at a redshift of (Hicken et al., 2009). It reached -band maximum ( mag) on MJD 53646.4 (Hicken et al., 2009). Scalzo et al. (2014a) classified SN2005el as having 0.9 M⊙ of ejecta as well as 0.54 M⊙ of , which, considering the errors in the determinations, are close to our models SUB1 and SUB2. For comparison, we applied reddening to our models using mag and (an value that is higher than that stated in Scalzo et al. (2014a)).
Fig. 23 shows our spectral comparison to SN2005el. The early epochs of and days show some qualitative agreement, mostly with SUB1 and SUB2. At this epoch, our models do not reproduce the Si ii 6347,6371 doublet. Our models indicate a Si ii 6347,6371 doublet formed at higher velocities. Therefore, spectral features of SN2005el may be best explained by a PDD model. Unlike the Si ii doublet, models CHAN and SUP do reproduce the S ii ‘w’ feature. Since our models show a higher blue-shifted Si ii doublet, it is not surprising that our UV does not match, given other Si ii and Ca ii H&K features in this region. If the Ca ii H&K lines and Si ii 3854,3856,3862 triplet are separated by thousands of km s-1, then it is likely to result in the spike seen at the bottom of the 3700 Å absorption feature, whereas our models show one broad absorption feature around 3700 Å – seen in SN2008ec, for example). Given the strong absorption profile around 4400 Å, we suggest this is the Si iii 4553,4568,4575 triplet, indicating a high ionization at this epoch.
At days, we see that model SUP agrees qualitatively in almost all features. Other models are too blue compared to the cooler SUP model. This is surprising given the claim that SN2005el is a sub- SN with an ejecta mass of only 0.9 M⊙. The discrepancy around 5300 Å could be the result of differences in the Fe ii or Cr ii absorption.
One should expect SUB1 or SUB2 to resemble the spectral evolution of SN2005el; however, we only see that SUB1 matches prior to maximum and does not match SN2005el at late epochs, where SUP shows best agreement. There are several possible explanations for the inconsistencies. First, the mass may be lower than 0.54 M⊙. Second, the poor agreement in the extent of the Si ii 6347,6371 doublet could indicate a different explosion scenario (such as PDD mentioned earlier – little mass at high velocity).
To compare light curves, we shifted the LCs relative to the time of and reddened the models with = 0.543, = 0.414, = 0.339, = 0.245, = 0.122, and = 0.077 mag, obtained using mag and slightly higher than Scalzo et al. (2014a). The light curves were normalized to 0 mag at and we adjust the observational data by 14.76 mag. In Fig. 24, we see the optical bands are reproduced well with our SUB models (except beyond 20 days). Although the late time behaviour in the -band is reproduced, the NIR LCs do not generally agree with the SUB models. The double peak structure in the -band observations is well produced by the models, although in the -band it less evident.
6.3 Model Setbacks and Theoretical Problems
When compared to observation data, our models do show a higher ionization, especially in the nebular phase. The strength of the [Fe iii] 4658 feature is too strong compared to other optical/NIR features. Further, optical spectra lack emission such as [Fe ii] 4350 emission, seen in nebular spectra of SNe Ia of Taubenberger et al. (2013) and Black et al. (2016), for example. Other researchers have also had difficulty modeling the Fe ii feature near 4350 Å (Spyromillo 2016, private communication; Sim 2016, private communication; Mazzali et al., 2015; Friesen et al., 2017). It is not surprising that these models struggle to get the ionization correct – there are no free parameters and the density structure and element distribution is set by the adopted initial model.
At late times the super- model was generally in better agreement with observation – a result of the model being cooler with lower ionization. Since we know that most of the observed SNe we discussed are not super-, there is a fundamental problem with the models. This problem might arise from the adopted explosion models, be related to assumptions about mixing and clumping, and/or be a problem in the ionization calculations. Since nebular spectra show strong [Fe ii] and [Fe iii], the Fe+/Fe2+ ratio must be of order unity, and consequently it is sensitive to the Fe atomic models (and the density structure).
The disconnect between early and late time modeling is not unexpected. Early time spectra are dependent on the outer ejecta whereas late time spectra are primarily dependent on the inner ejecta. Further, the processes determining the observed spectra in the photospheric and nebular phases are distinct, and subject to different uncertainties in the atomic data.
Another problem is the strong nebular [S iii] 9068,9530 and [Ar iii] 7135,7751 lines. The [S iii] 9068,9530 does not seem to appear in nebular spectra. However, it is not clear if [Ar iii] 7135 is present. There are three additional transitions contributing to that overall feature between 7000-7500 Å. There are two [Fe ii] 7155,7172 lines that overlap [Ar iii] 7135 and, depending on the ionization structure of the ejecta, it becomes difficult to determine the source of the feature in observations. However, atomic physics of the [Ar iii] 7135,7751 lines requires that the line ratio, , should be a factor of 4.2, so if spectral detections of [Ar iii] 7751 are possible, then one can determine the strength of the blended [Ar iii] 7135 line. However, observed SN Ia nebular spectra appear absent of IME lines. This could be due to an absence of in the IME zone. In our models, the presence of some in the IME zone means that positrons are available as a heating source after the ejecta has become optically thin to -ray photons. One would expect some level of mixing to occur through Rayleigh-Taylor instabilities between these layers – see Hicks (2015) and references therein. To address the problem of too high an ionization, clumping, arising from radiation hydrodynamic instabilities, should be considered in future studies. Our preliminary work shows that, as expected, clumping lowers the ionization, and we will address this issue in a future paper.
Another possible explanation concerns the validity of the explosion models. We have considered only four models, and only two of the explosion models were obtained from “first principles”, and even these were derived from 1D explosions. Alternative explosion mechanisms might give rise to different density and abundance profiles, and in particular, the spatial distribution of . The later will influence the amount of UV line blanketing, potentially introducing degeneracies with the ejecta mass. However, other diagnostics (e.g. the NIR nickel line) provide additional information, and can break the degeneracies. Further, despite the deficiencies, the models have highlighted important diagnostics and questions that can help facilitate future progress towards understanding Type Ia SNe.
7 Conclusion
We have presented four 1D SN Ia models – three delayed detonation models with masses of 1.02, 1.40, and 1.70 M⊙ and one detonation sub- model with a mass of 1.04 M⊙. By design, the models have the same mass of 0.62 M⊙ which allows us to investigate the dependence of light curves and spectra on ejecta mass. Despite the smallness of the model grid they serve to highlight important diagnostics that can help facilitate future progress towards understanding Type Ia SNe.
Our results show that despite large differences in ejecta mass, the optical flux throughout the photospheric phase shows less than 0.3 mag difference in peak brightness in the LCs, as well as nearly identical spectral features. We have seen that the peak bolometric luminosity of each model is similar to within about 15 per cent, and the difference in rise time is less than 20 per cent. Due to differences in diffusion time, however, the two sub- mass models do evolve faster (pre-maximum) by a day as seen from the bolometric luminosity and synthetic -band LCs. There is only a slight difference (5 per cent) in the decline parameter, , between sub- and super- models. Our sub- models have much bluer colours at all epochs compared with SUP ( difference of mag at maximum and a difference in 1 mag roughly 20 days post maximum). Our models show larger differences in NIR light curves, particularly with the -band’s 1 mag difference at maximum light between sub- and super-.
Spectroscopically, at most photospheric phases, the optical spectra show the same gross features. However, the strength of UV blanketing between 2000-4000 Å is found to correlate with ejecta mass. Lower mass models have higher temperature and ionization (as more heating per gram), and hence lower UV blanketing between 2000-4000 Å. is the leading parameter controlling this study. Higher mass models produce stronger IME features, such as the Ca ii NIR triplet and the Si ii 6347,6371 doublet prior to the nebular phase, and stronger [S ii] 9530,9068, [Ca ii] 7291,7324, and [Ar iii] 7135 in the nebular phase. Lower mass models have higher ionization, as indicated by the presence of the Si iii 4553,4568,4575 triplet near maximum and the lack of strong Fe ii and Co ii lines in the optical post-photospheric/nebular phase. Model SUB1, unlike SUB2, is dominated by strong [Fe iii] and [Co iii] lines, such as [Fe iii] 4658, [Fe iii] 5270, [Co iii] 5888, and [Co iii] 1.5484 m.
In the nebular phase, the [Ni ii] 1.939 m line is absent in our sub- detonation model, but readily visible in the three other models. Potentially, the [Ni ii] 1.939 m line provides us with a diagnostic of the amount of stable nickel ( & ), unlike the blended optical [Ni ii] 7378,7412 lines. Its absence in NIR spectra would provide strong evidence for a lack of a ‘ hole’ and potentially sub-Chandrasekhar mass ejecta (given 1D modeling). However, complex ionization issues can influence the strength of all [Ni ii] lines, making absolute determinations of the abundance model-dependent. Overall the NIR provides the best diagnostics for distinguishing between our different SN Ia progenitor models.
In comparing our spectra to observation at times greater than 20 days post maximum, we consistently find better qualitative fits with our cooler, high mass super- model. Given that there is a 20-70 per cent difference in claimed ejecta mass between our compared observational objects and our super- model, we suggest clumping as a way to lower the high ionization and high temperatures observed in our models. While it is difficult to reproduce all observational features due to the diversity of SNe Ia, we are able to match some features shown in our comparison to observations. Prior to maximum, the best choice of model varies. Agreement depends on the velocity structure of the ejecta. For instance, the photospheric features Si ii 6347,6371 and the Ca ii NIR triplet expose the difficulty of reproducing the velocity structure of SN Ia (Figs. 21 and 23, for example). Future efforts to reproduce the diversity of these features requires a better understanding of the outer ejecta and explosion mechanism.
Parallel work has been undertaken by Blondin et al. (submitted to MNRAS) who studied SN 1999by using a low mass model (0.9 M⊙) and a model with a Chandrasekhar mass (both with 0.12 M⊙of ). They find that the lower mass model provides a better match to the light curve, and exhibits a faster rise and a brighter maximum. As in our study, the lower mass model does not show the [Ni ii] 1.939 m line, which is seen in their Chandrasekhar model
To determine more accurate diagnostic signatures of SN Ia progenitors we need to understand clumping and inhomogeneities in Ia ejecta. Some insights can be obtained from multi-dimensional explosion modeling, while additional insight might be obtained from studies of young SN remnants that are not interacting with the surrounding ISM. During the photospheric phase, more UV spectral data will help to constrain the ionization and temperature of the gas. More NIR spectral data will help to test our diagnostics, such as the NIR Ca ii triplet (or nebular [Ca ii] 7291,7324), the nebular features between 9000 Å-1 m (such as [S iii] 9068,9530), and the [Ni ii] 1.939 m line (requiring SNe Ia at a high enough redshift to avoid the telluric absorption). These nebular features can provide leverage on the progenitor channel by constraining initial densities ([Ni ii]), the overlap between IMEs and IGEs ([Ca ii]), and the ionization structure.
As many more SN spectra become available it will be possible to do systematic statistical comparisons between SNe which have a similar initial mass. As discussed above, our studies show that Type Ia SN will exhibit systematic differences in spectra and multi-band LCs as a function of ejecta mass, thus providing fundamental constraints on the nature of the progenitors.
acknowledgements
We thank Stéphane Blondin for providing feedback for this work as well as everyone at the “Supernovae Through the Ages: Understanding the Past to Prepare for the Future” conference who presented work and talked with us about our research. We also thank the referee for providing very detailed and useful comments and questions. This research has made use of the CfA Supernova Archive, which is funded in part by the National Science Foundation through grant AST 0907903. DJH acknowledges partial support from STScI theory grant HST-AR-12640.01, and DJH and KDW thank NASA for partial support through theory grant NNX14AB41G.
References
- Arnett (1969) Arnett W. D., 1969, APSS, 5, 180
- Bildsten & Hall (2001) Bildsten L., Hall D. M., 2001, ApJL, 549, L219
- Black et al. (2016) Black C. S., Fesen R. A., Parrent J. T., 2016, Monthly Notices of the Royal Astronomical Society, 462, 649
- Blondin & Tonry (2007) Blondin S., Tonry J. L., 2007, ApJ, 666, 1024
- Blondin et al. (2012) Blondin S., et al., 2012, AJ, 143, 126
- Blondin et al. (2013) Blondin S., Dessart L., Hillier D. J., Khokhlov A. M., 2013, MNRAS, 429, 2127
- Blondin et al. (2017) Blondin S., Dessart L., Hillier D. J., Khokhlov A. M., 2017, preprint, (arXiv:1706.01901)
- Branch et al. (2006) Branch D., et al., 2006, PASP, 118, 560
- Cardelli et al. (1989) Cardelli J. A., Clayton G. C., Mathis J. S., 1989, ApJ, 345, 245
- Childress et al. (2013) Childress M. J., et al., 2013, ApJ, 770, 29
- Childress et al. (2014) Childress M. J., Filippenko A. V., Ganeshalingam M., Schmidt B. P., 2014, MNRAS, 437, 338
- Childress et al. (2015) Childress M. J., et al., 2015, MNRAS, 454, 3816
- Ciaraldi-Schoolmann et al. (2013) Ciaraldi-Schoolmann F., Seitenzahl I. R., Röpke F. K., 2013, A&A, 559, A117
- Contardo et al. (2000) Contardo G., Leibundgut B., Vacca W. D., 2000, A&A, 359, 876
- Contreras et al. (2010) Contreras C., et al., 2010, AJ, 139, 519
- Dessart et al. (2014a) Dessart L., Blondin S., Hillier D. J., Khokhlov A., 2014a, MNRAS, 441, 532
- Dessart et al. (2014b) Dessart L., Hillier D. J., Blondin S., Khokhlov A., 2014b, MNRAS, 441, 3249
- Ellis et al. (2008) Ellis R. S., et al., 2008, ApJ, 674, 51
- Filippenko (1997) Filippenko A. V., 1997, ARA&A, 35, 309
- Fink et al. (2007) Fink M., Hillebrandt W., Röpke F. K., 2007, AAP, 476, 1133
- Fink et al. (2010) Fink M., Röpke F. K., Hillebrandt W., Seitenzahl I. R., Sim S. A., Kromer M., 2010, AAP, 514, A53
- Foley & Kirshner (2013) Foley R. J., Kirshner R. P., 2013, ApJL, 769, L1
- Foley et al. (2016) Foley R. J., et al., 2016, MNRAS, 461, 1308
- Friedman et al. (2015) Friedman A. S., et al., 2015, ApJS, 220, 9
- Friesen et al. (2014) Friesen B., Baron E., Wisniewski J. P., Parrent J. T., Thomas R. C., Miller T. R., Marion G. H., 2014, ApJ, 792, 120
- Friesen et al. (2017) Friesen B., et al., 2017, MNRAS, 467, 2392
- Gamezo et al. (2005) Gamezo V. N., Khokhlov A. M., Oran E. S., 2005, APJ, 623, 337
- Ganeshalingam et al. (2010) Ganeshalingam M., et al., 2010, ApJS, 190, 418
- Gerardy et al. (2004) Gerardy C. L., et al., 2004, ApJ, 607, 391
- Gerardy et al. (2007) Gerardy C. L., et al., 2007, ApJ, 661, 995
- Guillochon et al. (2017) Guillochon J., Parrent J., Kelley L. Z., Margutti R., 2017, ApJ, 835, 64
- Hicken et al. (2009) Hicken M., et al., 2009, ApJ, 700, 331
- Hicks (2015) Hicks E. P., 2015, ApJ, 803, 72
- Hillier & Dessart (2012) Hillier D. J., Dessart L., 2012, MNRAS, 424, 252
- Hillier & Miller (1998) Hillier D. J., Miller D. L., 1998, APJ, 496, 407
- Hoeflich & Khokhlov (1996) Hoeflich P., Khokhlov A., 1996, ApJ, 457, 500
- Hoeflich et al. (1996) Hoeflich P., Khokhlov A., Wheeler J. C., Phillips M. M., Suntzeff N. B., Hamuy M., 1996, ApJL, 472, L81
- Hoyle & Fowler (1960) Hoyle F., Fowler W. A., 1960, APJ, 132, 565
- Iwamoto et al. (1999) Iwamoto K., Brachwitz F., Nomoto K., Kishimoto N., Umeda H., Hix W. R., Thielemann F.-K., 1999, ApJS, 125, 439
- Jackson et al. (2010) Jackson A. P., Calder A. C., Townsley D. M., Chamulak D. A., Brown E. F., Timmes F. X., 2010, APJ, 720, 99
- Jha et al. (2007) Jha S., Riess A. G., Kirshner R. P., 2007, ApJ, 659, 122
- Jordan et al. (2012) Jordan IV G. C., Perets H. B., Fisher R. T., van Rossum D. R., 2012, ApJL, 761, L23
- Kasen (2006) Kasen D., 2006, ApJ, 649, 939
- Kasen et al. (2009) Kasen D., Röpke F. K., Woosley S. E., 2009, Nature, 460, 869
- Khokhlov (1991a) Khokhlov A. M., 1991a, AAP, 245, 114
- Khokhlov (1991b) Khokhlov A. M., 1991b, AAP, 245, L25
- Krisciunas et al. (2004) Krisciunas K., et al., 2004, AJ, 127, 1664
- Krisciunas et al. (2007) Krisciunas K., et al., 2007, AJ, 133, 58
- Krisciunas et al. (2011) Krisciunas K., et al., 2011, AJ, 142, 74
- Kromer et al. (2010) Kromer M., Sim S. A., Fink M., Röpke F. K., Seitenzahl I. R., Hillebrandt W., 2010, ApJ, 719, 1067
- Kromer et al. (2013) Kromer M., et al., 2013, MNRAS, 429, 2287
- Leloudas et al. (2009) Leloudas G., et al., 2009, A&A, 505, 265
- Lentz et al. (2000) Lentz E. J., Baron E., Branch D., Hauschildt P. H., Nugent P. E., 2000, ApJ, 530, 966
- Livne & Arnett (1995) Livne E., Arnett D., 1995, APJ, 452, 62
- Livne et al. (2005) Livne E., Asida S. M., Höflich P., 2005, APJ, 632, 443
- Madison et al. (2005) Madison D. R., Baek M., Li W., 2005, Central Bureau Electronic Telegrams, 233
- Maeda et al. (2010) Maeda K., Röpke F. K., Fink M., Hillebrandt W., Travaglio C., Thielemann F.-K., 2010, ApJ, 712, 624
- Maoz et al. (2014) Maoz D., Mannucci F., Nelemans G., 2014, Annual Review of Astronomy and Astrophysics, 52, 107
- Mazzali & Hachinger (2012) Mazzali P. A., Hachinger S., 2012, MNRAS, 424, 2926
- Mazzali & Podsiadlowski (2006) Mazzali P. A., Podsiadlowski P., 2006, MNRAS, 369, L19
- Mazzali et al. (2005a) Mazzali P. A., Benetti S., Stehle M., Branch D., Deng J., Maeda K., Nomoto K., Hamuy M., 2005a, MNRAS, 357, 200
- Mazzali et al. (2005b) Mazzali P. A., et al., 2005b, ApJL, 623, L37
- Mazzali et al. (2011) Mazzali P. A., Maurer I., Stritzinger M., Taubenberger S., Benetti S., Hachinger S., 2011, MNRAS, 416, 881
- Mazzali et al. (2015) Mazzali P. A., et al., 2015, MNRAS, 450, 2631
- Nakano et al. (1995) Nakano S., Kushida R., Kushida Y., 1995, IAU Circ., 6134
- Nomoto (1982) Nomoto K., 1982, ApJ, 253, 798
- Nomoto (1984) Nomoto K., 1984, ApJ, 277, 791
- Nomoto et al. (1976) Nomoto K., Sugimoto D., Neo S., 1976, APSS, 39, L37
- Nugent et al. (1997) Nugent P., Baron E., Branch D., Fisher A., Hauschildt P. H., 1997, ApJ, 485, 812
- Pan et al. (2015) Pan Y.-C., Sullivan M., Maguire K., Gal-Yam A., Hook I. M., Howell D. A., Nugent P. E., Mazzali P. A., 2015, MNRAS, 446, 354
- Pereira et al. (2013) Pereira R., et al., 2013, A&A, 554, A27
- Perlmutter et al. (1999) Perlmutter S., et al., 1999, APJ, 517, 565
- Phillips (1993) Phillips M. M., 1993, ApJL, 413, L105
- Phillips et al. (2007) Phillips M. M., et al., 2007, PASP, 119, 360
- Pinto & Eastman (2000a) Pinto P. A., Eastman R. G., 2000a, ApJ, 530, 744
- Pinto & Eastman (2000b) Pinto P. A., Eastman R. G., 2000b, ApJ, 530, 757
- Plewa et al. (2004) Plewa T., Calder A. C., Lamb D. Q., 2004, APJL, 612, L37
- Riess et al. (1998) Riess A. G., et al., 1998, AJ, 116, 1009
- Riess et al. (1999) Riess A. G., et al., 1999, AJ, 117, 707
- Riess et al. (2005) Riess A. G., et al., 2005, ApJ, 627, 579
- Röpke & Niemeyer (2007) Röpke F. K., Niemeyer J. C., 2007, AAP, 464, 683
- Saio & Nomoto (1985) Saio H., Nomoto K., 1985, A&A, 150, L21
- Sato et al. (2015) Sato Y., Nakasato N., Tanikawa A., Nomoto K., Maeda K., Hachisu I., 2015, ApJ, 807, 105
- Scalzo et al. (2014a) Scalzo R., et al., 2014a, MNRAS, 440, 1498
- Scalzo et al. (2014b) Scalzo R. A., Ruiter A. J., Sim S. A., 2014b, MNRAS, 445, 2535
- Seitenzahl et al. (2013) Seitenzahl I. R., et al., 2013, MNRAS, 429, 1156
- Seitenzahl et al. (2016) Seitenzahl I. R., et al., 2016, A&A, 592, A57
- Silverman et al. (2012) Silverman J. M., et al., 2012, MNRAS, 425, 1789
- Silverman et al. (2015) Silverman J. M., Vinkó J., Marion G. H., Wheeler J. C., Barna B., Szalai T., Mulligan B. W., Filippenko A. V., 2015, MNRAS, 451, 1973
- Sim et al. (2010) Sim S. A., Röpke F. K., Hillebrandt W., Kromer M., Pakmor R., Fink M., Ruiter A. J., Seitenzahl I. R., 2010, ApJL, 714, L52
- Sim et al. (2013a) Sim S. A., Röpke F. K., Kromer M., Fink M., Ruiter A. J., Seitenzahl I. R., Pakmor R., Hillebrandt W., 2013a, in Di Stefano R., Orio M., Moe M., eds, IAU Symposium Vol. 281, Binary Paths to Type Ia Supernovae Explosions. pp 267–274, doi:10.1017/S1743921312015189
- Sim et al. (2013b) Sim S. A., et al., 2013b, MNRAS, 436, 333
- Stehle et al. (2005) Stehle M., Mazzali P. A., Benetti S., Hillebrandt W., 2005, MNRAS, 360, 1231
- Stritzinger et al. (2006) Stritzinger M., Leibundgut B., Walch S., Contardo G., 2006, A&A, 450, 241
- Sullivan et al. (2009) Sullivan M., Ellis R. S., Howell D. A., Riess A., Nugent P. E., Gal-Yam A., 2009, ApJL, 693, L76
- Swartz et al. (1995) Swartz D. A., Sutherland P. G., Harkness R. P., 1995, ApJ, 446, 766
- Swift et al. (2001) Swift B., Li W. D., Schwartz M., 2001, IAU Circ., 7611
- Tanaka et al. (2006) Tanaka M., Mazzali P. A., Maeda K., Nomoto K., 2006, ApJ, 645, 470
- Taubenberger et al. (2013) Taubenberger S., et al., 2013, MNRAS, 432, 3117
- Travaglio et al. (2004) Travaglio C., Hillebrandt W., Reinecke M., Thielemann F.-K., 2004, AAP, 425, 1029
- Walker et al. (2012) Walker E. S., Hachinger S., Mazzali P. A., Ellis R. S., Sullivan M., Gal Yam A., Howell D. A., 2012, MNRAS, 427, 103
- Wang et al. (2012) Wang X., et al., 2012, ApJ, 749, 126
- Whelan & Iben (1973) Whelan J., Iben Jr. I., 1973, ApJ, 186, 1007
- Wood-Vasey et al. (2008) Wood-Vasey W. M., et al., 2008, ApJ, 689, 377
- Woosley (1997) Woosley S. E., 1997, ApJ, 476, 801
- Woosley & Kasen (2011) Woosley S. E., Kasen D., 2011, ApJ, 734, 38
- Woosley & Weaver (1994) Woosley S. E., Weaver T. A., 1994, APJ, 423, 371
- Woosley et al. (2007) Woosley S. E., Kasen D., Blinnikov S., Sorokina E., 2007, ApJ, 662, 487
- Zhao et al. (2015) Zhao X., et al., 2015, ApJS, 220, 20
- van Dyk et al. (1994) van Dyk S. D., Treffers R. R., Richmond M. W., Filippenko A. V., Paik Y. B., 1994, IAU Circ., 6105