The Slashdot Zoo: Mining
a Social Network with Negative Edges
Abstract
We analyse the corpus of user relationships of the Slashdot technology news site. The data was collected from the Slashdot Zoo feature where users of the website can tag other users as friends and foes, providing positive and negative endorsements. We adapt social network analysis techniques to the problem of negative edge weights. In particular, we consider signed variants of global network characteristics such as the clustering coefficient, node-level characteristics such as centrality and popularity measures, and link-level characteristics such as distances and similarity measures. We evaluate these measures on the task of identifying unpopular users, as well as on the task of predicting the sign of links and show that the network exhibits multiplicative transitivity which allows algebraic methods based on matrix multiplication to be used. We compare our methods to traditional methods which are only suitable for positively weighted edges.
category:
I.2.6 Computing Methodologies Artificial Intelligencekeywords:
Learningcategory:
H.4.0 Information Systems Applications Generalkeywords:
Social network, Slashdot Zoo, negative edge, link prediction1 Introduction
Social network analysis studies social networks by means of analysing structural relationships between people. Accordingly, social networks are usually modeled using directed graphs, were an edge between two nodes represents a relationship between two individuals. While most social network modeling approaches allow for weighted edges, the weights are usually restricted to positive values. However, some relationships such as distrust and dislike are inherently negative. In such cases, the social network contains negative edge weights.
Slashdot111http://slashdot.org/ is a technology news website founded in 1997. It publishes stories written by editors or submitted by users and allows users to comment on them. In 2002, the site added the Zoo feature, which lets users tag other users as friends and foes. It is therefore an early example of an online service with a social networking component. In constrast to most popular social networking services, Slashdot is one of the few sites that also allows users to rate other users negatively.
In this paper, we systematically study signed versions of methods for network analysis. We study the Slashdot Zoo corpus on a global level, on the level of individual nodes, and on the level of individual edges. On the global level, we analyse measures that characterize the network as a whole. We consider the clustering coefficient of the Slashdot Zoo corpus and propose the signed clustering coefficient and the relative signed clustering coefficient. On the node level, we study measures applying to individual nodes of the network. We review signed popularity and centrality measures and evaluate them on the task of indentifying troll users. On the edge level, we analyse similarity measures that apply to pairs of nodes and evaluate their use for the task of predicting signed links.
The network analysis methods we will present are all based on the concept of transitivity which stipulates that relations between any two nodes in the network can be described by paths between the two nodes. In networks with negative edge weights the concept of transitivity has to take into account negative values. In the simplest case we can ask: If there is a path of signed edges between two nodes in the network, what relation can we induce between the two nodes? We will show that the solution to this question is a multiplication rule exemplified by the phrase the enemy of my enemy is my friend. By analysing the signed graph on various levels, we will show that this multiplicative transitivity rule is indeed valid for the Slashdot Zoo.
The rest of the paper is structured as follows. In Section 2, we discuss related work. Section 3 presents the Slashdot Zoo corpus. For network analysis on the global level, Section 4 presents the signed clustering coefficient. Section 5 discusses various popularity measures on the node level and evaluates them for the task of indentifying unpopular users. Section 6 reviews distance and similarity measures on the link level and evaluates them on the task of link sign prediction. We conclude in Section 7.
2 Related Work
Social network analysis (SNA) has a background in sociology [24]. The proliferation of Web 2.0 sites which focus on user participation for content creation resulted in very large datasets that call for advanced data mining techniques. A general discussion of Slashdot can be found in [19]. The Slashdot discussion threads are studied in [6].
Most of the web-based social network analysis considers the case of unsigned networks, where edges are either unweighted, or only weighted with positive values [24]. Recent studies [10] describe the social network extracted from Essembly, an ideological discussion site that allows users to mark other users as friends, allies and nemeses, discussing the semantics of the three relation types. These works model the different types of edges by means of three different graphs. In this paper, we avoid such overhead and analyse all edges in a single graph with weighted edges.
Other recent work [28] considers the task of discovering communities from social networks with negative edges. However, the negative edges are only used to separate communities (clusters), and do not serve as a measure of popularity or similarity. Signed graphs have been used in anthropology to model friendship and enmity [7].
Work on trust networks is by definition concerned with negative edges. Work in that field has mostly focused on defining global trust measures using path lengths or adapting PageRank [3, 5, 14]. In this paper we compare these approaches to our techniques and find them to yield inferior results. Collaborative filtering aims at predicting or recommending links in a bipartite user-item graph [9]. The edge weights in such a graph often admit negative values, indicating a dislike of the item in question. However, the methods of collaborative filtering cannot immediately be applied to social network analysis, because links in the bipartite graph are not directed and relations between users extracted from a bipartite graph are necessarily symmetric.
The clustering coefficient was first described in [26] and extended to positively weighted edges in [13]. The task of link prediction in social networks is described in [20] for the case of positive edges. Distance and similarity in unsigned social networks are described in [27]. These measures are based on shortest-path distances and spectral measures such as PageRank and HITS. Graph kernels are described in [2, 15, 17]. Their application to link prediction and recommendation is covered in [12]. In all these works however, only positively weighted edges are considered.
Balance in a signed graph is defined in [8].
Variants of Laplacian graph kernels that apply to networks with negative edges are described in [18, 11], where they are used in an undirected setting for collaborative filtering. Centrality and trust measures based on the graph Laplacians are described in [22] for graphs with only positive edge weights.
3 The Slashdot Zoo
The Slashdot Zoo corpus we consider in this paper contains 77,985 users and 510,157 links. Each link consists of a user who gave an endorsement and a user who received the endorsement. Endorsements can be either positive (“friend”) or negative (“foe”). Apart from this distinction, no other information is available; in particular, the creation date of endorsements is not known.

In addition to the terms “friend” and “foe”, Slashdot also uses the terms “fan” and “freak”: A user is always the fan of his friends and the freak of his foes. Figure 2 summarizes these relationships.
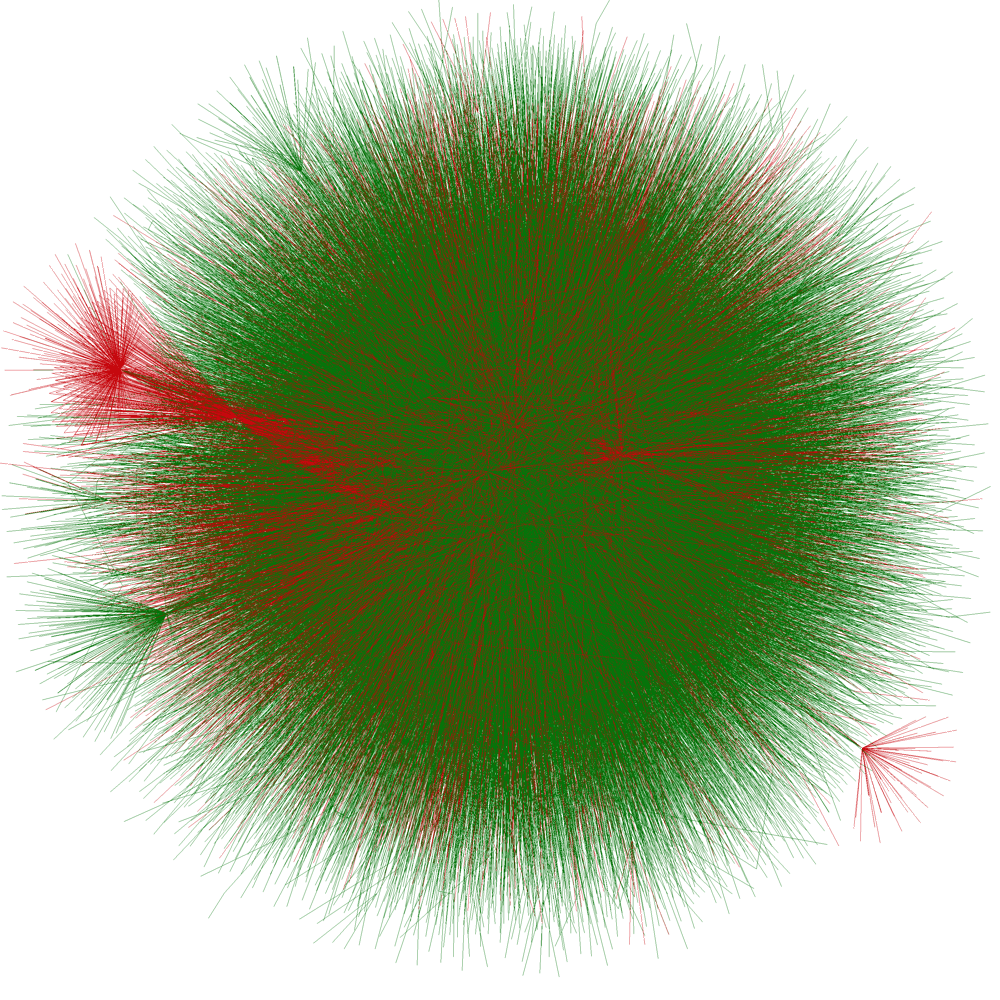
Figure 1 is a graphical representation of the Slashdot Zoo corpus. The sign of an edge is represented by its color, with green representing the “friend” relationship and red representing the “foe” relationship. The graph is centered at user CmdrTaco, founder of Slashdot and active editor.
Since this data was retrieved between May and October 2008, our corpus does not represent a true “snapshot” of the network, and may exhibit anomalies. For instance, since it was not possible to determine when a user added a tag, some users in our corpus may have more than 400 friends or foes, although Slashdot generally limits the number of friends and foes to 200 users and to 400 users for subscribers.
Slashdot is known for both having very popular and prominent users on the one hand, and rather unpopular users on the other hand. Prominent and popular users of Slashdot include CmdrTaco (Rob Malda, the founder of Slashdot and a popular editor), John Carmack (prominent computer game programmer), Bruce Perens (prominent computer programmer and open source advocate) and CleverNickName (Wil Wheaton, Star Trek actor). In addition, Slashdot is well known for having a rich tradition of trolling, i.e. the posting of disruptive, false or offensive information to fool and provoke readers. The high number of such trolls may explain why the “foe” feature is useful on Slashdot. It allows for tagging known trolls and reducing their visibility.
3.1 Definitions
For our graph-based representation of this corpus, we use the following definitions:
-
•
, the number of users
-
•
are specific users
-
•
is the adjacency matrix with values when user marked user as a friend and when user marked user as a foe. is sparse, square and asymmetric.
-
•
, the absolute adjacency matrix defined by
-
•
, the symmetric adjacency matrix
-
•
, the absolute symmetric adjacency matrix
-
•
, the absolute diagonal degree matrix defined by
-
•
, the absolute symmetric diagonal degree matrix defined by
3.2 Statistics
| Users | 77,985 |
|---|---|
| Links | 510,157 |
| Friend links | 388,190 |
| Foe links | 121,967 |
| Sparsity | 0.000083884 |
| Mean link count | 6.542 |
| Mean friend/fan count | 4.978 |
| Mean foe/freak count | 1.564 |
| Median links | 3 |
| Median friend count | 1 |
| Median foe count | 0 |
| Median fans count | 1 |
| Median freaks count | 1 |
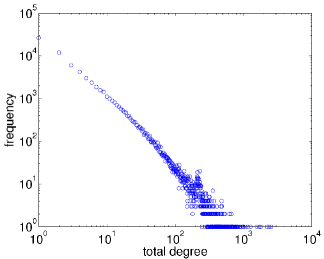
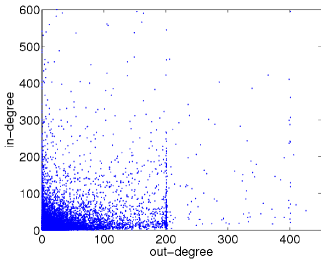
Table 1 displays basic statistics of the corpus. Figure 3 shows the degree distributions in the Slashdot Zoo. As expected, the degree distribution in the Slashdot Zoo follows a power law. Figure 4 shows the in-degree plotted against the out-degree.
| Diameter | 6 |
|---|---|
| Radius | 3 |
| Average distance | 3.86 (5.82) |
Table 2 shows graph statistics based on shortest path distances. All distances were calculated without taking into account the edge directions and sign. In parentheses, we show the average distance as computed in [26]. As observed in that article, the measured average distance is less than the average distance in a random graph, confirming that the Slashdot Zoo is a small-world network.
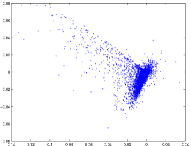
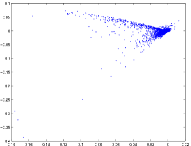
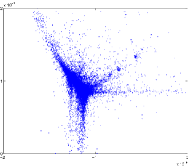
Figure 5 shows three variants of principal components analysis, visualizing the dataset. The first two plots show the users plotted by the ratings they have given and the ratings they have received, respectively. The third plot shows the principal component analysis as given by the Laplacian kernel of Equation 11 in Section 6. As we will see, the projection using the Laplacian kernel gives a plot preserving the resistance distance between nodes in the network.
In the next three sections, we study the Slashdot Zoo corpus on the global, node and link levels.
4 Clustering Coefficient
To test our hypothesis of multiplicative transitivity, we begin by defining and studying a global network statistic that denotes to what extent the multiplication rule is valid in a signed network. To that end, we extend the clustering coefficient to networks with signed, directed edges to give the signed clustering coefficient, introduce the relative signed clustering coefficient, and give the values observed for the Slashdot Zoo corpus. As we will see, the signed clustering coefficient denotes the transitivity of edge signs, giving an indication whether our multiplicative transitivity assumption is justified. The two next sections will then study popularity and link prediction algorithms that directly make use of multiplicative transitivity. We begin by defining multiplicative transitivity.
Definition. A signed network exhibits multiplicative transitivity when any two incident edges tend to be completed by a third edge having as a weight the product of the two edges’ weights.
Multiplicative transitivity is motivated by the fact that triangles of users connected by an even number of negatively weighted edges can be considered balanced [7], which can be summarized by the phrase the enemy of my enemy is my friend and its permutations. As we will see in later sections, the assumption of transitive multiplicativity lends itself to using algebraic methods based on the adjacency graph of the network. To see why this is true, consider that the square of the signed adjacency matrix contains at its entry a sum of paths of length two between and weighted positively or negatively depending on whether a third positive edge between and would lead to a balanced or unbalanced triangle. As a measure of multiplicative transitivity, this section begins by proposing the signed clustering coefficient.
The clustering coefficient was introduced in [26]. An extension was proposed in [13] that works with positively weighted edges. The clustering coefficient is a characteristic number of a graph taking values between zero and one, denoting the tendency of the graph nodes to form small clusters. The signed clustering coefficient we define denotes the tendency of small clusters to be coherent. Therefore, the signed clustering coefficient will take on values between and . The relative signed clustering coefficient will be defined as the quotient between the two.
The clustering coefficient is defined as the proportion of all incident edge pairs that are completed by a third edge to form a triangle. Figure 6 gives an illustration. Alternatively, the clustering coefficient can be defined algebraically using the adjacency matrix of the network. Given an undirected, unweighted loopless graph with unsigned adjacency matrix , its clustering coefficient is given by
| (1) |
where represents the Hadamard product (entrywise product) of two matrices, and denotes the sum of all matrix elements. Since is undirected and unweighted, is a nonnegative symmetric matrix with a diagonal of zero.
If we now suppose that is a directed graph, will no longer be symmetric, but Expression 1 is still defined. In this case, only edges completing two directed edges in the correct orientation will be counted.
To extend the clustering coefficient to negative edges, we assume a multiplication rule for two incident signed edges. The multiplication rule captures the intuition that the enemy of my enemy is my friend. As shown in Figure 6, an edge completing two incident edges and to form a triangle must fulfill the equation . Because already contains the value for negative edges, the square will contain the sum of such products, leading to the following expression for calculating the signed clustering coefficient:
| (2) |
Therefore, the signed clustering coefficient denotes to what extent the graph exhibits multiplicative transitivity. In actual social networks, we expect it to be positive.
Additionally, we define the relative signed clustering coefficient as the quotient of the signed and unsigned clustering coefficients. Graphs with a high relative signed clustering coefficient are thus graphs for which the multiplication rule applies.
| (3) |
The relative signed clustering coefficient takes on values between and . It is when all triangles are oriented coherently. In networks with negative relative signed clustering coefficients, the sign multiplication rule does not hold. The directed signed clustering coefficient and directed relative signed clustering coefficient can be defined analogously with Expressions (2) and (3).
The signed clustering coefficient and relative signed clustering coefficient are zero in random networks, when the sign of edges is distributed equally. The signed clustering coefficients are by definition smaller than their unsigned counterparts. The unsigned clustering coefficient overestimates the number of “correctly” placed edges by ignoring their weight.
| Clustering coefficient | 3.19% (0.0095%) |
|---|---|
| Directed clustering coefficient | 5.62% (0.0191%) |
| Signed clustering coefficient | 2.44% |
| Directed signed clustering coefficient | 4.44% |
| Relative signed clustering coefficient | 76.4% |
| Directed relative signed clustering coefficient | 79.0% |
Table 3 gives all four variants of the clustering coefficient measured in the Slashdot Zoo corpus, along with the relative signed clustering coefficients. We also give the clustering coefficient of a random graph of the same size, as described in [26]. The clustering coefficient of the Slashdot Zoo is significantly larger than that of a random graph of equal size. Together with the obsersvation in Table 2 that the average distance between nodes is less than in that of a random graph, we follow Watts and Strogatz [26] and conclude that the Slashdot Zoo exhibits the small-world phenomenon. The high values for the relative clustering coefficients show that our multiplication rule is valid in the Slashdot Zoo, and justifies the use of algebraic methods in the next two sections for popularity and link prediction methods.
5 Popularity and Centrality
In this section, we review measures that apply to single nodes in the network. We show how standard centrality and popularity measures can be extended to the case of negative edges, and how these perform on the task of identifying unpopular users.
Centrality in the broadest sense is a measure computed for each node in a graph, denoting to what extent the node is central to the graph. In social networks, such measures are also called importances. Central nodes are usually well connected to other nodes, and at a short distance to most other nodes. On the other hand, decentral nodes are poorly connected and at a greater distance to other nodes. Centrality measures can be defined by taking a given distance measure on the graph, and measuring the average distance from all other nodes. Other centrality measures are defined by considering a flow or diffusion process in the network, and computing the amount of flow going through each node. The notion of trust is usually personalized, i.e. it applies to pairs of users. If however trust is taken as a global measure, then it corresponds largely to the concept of popularity we study here.
While centrality can be defined independently of edge signs, giving measures of who is central regardless of any sign, we will focus on centrality measures that are signed, and can be used to identify both top and bottom users, corresponding to well-liked and much-unliked users. We will first describe the various centrality measures we used, then give the top six users for each, and then evaluate the measures on the task of identifying trolls.
5.1 Popularity and Centrality Measures
We now describe the centrality and popularity measures we evaluated.
5.1.1 Fans Minus Freaks (FMF)
As a baseline popularity measure, we use the number of fans and freaks a user has for calculating his reputation. We subtract the number of freaks from the number of fans, giving a signed number. We expect popular users to have a high number of fans and unpopular users a high number of freaks, making this measure a valid indicator of popularity. While this measure is simple, it can also be exploited easily using multiple accounts. Malicious users may create accounts with the sole purpose of marking oneself as a friend, just as malicious websites may try to create linkfarms in order to boost their ranking in search engines.
5.1.2 PageRank (PR)
PageRank is a spectral popularity measure defined on directed graphs with nonnegative edge weights [23]. It models the path of a random “surfer” following the directed edges of the graph randomly, and “teleporting” to a random node at randomly chosen intervals. Equivalently, it can be defined as the dominant left eigenvector of the Google matrix , given by
| (4) |
where is a matrix full of ones of the specified size, and is the teleportation parameter. The matrix is left-stochastic (each row sums to one). Since PageRank only applies to nonnegative edge weights, we have to use the unsigned adjacency matrix instead of . The resulting rank is thus not an indication of popularity, but more an indication of centrality, denoting the tendency of users to be central, without distinguishing friend and foe links.
5.1.3 Signed Spectral Ranking (SR)
PageRank was extended to the case of negative edge weights several times [3, 14], modeling the resulting ranking as a measure of popularity. We compute the signed spectral ranking as the dominant left eigenvector of the signed matrix :
| (5) |
The resulting popularity measure admits both positive and negative values, and represents a measure of popularity in the network, with positive edges corresponding to a positive endorsement and negative edges to negative endorsements. This interpretation is consistent with the semantics of the “friend” and “foe” relationships.
5.1.4 Signed Symmetric Spectral Ranking (SSR)
We apply spectral ranking to the symmetric matrix . Thus, outlinks by users are counted towards the popularity of a user. While this measure could be exploited by users to gain a high rank, it models the idea that “popular” users will refrain from having many foes, and that negative edges are more prevalent between unpopular users, regardless of the edge direction.
5.1.5 Negative Rank (NR)
Comparing PageRank with Signed Spectral Ranking in Figure 7 shows that these two rankings correlate highly. We observe that for most users, both measures are almost equal. For known trolls however, the Signed Spectral Rank seems to be much less than PageRank. Therefore, we propose to subtract the two to define the Negative Rank:
| (6) |
The parameter determines the influence of PageRank on the ranking, and SR and PR are both of unit-length. For , Negative Rank corresponds to the Signed Spectral Rank. We will first assume a value of for now, and study the influence of later.
5.2 Top and Central Users
The top six users for each popularity and centrality measure are shown in Table 4. We do not show the bottom users to discourage users abusing the system. However, we note that in the list of users with most freaks, place five is taken by user JonKatz, an editor that left Slashdot in 2002. The bottom users in the Fans Minus Freaks and Signed Spectral Clustering measures are known Slashdot trolls. The bottom users for Signed Symmetric Spectral Rank and PageRank are not known trolls.
The top users for Negative Rank are actually neither prominent nor very central in the Slashdot community. We explain this by the fact that many users have a high Negative Rank of approximately zero, just as if we used a low number of freaks as a measure for finding popular users: While users without freaks may be popular, there are so many of them that the metric is not useful to find the very popular users. However, as we will see, Negative Rank is very good at identifying unpopular users.
| Fans Minus Freaks | |
|---|---|
| CleverNickName | 2460 |
| Bruce Perens | 2143 |
| CmdrTaco | 2005 |
| John Carmack | 1663 |
| NewYorkCountryLawyer | 1179 |
| $$$$$exyGal | 1170 |
| PageRank | |
| FortKnox | 0.1510 |
| SamTheButcher | 0.1342 |
| Ethelred Unraed | 0.1280 |
| turg | 0.1266 |
| Some Woman | 0.1254 |
| gmhowell | 0.1247 |
| Signed Spectral Ranking | |
| FortKnox | 0.1527 |
| SamTheButcher | 0.1388 |
| turg | 0.1319 |
| Some Woman | 0.1310 |
| Ethelred Unraed | 0.1297 |
| gmhowell | 0.1263 |
| Signed Symmetric Spectral Ranking | |
| Ethelred Unraed | 0.1395 |
| johndiii | 0.1376 |
| FortKnox | 0.1358 |
| turg | 0.1351 |
| Some Woman | 0.1309 |
| SamTheButcher | 0.1276 |
| Negative Rank | |
| johndiii | 0.006279 |
| SolemnDragon | 0.006181 |
| Some Woman | 0.005515 |
| KshGoddess | 0.005487 |
| turg | 0.005299 |
| btlzu2 | 0.005179 |
Table 4 shows that the top five users for Fans Minus Freaks are prominent. For the other measures however, the top users are frequent users, but not prominent. We suspect that these users have a greater involvement in the Slashdot community, leading to a tightly clustered network of friends. Prominent users such as CmdrTaco on the other hand may have many fans, but are not central to the Slashdot community.
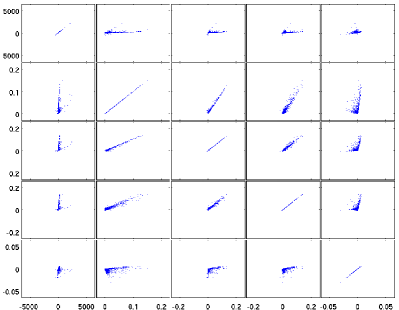
Figure 8 plots the five centrality and popularity measures against each other. We observe a positive correlation between the three spectral methods, and no significant correlation between Fans Minus Freaks, Negative Rank and the other methods.
5.3 Predicting Trolls
To evaluate whether our popularity measures are able to make good predictions for unpopular users, we evaluate them on the task of identifying trolls. Such an automatic identification of trolls could for instance be used to maintain a list of trolls more accurately than maintaining it by hand.
As a benchmark, we use the foes of the user No More Trolls. This user account was created with the purpose of collecting names of trolls. Any Slashdot user can tag this user as his friend, and then, in the settings, give a malus to foes-of-a-friend, which reduces the visibility of No More Trolls’ foes. We use only known trolls having a minimum of 20 incident edges, as trolls with fewer edges would be hard to predict. There are 162 known trolls found this way.
The task consists of predicting who these trolls are by using a popularity measure defined in the corpus excluding edges incident to No More Trolls. We use each measure for predicting the unpopular users, and give the mean average precision (MAP) for each [21].
In addition to the five popularity measures above, we use the negated number of freaks as a further popularity measure. For Negative Rank, we use .
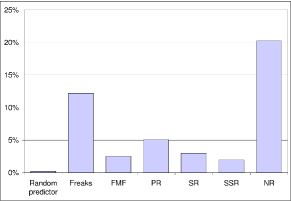
The results are shown in Figure 9. We observe Negative Rank to perform best. We also observe that the negated number of freaks performs better than any spectral measures except Negative Rank. Signed spectral ranking alone performs very badly, indicating that taken alone, it is not a good indicator of popularity, but has to be combined with PageRank to give Negative Rank.
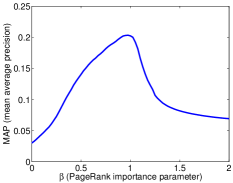
We study the influence of the parameter on the performance of Negative Rank in Figure 10. We observe that the optimal performance is attained at , confirming our previous assessment.
6 Link Prediction
In this section, we analyse measures defined on node pairs. This type of measure covers similarities, distances, mutual trust, and other related concepts. These measures are usually the most important in social network studies, first because they describe the most structure in the network, second because they can be applied to link prediction and recommendation. Since most link prediction methods can be formulated algebraically using matrix multiplication, we will be able to verify our assumption of multiplicative transitivity.
We will thus focus on the task of predicting links in signed social networks. In particular, we cover the prediction of the sign of edges. Because link prediction algorithms defined for networks with nonnegative edge weights are only able to predict the presence or absence of an edge, we will have to define new link prediction algorithms that take into account the edge sign, and are able to predict missing edges’ sign.
In social networking websites, link prediction allows the implementation of recommender systems that can recommend new edges. In the case of Slashdot, a possible application would be the recommendation of new users to one’s friend and foe list. For these reasons, link prediction is one of the most important machine learning task that applies to large networks.
6.1 Problem Formulation
A common way to model the link prediction task is via the notion of similarity: If two nodes are similar, then they are likely to be connected by an edge already, and if not, to be connected soon. Thus, a measure of similarity defined on a given edge set can be used to implement a link prediction algorithm. We will therefore focus on the definition of similarity measures between nodes: functions that, given two nodes in the network, return a similarity value.
Similarity functions are usually symmetric. Also, they are often positive semi-definite. If both conditions are met, a similarity function is a kernel. However, similarity functions need not necessarily be symmetric and positive semi-definite in our setting: We may predict a link between and without predicting a link between and . In this case, we may call such a function a proximity measure.
6.2 Baseline Algorithms
As baseline prediction algorithms, we use the three following strategies:
-
•
() Always predict a positive edge. This strategy has an accuracy greater than zero because there are more positive than negative edges.
-
•
() If there is an edge in the opposite direction, predict the sign of that edge. Else predict a positive edge.
-
•
() Use the squared adjacency matrix for prediction. This simple strategy makes use of multiplicative transitivity.
We found similarity measures based on the shortest-path distance to have no better accuracy than these three. The accuracy of the baseline algorithms is shown in Table 5.
| 0.517 | |
|---|---|
| 0.536 | |
| 0.552 |
6.3 Algebraic Similarity Measures
In the previous section, we used the square of the adjacency matrix to make predictions about the sign of new edges. While calculating the square of is possible given the corpus’ size, computing the cube of is already too expensive: While itself is sparse, contains non-zero values for all node pairs that are separated by at most three edges. Given that the graph’s radius is three and its diameter is six, computing other powers of after results in non-sparse matrices, which are too big for practical calculations. Therefore, we resort to dimensionality reduction.
6.3.1 Dimensionality Reduction (A)
The matrix can be reduced dimensionally by performing a sparse singular value decomposition, resulting in a low-rank approximation of the original matrix:
| (7) |
, and are of dimensions , and respectively, and is symmetric. The integer is the reduced dimension.
While the matrix contains zero entries for edges not present in the original graph, the approximation is nonzero at these entries, and the sign of these entries can be used as a prediction for the sign of missing edges. In contrast to calculating sparse matrix powers as we do for our baseline algorithms, dimensional reduction is efficient and can be applied to large, sparse matrices.
6.3.2 Symmetric Dimensionality Reduction (A sym)
As shown in the previous section, using edges going in the opposite direction gives more accurate prediction than only predicting positive edges. Therefore, we apply dimensionality reduction to the symmetric matrix . In the case of symmetric matrices, we use the eigenvalue decomposition:
| (8) |
Just as for (asymmetric) dimensionality reduction, the integer represents a parameter of the prediction algorithm.
6.3.3 Matrix Exponential (A exp, A sym exp)
The exponential kernel is a similarity measure based on the matrix exponential function [12]. It is based on the observation that, analogously to the real exponential, the matrix exponential can be expressed as an infinite sum of matrix powers, with weights that decay with the inverse factorial:
| (9) |
Because the -th power of the adjacency matrix of a graph contains, for each node pair, the number of paths of length between the two nodes, the matrix exponential represents a weighted mean of path counts between any two nodes, with weights decaying as the inverse factorial. With the graph containing negative edges, the powers of represent signed path counts, where paths with an odd number of negative edges are counted negatively, thus implementing our enemy-of-an-enemy multiplication rule generalized to arbitrarily long paths. Although in the case of an asymmetric the exponential does not represent a kernel, we can still use it for edge sign prediction.
Therefore, the matrix exponential will in many cases give the same predictions for node pairs that have a distance of 2, but unlike simply using will also give sensible predictions for nodes further apart, instead of resorting to simply predicting a positive edge.
To compute the matrix exponential, we use the fact that the matrix exponential of a dimensionally reduced matrix can be computed by applying the exponential to the diagonal matrix of eigenvalues. For the symmetric case, we have:
| (10) |
The exponential of the diagonal matrix can be computed by applying the real exponential to every diagonal element.
6.3.4 Inverted Laplacian (Ls sym)
Laplacian kernels are defined mathematically by the pseudoinversion of the graph’s Laplacian matrix . Depending on the precise definition, Laplacian kernels are known as resistance distance kernels [16], random forest kernels [2], random walk or mean passage time kernels [4] and von Neumann kernels [15].
Laplacian kernels have been applied to the social network analysis problems of co-authorship graph mining [1], collaborative recommender systems and community detection [4]. In these cases however, the underlying graphs have only positive edges. In order to apply Laplacian kernels to graphs with negative edges, we use the measure described as the signed resistance distance in [18], defined as:
| (11) |
Where is the symmetric adjacency matrix and is the diagonal degree matrix.
As with the matrix exponential, the matrix pseudoinverse can be computed easily in conjunction with dimensionality reduction, by pseudoinverting the diagonal matrix, which amounts to inverting those diagonal elements that are (numerically) non-zero.
Although asymmetric (“directed”) Laplacians can be defined [25], we found through extensive experimentation that they perform poorly for our task.
6.4 Experimental Evaluation
To evaluate the link prediction algorithms, we split the set of edges into a training set and a test set, train a similarity measure on the training set, and use that similarity measure to predict the sign of the edges in the test set. We simply use the sign of the similarity function as the prediction: If the similarity function returns a positive value, we predict a positive edge, else we predict a negative edge. In our evaluation, we hold out 30% of the edges as the test set.
We measure the prediction accuracy on a scale from to , where denotes all correct prediction and denotes all wrong sign prediction. Thus, an algorithm that predicts positive and negative edges randomly with equal probability would have an accuracy of zero.
The evaluation results are shown in Figure 11. Each similarity measure is evaluated using a varying dimensional reduction parameter .
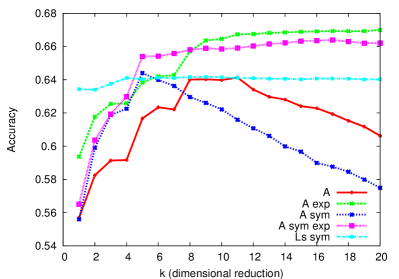
Our empirical study shows that the exponential kernels perform better than their non-exponential counterparts. Also, they do not suffer from overfitting the data as grows: The exponential kernels attain their best performance asymptotically for large , while A and A sym attain their greatest accuracy for specific, small values of . Numerically, this is best explained by the fact that the exponential function lets the eigenvalues of the exponential kernel become small very fast for growing . The overall best prediction accuracy is achieved by the asymmetric matrix exponential. The good performance of the exponential kernels indicates that the multiplicative transitivity in the Slashdot Zoo can be extended to paths of length greater than two if corresponding damping factors are used, as done implicitly in the exponential kernel. The fact that the asymmetric exponential kernel outperforms the symmetric exponential kernel is a hint that the assumption of symmetry is wrong in the study of multiplicative transitivity in this signed network.
The signed Laplacian similarity matrix provides comparable accuracy to simple dimensionally reduction. However, it does not suffer from overfitting for large , and it already attains it’s good performance for very small .
7 Conclusion
This paper considered social network analysis on graphs with negative edge weights. We studied the Slashdot Zoo, a social network that is well-known for containing negative links. Our analysis of that social network was carried out on three levels. On the global level, we defined the signed clustering coefficient and relative signed clustering coefficient. On the node level we defined Negative Rank, a new popularity measure and showed how it can be used to identify troll users in the Slashdot community. On the link level, we studied the task of link sign prediction using various signed spectral similarity measures. The study of the Slashdot Zoo on these three levels showed that the network exhibits multiplicative transitivity, a property of signed social networks that can be summarized by the phrase the enemy of my enemy is my friend. We showed that these methods for analysing a network with negative edge weights apply to large social networks and reveal facts that cannot be uncovered using common, unsigned techniques.
Currently, we analyse further social networks with positive and negative endorsements. The software running Slashdot is called Slash222http://www.slashcode.com/ and is nowadays also used on other websites such as Barrapunto, Slashdot Japan, and Use Perl. These sites also use the Zoo feature, and could be analysed just as the Slashdot Zoo. Another source of negative links in social networks are sites such as Digg where users can rate content by other users, giving rise to indirect negative edges. The sites Essembly [10] and Epinions [5] also represent social networks with negative edges.
Some social network analysis methods were not covered in this paper, but could conceivably be extended to the signed case: betweenness centrality measures, spectral clustering, random graph modeling of signed social networks, stochastic approaches for prediction (which are similar to the resistance distance approach), and others.
References
- [1] A. T. Balaban and D. J. Klein. Co-authorship, rational Erdős numbers, and resistance distances in graphs. Scientometrics, 55(1):59–70, 2002.
- [2] P. Chebotarev and E. V. Shamis. On proximity measures for graph vertices. Automation and Remote Control 10, 59:1443–1459, 1998.
- [3] C. de Kerchove and P. V. Dooren. The PageTrust algorithm: how to rank web pages when negative links are allowed? In Proc. SIAM Int. Conf. on Data Mining, pages 346–352, 2008.
- [4] F. Fouss, A. Pirotte, J.-M. Renders, and M. Saerens. Random-walk computation of similarities between nodes of a graph with application to collaborative recommendation. IEEE Trans. on Knowledge and Data Engineering, 19(3):355–369, 2007.
- [5] R. Guha, R. Kumar, P. Raghavan, and A. Tomkins. Propagation of trust and distrust. In Proc. Int. Conf. on World Wide Web, pages 403–412, 2004.
- [6] V. Gómez, A. Kaltenbrunner, and V. López. Statistical analysis of the social network and discussion threads in Slashdot. In Proc. Int. Conf. on World Wide Web, pages 645–654, 2008.
- [7] P. Hage and F. Harary. Structural Models in Anthropology. Cambridge University Press, 1983.
- [8] F. Harary. On the notion of balance of a signed graph. Michigan Math. J., 2(2):143–146, 1953.
- [9] J. L. Herlocker, J. A. Konstan, A. Borchers, and J. Riedl. An algorithmic framework for performing collaborative filtering. In Proc. Int. Conf. on Research and Development in Information Retrieval, pages 230–237, 1999.
- [10] T. Hogg, D. Wilkinson, G. Szabo, and M. Brzozowski. Multiple relationship types in online communities and social networks. In Proc. AAAI Spring Symposium on Social Information Processing, 2008.
- [11] Y. Hou. Bounds for the least Laplacian eigenvalue of a signed graph. Acta Mathematica Sinica, 21(4):955–960, 2005.
- [12] T. Ito, M. Shimbo, T. Kudo, and Y. Matsumoto. Application of kernels to link analysis. In Proc. Int. Conf. on Knowledge Discovery in Data Mining, pages 586–592, 2005.
- [13] G. Kalna and D. J. Higham. A clustering coefficient for weighted networks, with application to gene expression data. AI Commun., 20(4):263–271, 2007.
- [14] S. D. Kamvar, M. T. Schlosser, and H. Garcia-Molina. The EigenTrust algorithm for reputation management in P2P networks. In Proc. Int. Conf. on World Wide Web, pages 640–651, 2003.
- [15] J. Kandola, J. Shawe-taylor, and N. Cristianini. Learning semantic similarity. In Advances in Neural Information Processing Systems, pages 657–664, 2002.
- [16] D. J. Klein and M. Randić. Resistance distance. Mathematical Chemistry, 12(1):81–95, 1993.
- [17] R. Kondor and J. Lafferty. Diffusion kernels on graphs and other discrete structures. In Proc. Int. Conf. on Machine Learning, pages 315–322, 2002.
- [18] J. Kunegis, S. Schmidt, C. Bauckhage, M. Mehlitz, and S. Albayrak. Modeling collaborative similarity with the signed resistance distance kernel. In Proc. Eur. Conf. on Artificial Intelligence, pages 261–265, 2008.
- [19] C. Lampe and E. Johnston. Follow the (Slash) dot: Effects of feedback on new members in an online community. In Proc. Int. Conf. on Supporting Group Work, pages 11–20, 2005.
- [20] D. Liben-Nowell and J. Kleinberg. The link prediction problem for social networks. In Proc. Int. Conf. on Information and Knowledge Management, pages 556–559, 2003.
- [21] M. A. Najork, H. Zaragoza, and M. J. Taylor. Hits on the web: how does it compare? In Proc. Int. Conf. on Research and Development in Information Retrieval, pages 471–478, 2007.
- [22] M. E. J. Newman. A measure of betweenness centrality based on random walks. Social Networks, 27(1):39–54, 2005.
- [23] L. Page, S. Brin, R. Motwani, and T. Winograd. The PageRank citation ranking: Bringing order to the web. Technical report, Stanford Digital Library Technologies Project, 1998.
- [24] J. Scott. Social Network Analysis: a Handbook. Sage Publications, 2000.
- [25] H. Tong, C. Faloutsos, and Y. Koren. Fast direction-aware proximity for graph mining. In Proc. Int. Conf. on Knowledge Discovery and Data Mining, pages 747–756, 2007.
- [26] D. J. Watts and S. H. Strogatz. Collective dynamics of ‘small-world’ networks. Nature, 393(6684):440–442, June 1998.
- [27] S. White and P. Smyth. Algorithms for estimating relative importance in networks. In Proc. Int. Conf. on Knowledge Discovery and Data Mining, pages 266–275, 2003.
- [28] B. Yang, W. Cheung, and J. Liu. Community mining from signed social networks. IEEE Trans. on Knowl. and Data Eng., 19(10):1333–1348, 2007.