Exclusive Meson Photoproduction with a Leading Neutron at HERA
Jan Olsson (on behalf of the H1 Collaboration)111E-mail: jan.olsson@desy.de
DESY, Hamburg, Germany
A first measurement is presented of exclusive photoproduction of mesons associated with leading neutrons at HERA. The data were taken with the H1 detector in the years and at a centre-of-mass energy of GeV and correspond to an integrated luminosity of pb-1. The mesons with transverse momenta GeV are reconstructed from their decays to charged pions, while leading neutrons carrying a large fraction of the incoming proton momentum, , are detected in the Forward Neutron Calorimeter. The phase space of the measurement is defined by the photon virtuality GeV2, the total energy of the photon-proton system GeV and the polar angle of the leading neutron mrad. The cross section of the reaction is measured as a function of several variables. The data are interpreted in terms of a double peripheral process, involving pion exchange at the proton vertex followed by elastic photoproduction of a meson on the virtual pion. In the framework of one-pion-exchange dominance the elastic cross section of photon-pion scattering, , is extracted. The value of this cross section indicates significant absorptive corrections for the exclusive reaction .
Presented at EDS Blois 2017, Prague,
Czech Republic, June 26-30, 2017
1 Introduction
At the collider HERA the study of forward production of protons and neutrons has long been a subject of interest. The term “forward” here implies that the produced particles have small polar angles with respect to the proton beam direction and carry a large fraction of the incoming proton longitudinal momentum. The measurement of these leading baryons, together with their associated final states, provide an important input to theoretical models for describing the strong interaction in non-perturbative regimes.
In the present report this long tradition is continued with a study of the exclusive photoproduction of mesons. This analysis has recently been published [1]; for more details than can be given here of the experimental apparatus, data and kinematic variables as well as of the analysis method, please see this paper.
The diagram of the reaction
| (1) |
is depicted in Fig. 1a. The virtual photon from the electron forms a virtual meson, which scatters elastically on a pion in the “proton cloud”, the final state contains a meson together with the scattered and the leading neutron. It is clear that a measurement of this reaction offers the possibility of measuring the exclusive elastic photoproduction of rho mesons off a pion target, an unstable particle. Such an experiment was suggested already in 1959 by G.F. Chew and P.E. Low.
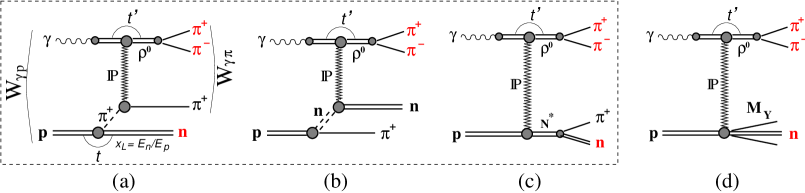
In the Regge formalism, this process, commonly known as a Double Peripheral Process (DPP)[2], is described by the exchange of two Regge trajectories. Thus, the proton dissociates into a neutron and a Regge , and the () system scatters elastically off the virtual meson, with the exchange of the Regge trajectory with vacuum quantum numbers, the “Pomeron”.
Double peripheral processes were in the past extensively studied at lower energies, in nucleon-nucleon and meson-nucleon scattering. The theoretical framework was the Drell-Hiida-Deck (DHD) model[3] and its generalisation. According to this model, also the diagrams in Figs. 1b and 1c have to be considered, as well as the interference between the three diagrams. The diagrams 1b and 1c, describing neutron exchange and direct pole respectively, contribute in the cross section with similar magnitude, however with opposite sign. In the phase space region considered in this analysis, with low transverse momentum of the produced leading neutron, the diagrams 1b and 1c largely cancel[4] and the One Pion Exchange[5] diagram of Fig. 1a dominates. Of the possible isovector exchanges (), the pion dominates and the OPE approximation is expected to give a good description of the process.
2 Analysis
The experimental signature of reaction (1) is the scattered neutron, as well as the decay products of the rho meson. The scattered is not detected, since it is produced at low transverse momentum and escapes in the beam tube. The scattered electron is also not detected (no tag experiment), which limits the range to (photoproduction regime at HERA, with GeV.
Background to the signal reaction (1) is given by the low mass dissociation of the proton (Fig.1d), as well as by reflections from the exclusive production of other vector mesons, in particular , and .
For the MC simulation of the OPE signal process (Fig 1a) the program POMPYT[6] is used. The background (Fig. 1d) is simulated using the program DIFFVM[7], which is also used for estimating possible background due to reflections from other exclusive vector meson production.
The data in this analysis were obtained using a special low bias trigger, based on the H1 Fast Track Trigger in connection with a neutron signal in the H1 FNC (Forward Neutron Calorimeter). The trigger was operated in downscale mode during the last two years of HERA operation, 2006-2007, and the data sample corresponds to an integrated luminosity of 1.16 pb-1.
| Event selection | Analysis PS | Measurement PS | |
| No in the detector | GeV2 | GeV2 | |
| GeV2 | |||
| tracks, net charge | |||
| GeV, , | GeV | GeV | |
| GeV | |||
| from cm | GeV | GeV2 | |
| GeV | GeV | ||
| LRG requirement | events | ||
| Neutron requirements | |||
| GeV | |||
| mrad | mrad | GeV | |
| events | events | events | |
| OPE dominated range | GeV | events | |
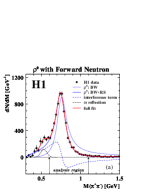
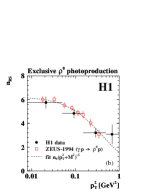
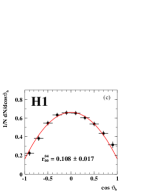
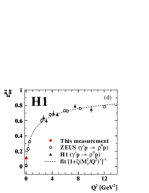
After all experimental cuts (see Table 1), events with two oppositely charged tracks and a leading neutron form the final data sample. The pi+pi- mass distribution is shown in Fig. 2a, together with curves of the Breit-Wigner fit, using the Ross-Stodolsky skewing model[8]. The Ross-Stodolsky parameter is shown in Fig. 2b as a function of the transverse momentum squared of the system. The measured value agrees with previous measurements of the ZEUS collaboration. Further corroboration of the signal is given by Fig. 2c, showing the helicity frame decay angle distribution, and Fig. 2d, showing the extracted spin-density matrix element . The present measurement is compared with previous measurements at HERA, at various values of .
The general conclusion from Fig. 2 is that the data sample shows the characteristics of photoproduction. The fraction of diffractive background (Fig. 1d) was determined to be .
The cross section of reaction (1), which is directly measured in this experiment, is related to the photoproduction cross section:
| (2) |
where the virtual photon flux is taken from the VDM[9]. The cross section can be written as a convolution of the cross section and the pion flux , using the OPE approximation:
| (3) |
describes the splitting of the proton. From the many existing models of the pion flux[10], the one of H. Holtmann et al. is used for the central value of . The use of other models indicates a 30% systematic error due to the uncertainty in the pion flux.
3 Results
Cross sections are measured in the analysis phase space, i.e. GeV2, GeV and mrad. The cross section, integrated over and GeV, is determined for two regimes of the leading neutron transverse momentum, resulting in the following average values over the range:
| (4) |
| (5) |
The second cross section, obtained for the stricter cut (OPE dominated regime), is used to extract the cross section:
| (6) |
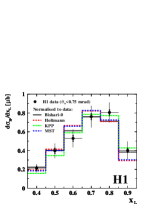
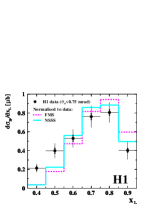
The differential cross section is shown in Fig. 3***An overall normalisation error of 4.4% is not included in this and the following figures.. Several models of the pion flux are compared to the data. As seen, two of the six models (FMS, NSSS) agree badly with the data and can be excluded, while the other show reasonable agreement.
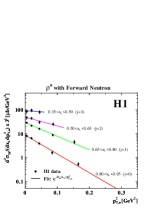
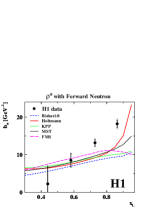
Sensitivity to the pion flux models is also visible in the (or ) dependence of the leading neutron. Fig. 4 (left) shows the double differential cross section . The bins are chosen such that the result is not influenced by the cut in neutron polar angle. The dependence of the slope , obtained from the fits of the single exponential function to the data, is also shown in Fig. 4 (right). None of the flux models fits the data. A possible explanation of this would be absorptive corrections which modify the dependence of the amplitude such that the effective slope increases for large values of , compared to the pure OPE model without absorption. The same slope dependence was observed by the ZEUS collaboration[11] in their study of inclusive DIS data with a leading neutron.
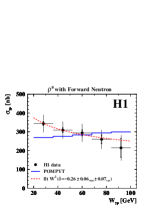
The measured dependence of is shown in Fig. 5 (left), together with the prediction from the POMPYT MC simulation. The measured cross section falls with increasing , in contrast to the POMPYT simulation, which is slowly increasing with energy, due to the pomeron exchange. Fitting the cross section with the Regge motivated function , one obtains .
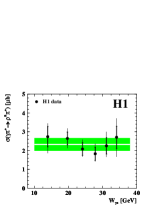
The dependence of , displayed in Fig. 5 (middle), does not show a clear tendency.
The value of , obtained at the average value GeV, can be compared to the corresponding cross section for , obtained at GeV†††This value is used to interpolate between the fixed target measurements and the HERA measurements.. The ratio of the measured elastic cross sections is . While the additive quark model would predict a value 2/3 for this ratio, more sophisticated considerations (using the optical theorem and eikonal approach, involving both , and cross sections) lead to the expectation . An explanation for the measured reduced ratio is the rescattering (absorptive corrections[12]), involved in the leading neutron production. For the reaction (1) studied here, an absorption factor is obtained.
For the total cross section at GeV‡‡‡Assuming a Regge dependence of and comparing with at GeV. the ZEUS collaboration[13] obtained the ratio .
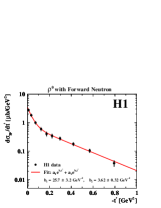
Finally, the distribution, i.e. the distribution of the momentum transfer squared of the meson, is measured. It is shown in Fig. 5 (right). There is a clear change in slope between the low-value and high-value ranges. The data are fitted with the sum of two exponential functions, , with the fit yielding the slope parameters and .
The large value of indicates that most of the production happens at large impact parameters, i.e. in the pion cloud extending well outside the classical proton radius (). In contrast, the small value of the second slope corresponds to a target size of fm.
The DPP interpretation predicts a cross section dependence on the () mass, resulting from interference of the 3 diagrams in Fig.1a-c[14]. Since the scattered is undetected in the present experiment, the invariant () mass and the dependence of the slope on this mass cannot be measured and a closer investigation is not possible.
ACKNOWLEDGEMENTS
Many thanks to all colleagues in H1, in particular to Sergey Levonian and to the late Iakov Vazdik, for providing the material in this report and for help given in its preparation. Warm thanks also to the EDS 2017 team for the excellent organisation and the pleasant atmosphere of the conference.
References
- [1] V.Andreev et al. [H1 Coll.], Eur.Phys.J.C76 (2010) 1,41 [arXiv:1603.05567].
-
[2]
N.F. Bali, G.F. Chew and A. Pignotti,
Phys. Rev. Lett. 19 (1967) 614;
G.F. Chew and A. Pignotti, Phys. Rev. 176 (1968) 2112;
E. L. Berger, Phys. Rev. 179 (1969) 1567. -
[3]
S. D. Drell and K. Hiida,
Phys. Rev. Lett. 7 (1961) 199;
R.T. Deck, Phys. Rev. Lett. 13 (1964) 169; L.A. Ponomarev, Sov. J. Part. Nucl. 7 (1976) 70. N.P. Zotov and V.A. Tsarev, Sov. J. Part. Nucl. 9 (1978) 266. - [4] V.A. Tsarev, Phys. Rev. D11 (1975) 1864; L.A. Ponomarev, in proceedings of the XVIII International Conference on High-Energy Physics, C76-07-15, Eds. N.N Bogolyubov et al., Tbilisi, USSR (1976) A1-24.
- [5] J. D. Sullivan, Phys. Rev. D5 (1972) 1732; V. Pelosi, Lett. Nuovo Cim. 4 (1972) 502; G. Levman and K. Furutani, DESY-95-142 (1995)
- [6] P. Bruni and G. Ingelman, in proceedings of the Europhysics Conference, C93-07-22, Eds. J. Carr and M. Perrottet., Marseille, France (1993) 595.
- [7] B. List and A. Mastroberardino, Proc. of the Workshop on MC Generators for HERA Physics, eds. A.T. Doyle et al., DESY-PROC-1999-02 (1999) 396.
- [8] M. Ross and L. Stodolsky, Phys. Rev. 149 (1966) 1172.
- [9] J. J. Sakurai, Annals Phys. 11 (1960) 1; J. J. Sakurai, Phys. Rev. Lett. 22 (1969) 981.
- [10] M. Bishari, Phys. Lett. B38 (1972) 510; H. Holtmann et al., Phys. Lett. B338 (1994) 363; H. Holtmann, A. Szczurek and J. Speth, Nucl. Phys. A596 (1996) 631; M. Przybycien, A. Szczurek and G. Ingelman, Z. Phys. C74 (1997) 509; B. Kopeliovich, B. Povh and I. Potashnikova, Z. Phys. C73 (1996) 125; W. Melnitchouk, J. Speth and A.W.Thomas, Phys. Rev. D59 (1999) 014033; L. Frankfurt, L. Mankiewicz and M. Strikman, Z. Phys. A334 (1989) 343; N.N. Nikolaev, W. Schäfer, A. Szczurek and J. Speth, Phys. Rev. D60 (1999) 014004.
- [11] S. Chekanov et al. [ZEUS Coll.], Nucl. Phys. B776 (2007) 1 [hep-ex/0702028].
- [12] N. Nikolaev, J. Speth and B.G. Zakharov, KFA-IKP-TH-1997-17, hep-ph/9708290; U. D’Alesio and H.J. Pirner, Eur. Phys. J. A7 (2000) 109 [hep-ph/9806321]; A.B. Kaidalov et al., Eur. Phys. J. C47 (2006) 385 [hep-ph/0602215]; B.Z. Kopeliovich et al., Phys. Rev. D85 (2012) 114025 [arXiv:1205.0067].
- [13] S. Chekanov et al. [ZEUS Coll.], Nucl. Phys. B637 3 (2002) 3 [hep-ex/0205076].
- [14] F. Hayot et al., Lett. Nuovo Cim. 18 (1977) 185. G. Cohen-Tannoudji, A. Santoro and M. Souza, Nucl. Phys. B125 (1977) 445.