AUDIOVISUAL ANALYTICS VOCABULARY AND ONTOLOGY (AAVO): INITIAL CORE AND EXAMPLE EXPANSION
Abstract
Visual Analytics might be defined as data mining assisted by interactive visual interfaces. The field has been receiving prominent consideration by researchers, developers and the industry. The literature, however, is complex because it involves multiple fields of knowledge and is considerably recent. In this article we describe an initial tentative organization of the knowledge in the field as an OWL ontology and a SKOS vocabulary. This effort might be useful in many ways that include conceptual considerations and software implementations. Within the results and discussions, we expose a core and an example expansion of the conceptualization, and incorporate design issues that enhance the expressive power of the abstraction.
Keywords: OWL, SKOS, Semantic web, Visual analytics, Data visualization
1. INTRODUCTION
Visual Analytics is often defined as data mining (or the science of analytical reasoning) facilitated by interactive visual interfaces (Wikipedia,, 2017; Ellis & Mansmann,, 2010). From this definition, one can grasp that at least three fields are directly related to visual analytics: data mining, human-computer interaction, and data visualization. Each one of these fields are inherently multidisciplinary and known to be considerably complex, with multiple theories and vast literature. Researchers entering into the field of visual analytics can easily find themselves confused with such a diverse material, possibly presented using terminology that is not necessarily consistent across the different fields.
This work reports an initial attempt of organizing the knowledge related to visual analytics as a SKOS vocabulary and an OWL ontology, i.e. a formalized conceptualization in terms of linked data recommended technologies. Such a formalization can have multiple uses, including:
-
•
Facilitating the introduction of the Visual Analytics subject to non-specialists.
-
•
Expressing a concise overview of the field.
-
•
Expressing a domain knowledge against which queries might be performed.
-
•
Relating objects (e.g. data and techniques) within the field or between the field and other domains.
-
•
Making inferences about the concepts and objects to which they are related.
In the present case, where the formalization is realized as linked data, the conceptualization allows the queries, inferences, relations, etc. to be performed also by machines. Therefore, a software might, for example, relate a dataset or analysis methods to specific visualization techniques, in order to assist a user designing a visualization, or for automated reporting.
2. METHODS
The methods described here are standard of the semantic web to achieve formalized conceptualizations. Thus, the next sections address the subjects very briefly. The interested reader should visit the vanilla literature, especially the W3C recommendations (W3C,, 2010; Heath & Bizer,, 2011).
2.1 The semantic web
The semantic web is constituted by data which is linked in the same way web pages are: through HTTP and URLs. W3C recommendations provide the main source of protocols and best practices for the field. The terms ‘linked data’ and ‘semantic web’ are most often used interchangeably. A distinction might arise in some contexts where one needs to refer to the (linked) data or the (semantic) web created by all or some portion of linked data, but, generally speaking, the terms are equivalent. The main topics of this article are data visualization (or visual analytics) and semantic web, and all the sections tackle the subject of the semantic web for it is the framework in which data visualization knowledge is represented.
2.2 RDF
The semantic web is built using the Resource Description Framework (RDF). The RDF data model is based on making statements in the form of triples (“subject-predicate-object”) and using Unique Resource Identifiers (URIs) for objects and concepts. It is also part of the framework to use URIs that are URLs whenever possible, to enable the data linkage. Accordingly, one can write:
<http://example.org/people/mary><http://example.org/properties/name> "Mary Shastacian" .<http://example.org/people/mary><http://example.org/properties/age> "57" .<http://example.org/people/mary><http://example.org/properties/likes> <http://example.org/concepts/Reading> .to express that there is a 57 year old person called Mary Shastacian who likes reading. There are many formats to write/serialize RDF data. The example above is written in Turtle, which will be the format used throughout this document.
In real settings, when everything is working as recommended,
each of these URIs (that are URLs!) might be accessed
through HTTP to reach more triples referring to the URI.
From the triples above, one would be able to access triples
describing each of the properties: example:properties/name, example:properties/age, and
example:properties/likes,
and the concept example:concepts/Reading.
In fact, the triples above would probably be available in the URI/URL:
example:people/mary.
An interesting working example111Visit http://dbpedia.org/page/Rhesus_macaque
and click on the concepts and properties to start browsing the web of linked data. is DBPedia (Lehmann et al.,, 2015).
The process of accessing a URI to find more triples is called dereferencing the URI (or simply dereferencing).
2.3 RDFS
The Resource Description Framework Schema (RDF Schema or simply RDFS) is a set of classes and properties for the RDF data model that allows basic descriptions of ontologies. It supports taxonomic relations (hypernymy, i.e. relations stating that a concept is more general than another), bindings of properties to objects and datatypes, and notes (label, comment, see also, is defined by).
2.4 SKOS
The Simple Knowledge Organization System (SKOS) is a data model for representing controlled vocabularies. SKOS is a W3C recommendation to facilitate publication and use of vocabularies and is built upon RDF and RDFS. It is itself a vocabulary for concepts, notation, documentation, semantic and mapping relations, and collections.
2.5 OWL
The Web Ontology Language (OWL) is a language for publishing ontologies on the web. While RDFS holds basic relations necessary even for very rudimentary organization knowledge and data, OWL is complex and allows one to formalize elaborate conceptualizations. Using OWL, an ontology might have properties that are required to satisfy a number or axioms, and classes that obey restrictions or e.g. are the result of the union of other classes.
2.6 Interviews with specialists and literature consultation
The standard approach to design an ontology, according to the literature, is to interview specialists of the field to which the ontology is related, or to absorb the established literature, or both. This work is being developed using both approaches. The second author is a data visualization specialist who was interviewed by the first author. Also, the first author is engaged in acquiring a deeper knowledge of the field.
3. RESULTS AND DISCUSSION
Using the framework exposed in the previous section, we elaborated an initial vocabulary and ontology for visual analytics: the AAVO (Audiovisual Analytics Vocabulary and Ontology). The inclusion of “audio” is both a reminder of the possibilities available for using audio to represent data and perceive patterns, and a desirable incorporation of audio to visual analytics given audiovisual capabilities of current ordinary computers.
The main concepts and their interrelations are presented in Section 3.1 while an example extension is on Section 3.2. Section 3.3 holds annotations for the vocabulary which are not promptly given by the previous sections. Some of the relations bellow are expressed using very recent techniques described in Fabbri, (2017). Their meaning, though, might be easily inferred.
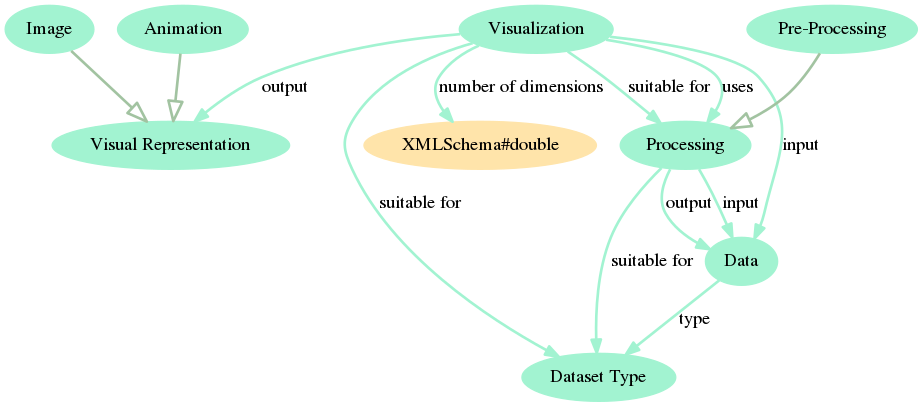
3.1 AAVO core
The core of AAVO is designed to be minimal and hold the following concepts as depicted in Figure 1:
-
•
Visualization: a technique to generate a Visual Representation from Data.
-
•
Visual Representation: a representation of Data by visual cues. A Visual Representation can be an Image or an Animation.
-
•
Data: a set of values, be them qualitative or quantitative (Wikipedia,, 2017).
-
•
Dataset Type: a type of organization and meaning of data (Munzner,, 2014).
-
•
Processing: transforms Data into Data. Pre-processing is a kind of Processing.
We envision that there should be at least the following concepts in AAVO core when it reaches maturity:
-
•
Hypothesis: a proposed explanation for a phenomenon that might be 1) given beforehand and amenable to being proved or refuted by an Analysis, 2) shared by means of an Analysis, or 3) presented by means of a Visualization.
-
•
Analysis: a set of procedures used to gain understanding about Data or a phenomenon.
-
•
Task/Purpose/Application: the goal or objective of an Analysis.
These concepts have not yet been included in AAVO core (e.g. Figure 1) because we are still considering the best way to do so. From the definitions above, the question arises: should we also include Phenomenon among these core concepts?
Other relations that can be added to the core (or to an extension, but are directly related to the core):
-
•
Visualization is a type of Processing.
-
•
Visual Representation is a Dataset Type.
-
•
Processing “suitable for” Data.
-
•
Visualization “number of dimensions” real (not double as stated for now).
An example of question still left unanswered: a Visualization only outputs Visual Representation or can it output other Data(set Type)? This and many other questions might have a resolution that are genuinely dependent on the conceptual design of the ontology.
3.2 AAVO example expansion
There are many ways in which the AAVO core might be expanded. Figure 2 is an example expansion. Concepts were added which are hyponyms to Dataset Type (Temporal Series, Relational Data), to Pre-Processing (Z-Score, Cleaning), Processing (MDS, Statistical Test) and Visualization (Heat Map, Histogram, Scatter Plot, Timeline). Some examples of further subclasses are also added. A different kind of expansion was achieved by including (Data) Availability and the less general concepts of Dynamic Availability and Static Availability. A Graph is regarded as a bare Network without any context or further attributes beyond nodes and edges.
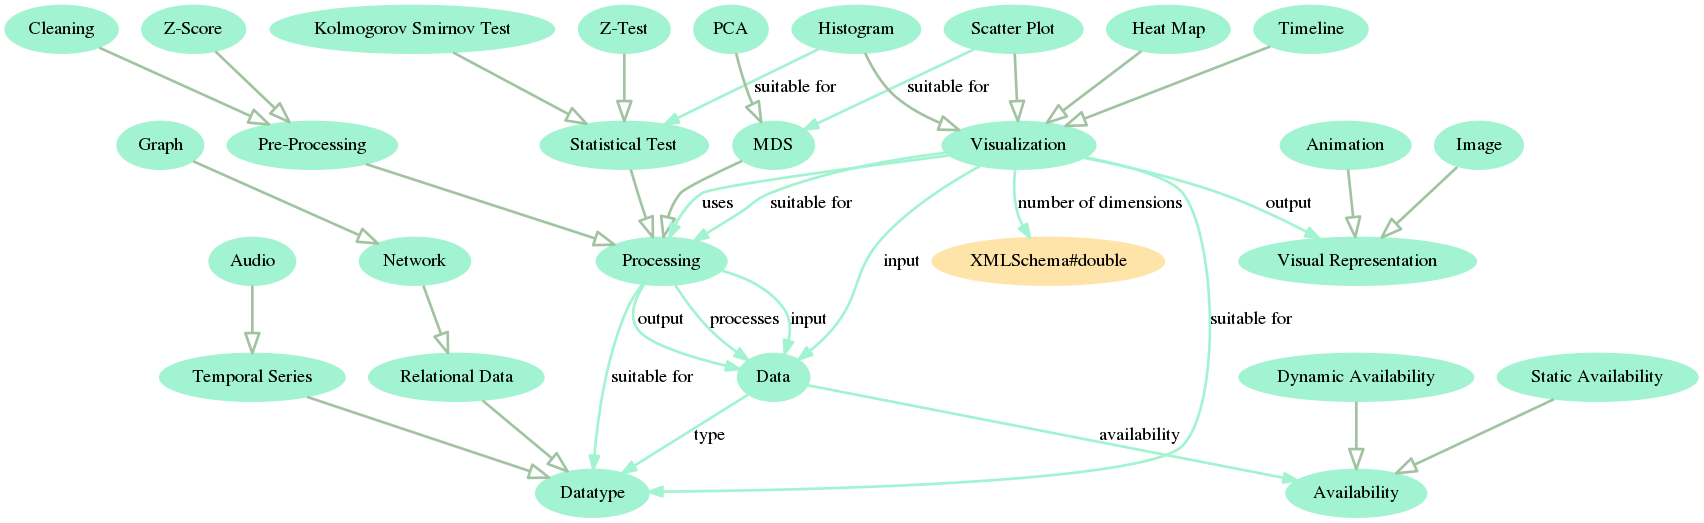
Ideally, AAVO expansions should reach related fields, such as HCI, by linking to other existing ontologies (such as DBPedia) or incorporating enough concepts to then bind and rely in third party conceptualizations.
3.3 Vocabulary annotations
Beyond what is made explicit in the previous sections, there are some aspects of the knowledge and language that are to be directly added to the SKOS vocabulary. Examples:
-
•
in a dataset, an element is also called: an item, an observation, an individual, a point, and even a data point and a data row.
-
•
A graph node is also called: a vertex, and every name that are used to designate an element.
-
•
A graph edge is also called: a link, a bond, a line, and a connection.
-
•
Z-scores are also called: standard scores, normal scores, standardized variables, and z-values.
4. CONCLUSIONS AND FURTHER WORK
This initial formalized conceptualization of the AAVO holds some relations which are not explicitly described by current literature mainly because of the purposes: 1) of reaching a sound conceptualization that allows a formalization as linked data; 2) of representing the knowledge in Visual Analytics to enable inference by machines. There are other uses for AAVO, uncovered in Section 1, for which conceptual models are available (Munzner,, 2014; Ward et al.,, 2010).
Potential further steps include:
-
•
the inclusion of the concepts Hypothesis, Analysis, and Task into the AAVO core.
-
•
Realizing AAVO expansions until the reached concepts can be linked to other ontologies that are sound, used and maintained.
-
•
Using AAVO to obtain interesting relations by means of automated inference and to assist a (audio)visual analytics software.
Acknowledgements
The authors thank FAPESP (project 2017/05838-3) for the funding received while researching the topic of this article, the researchers of IFSC/USP and ICMC/USP for the recurrent collaboration in every situation where we needed directions for investigation.
References
- Fabbri, (2017) Fabbri, R. (2017). Enhancements of linked data expressiveness for ontologies. Encontro Nacional de Modelagem Computacional 2017 (XX ENMC). From https://github.com/ttm/ontologyEnhancements/raw/master/article.pdf
- Heath & Bizer, (2011) Heath, T. & Bizer, C. (2011). Linked Data: Evolving the Web into a Global Data Space (1st edition). Synthesis Lectures on the Semantic Web: Theory and Technology, 1:1, 1-136. Morgan & Claypool.
- Lehmann et al., (2015) Lehmann, J., Isele, R., Jakob, M., Jentzsch, A., Kontokostas, D., Mendes, P. N., … & Bizer, C. (2015). DBpedia–a large-scale, multilingual knowledge base extracted from Wikipedia. Semantic Web, 6(2), 167-195.
- Munzner, (2014) Munzner, T. (2014). Visualization analysis and design. CRC press.
- W3C, (2010) W3C (2017). LINKED DATA CURRENT STATUS, from https://www.w3.org/standards/techs/linkeddata
- Ward et al., (2010) Ward, M. O., Grinstein, G., & Keim, D. (2010). Interactive data visualization: foundations, techniques, and applications. CRC Press.
- Wikipedia, (2017) Data. (2017, August 21). In Wikipedia, The Free Encyclopedia. Retrieved 22:31, August 21, 2017 , from https://en.wikipedia.org/w/index.php?title=Data&oldid=796493851
- Wikipedia, (2017) Visual analytics. (2017, July 1). In Wikipedia, The Free Encyclopedia. Retrieved 14:51, August 29, 2017 , from https://en.wikipedia.org/w/index.php?title=Visual_analytics&oldid=788453746
- Ellis & Mansmann, (2010) Ellis, G., & Mansmann, F. (2010). Mastering the information age solving problems with visual analytics. In Eurographics (Vol. 2, p. 5).