Morpho-kinematic properties of field S0 bulges in the CALIFA survey
Abstract
We study a sample of 28 S0 galaxies extracted from the integral-field spectroscopic (IFS) survey CALIFA. We combine an accurate two-dimensional (2D) multi-component photometric decomposition with the IFS kinematic properties of their bulges to understand their formation scenario. Our final sample is representative of S0s with high stellar masses (). They lay mainly on the red sequence and live in relatively isolated environments similar to that of the field and loose groups.
We use our 2D photometric decomposition to define the size and photometric properties of the bulges, as well as their location within the galaxies. We perform mock spectroscopic simulations mimicking our observed galaxies to quantify the impact of the underlying disc on our bulge kinematic measurements ( and ). We compare our bulge corrected kinematic measurements with the results from Schwarzschild dynamical modelling. The good agreement confirms the robustness of our results and allows us to use bulge deprojected values of and . We find that the photometric ( and ) and kinematic ( and ) properties of our field S0 bulges are not correlated. We demonstrate that this morpho-kinematic decoupling is intrinsic to the bulges and it is not due to projection effects.
We conclude that photometric diagnostics to separate different types of bulges (disc-like vs classical) might not be useful for S0 galaxies. The morpho-kinematics properties of S0 bulges derived in this paper suggest that they are mainly formed by dissipational processes happening at high redshift, but dedicated high-resolution simulations are necessary to better identify their origin.
keywords:
galaxies: bulges - galaxies: evolution - galaxies: formation - galaxies: kinematics and dynamics - galaxies: structure - galaxies: photometry1 Introduction
The Hubble tuning fork diagram (Hubble, 1936) has provided for decades the benchmark to study galaxy evolution. In recent years, the Hubble diagram has been revisited a number of times in order to accommodate new photometric and kinematic properties of the galaxies (Cappellari et al., 2011; Kormendy & Bender, 2012). Most of the proposed modifications affect the position of lenticular galaxies (S0s) in the diagram. S0 galaxies were initially placed at the intersection between ellipticals and spirals, implying that they formed a homogeneous class of galaxies. Since the early works by van den Bergh (1976) this homogeneity has been discarded, but only now it is commonly accepted that they encompass a complete family of galaxies representing a distinct branch of the Hubble diagram. Therefore, understanding the origin of lenticular galaxies and whether they are related to spiral or elliptical galaxies is still a challenge for contemporary astrophysics (see Aguerri, 2012, for a review).
The bulge prominence, or relative size with respect to the galaxy, has been one of the primary features used to classify galaxies in different Hubble types. However, defining what a bulge is not straightforward. Historically, a bulge was defined as a bright central concentration due to stellar light with relatively few features due to dust and star formation (Hubble, 1936). This morphological definition was extensively used to produce a variety of visual classification schemes for galaxies (see Buta, 2013, and references therein). With the advent of photometric decompositions, a more quantitative definition naturally arose. This photometric definition considers the bulge as the extra light in the central region of the disc, above the inwards extrapolation of an exponential disc (Freeman, 1970). Nowadays, the photometric definition of a bulge is widely used, and it has been generalised to the central bright structure, usually described with a Sérsic profile (Sérsic, 1968), prevailing amongst other structures such as discs, bars, lenses, etc, in multi-component photometric decompositions (Gadotti, 2009; Laurikainen et al., 2010; Méndez-Abreu et al., 2014). Throughout this paper we use the photometric definition of a bulge in order to compare with the literature.
The structure of S0 galaxies is an example of their complexity. Despite initially being classified as systems with only a bulge dominating the light at the galaxy centre and an outer disc without indication of spiral arms, recent works have provided a wealth of evidence for multiple structures: bars, lenses, rings, etc (e.g., Laurikainen et al., 2013). Still, the bulge prominence, usually characterised by its luminosity ratio with respect to the whole galaxy light (), is considered the main parameter to morphologically classify different S0 galaxies (i.e., Kormendy & Bender, 2012). There is ample observational evidence that bulges in S0 galaxies cover a wide range of physical properties such as , Sérsic index (), rotational support, and even stellar populations. This supports a scenario were different types of bulges can be present at the centre of S0 galaxies (de Lorenzo-Cáceres et al., 2012; Méndez-Abreu et al., 2014; Erwin et al., 2015).
The current observational picture of galactic bulges divides these systems into two broad classes: classical and disc-like bulges (Kormendy & Kennicutt, 2004; Athanassoula, 2005). An updated list of the observational criteria to separate both types of bulges is given in Fisher & Drory (2016). In short, disc-like bulges are usually oblate ellipsoids (Méndez-Abreu et al., 2010a) with apparent flattening similar to their outer discs, with surface-brightness distributions well fitted with a Sérsic profile of index (Fisher & Drory, 2008), and . Their kinematics are dominated by rotation in diagrams such as the vs (Kormendy & Kennicutt, 2004) and thus they are also low- outliers of the Faber-Jackson relation (Faber & Jackson, 1976). Disc-like bulges are also usually dominated by young stars, with the presence of gas and possible recent star formation (Fisher & Drory, 2016). On the other hand, classical bulges are thought to follow surface-brightness distributions with a Sérsic index and , they appear rounder than their associated discs, and their stellar kinematics are dominated by random motions that generally satisfy the fundamental plane (FP) correlation (Bender et al., 1992; Falcón-Barroso et al., 2002; Aguerri et al., 2005). The stellar populations of classical bulges show similarities with those of ellipticals of the same mass. In general, they are old and metal-rich with a short formation timescale (see Sánchez-Blázquez, 2016, for a review on their stellar populations). Nevertheless, this dichotomy of the observed properties is still controversial since recent studies claim the different properties of bulges can be just driven by the bulge mass (Costantin et al., 2017).
Different formation scenarios have been proposed to explain the observational differences between classical and disc-like bulges. The former can be created via dissipative collapse of protogalactic gas clouds (Eggen et al., 1962) or by the coalescence of giant clumps in primordial discs (Noguchi, 1999; Bournaud et al., 2007). Moreover, they could also grow out of disc material externally triggered by satellite accretion during minor merging events (Aguerri et al., 2001; Eliche-Moral et al., 2006) or by galaxy mergers (Kauffmann, 1996) with different merger histories (Hopkins et al., 2009). Disc-like bulges are thought to be the products of secular processes driven by bars (Kormendy & Kennicutt, 2004). Bars are ubiquitous in disc galaxies (e.g., Eskridge et al., 2000; Aguerri et al., 2009). They are efficient mechanisms for driving gas inward to the galactic centre triggering central star formation generally associated with disc-like bulges. Nevertheless, Eliche-Moral et al. (2011) have recently proposed that disc-like bulges might also be created by the secular accretion of low-density satellites into the main galaxy, thus providing an alternative to the bar-driven growth of disc-like bulges. Understanding the nature of bulges of S0s in the nearby Universe would set important constraints on models of S0 formation and evolution.
The non-homogeneity of the S0 family of galaxies has also raised a number of new formation theories to explain their variety of properties. One of the most commonly proposed formation scenarios for S0 galaxies suggests that they are descendants from spiral galaxies that happen to quench their star formation (Bekki & Couch, 2011). The mechanism responsible for this transformation has to stop the star formation in the disc and enhance the spheroidal component. Several physical processes have been invoked to produce these two effects, most of them directly related to the presence of the galaxy in a high-density environment. To enhance the spheroidal component, the harassment scenario proposes that the cumulative effects of fast tidal encounters between galaxies and with the cluster gravitational potential can produce dramatic morphological transformations in galaxies (Bekki, 1998; Moore et al., 1998, 1999; Governato et al., 2009). Galaxy harassment in clusters (Moore et al., 1996) is able to remove a large amount of mass from both the disc and halo, but not from the bulge where the stars are more gravitational bound (Aguerri & González-García, 2009). Stopping the star formation of the disc involves either the direct stripping of cold gas from the disc of the galaxy (e.g., ram pressure, Gunn & Gott, 1972; Quilis et al., 2000), or the removal of its hot halo gas reservoir over a long period of strangulation (Larson et al., 1980; Balogh et al., 2000). These mechanisms act preferentially on gas, causing little or no disruption to the galaxy’s stellar disc, but they need different time scales.
Interestingly, S0 galaxies are found in all environments, from high-density clusters to the field, allowing for a variety of evolutionary paths that are not related with high-density environments (Wilman et al., 2009; Bekki & Couch, 2011). Galaxy mergers are one of the most widely studied mechanisms which show the potential to form S0s. Recently, Querejeta et al. (2015) used the Calar Alto Legacy Integral Field Area survey (CALIFA, Sánchez et al., 2012) data to prove that the stellar angular momentum and concentration of late-type spiral galaxies are incompatible with those of S0s, therefore suggesting a merger origin for S0 galaxies. However, stellar discs of galaxies are typically disrupted by these processes, requiring specific environmental conditions for disc survival (Hopkins et al., 2009) or a long period of disc regrowth from the surrounding gas (Kannappan et al., 2009). In the merger paradigm, the central bulge of disc galaxies forms prior to the disc as a result of early merging. Despite this inside-out formation scenario is compatible with recent observations (González Delgado et al., 2015), the amount of gas available in the progenitor galaxies has been shown to be a clue for the bulge evolution, with dissipative processes driving the consequent bulge growth rather than the redistribution of stars (see Brooks & Christensen, 2016, and references therein). At lower redshift, minor mergers might have a higher incidence in galaxy evolution than major ones. The final remnant disc is usually compatible with that of S0 galaxies, and multiple merging with small satellites can produce bulge growth mimicking the properties of S0s (Aguerri et al., 2001; Eliche-Moral et al., 2006). Galaxy fading can also occur through internal secular processes. One of the internal processes that could regulate the star formation in galaxies is feedback processes, due to supernovae or active galactic nuclei (AGN), heating the cold gas in galaxies and stopping their star formation. This process would transform early-type spiral galaxies located in the blue cloud into galaxies located close to or in the red sequence (Schawinski et al., 2006). These transformed early-type galaxies could be the progenitors of later S0 galaxies.
In this paper, we have studied the photometric and kinematic properties of a well defined sample of 28 S0 galaxies extracted from the CALIFA survey (Sánchez et al., 2012). The accurate photometric decomposition carried out by Méndez-Abreu et al. (2017) using the and bands provided by the Sloan Digital Sky Survey (SDSS) combined with the high quality integral field spectroscopy (IFS) obtained from CALIFA have allowed us to characterise these bulges to an unprecedented level of detail. Our main emphasis is to characterise the morpho-kinematics properties of S0 bulges to shed light on their possible formation scenarios.
The careful selection of a sample of bona-fide lenticular galaxies is key in this work. Therefore, we have developed a detailed methodology that allows us to deal with the well-known difficulties of separating early-type galaxies into ellipticals and lenticulars using only photometric data. Our final aim is to find a sample of galaxies that can be photometrically well described by, at least, a two-component model (bulge and disc) in the canonical way. These galaxies have therefore an inner photometric bulge that dominates only the central parts of the surface brightness distribution and a disc dominating the light in the galaxy outskirts. Further structural components such as bars or truncated outer profiles, not expected in elliptical galaxies, are also signatures of a photometric lenticular galaxy. The process described in this paper implies that some lenticular galaxies will be erroneously removed from the analysis, but we prefer to work with a safe and well-defined sample of photometric S0 galaxies.
The paper is organized as follows: Sect. 2 describes the initial sample of early-type galaxies used in this work. Sect. 3 details the analysis of the early-type galaxies surface-brightness distribution. In particular, Sect. 3.3 presents the methodology followed to separate elliptical and lenticular galaxies from our initial early-type galaxy sample. This analysis will be used for the final selection of photometrically defined lenticular galaxies and their structural analysis. Sect. 4 describes the general properties of our bona-fide sample of lenticular galaxies. The kinematic measurements using the CALIFA database, as well as the correction due to disc contamination, are described in Sect. 5. Sect. 6 presents the main results of this paper that will be discussed in the context of bulge formation in Sect. 7. The conclusions are given in Sect. 8. Throughout the paper we assume a flat cosmology with = 0.3, = 0.7, and a Hubble constant = 70 km s-1 Mpc-1.
2 CALIFA sample of early-type galaxies
This work is based on the observations taken as part of the CALIFA survey (Sánchez et al., 2012). The CALIFA final data release (DR3, Sánchez et al., 2016) is composed by two different set of galaxies: i) galaxies extracted from the CALIFA mother sample and the CALIFA extended sample. The former was drawn from the Sloan Digital Sky Survey Data Release 7 (SDSS-DR7) photometric catalogue (Abazajian et al., 2009). It is composed by 939 galaxies with angular isophotal diameter arcsec in band and within a redshift range . The detailed properties of the mother sample are extensively discussed in Walcher et al. (2014). The extended sample is a compendium of galaxies observed with the same CALIFA setup as ancillary science projects. As part of the CALIFA sample characterisation, every galaxy in both samples was visually classified into its corresponding Hubble type independently by five members of the collaboration. The initial sample of early-type galaxies used in this paper was based on the mean value of the morphological type derived in this classification (see Walcher et al., 2014, for details). In particular, we selected only those galaxies with Hubble type ranging from ellipticals to S0 galaxies.
The CALIFA observational strategy includes observing every galaxy using two different setups. The V500 grating has a nominal resolution of = 850 at 5000Å and covers from 3745Å to 7300Å . This grating is particularly suitable for stellar population studies and it has been extensively used within the CALIFA collaboration (i.e., Pérez et al., 2013; Cid Fernandes et al., 2013; González Delgado et al., 2014b, a; Sánchez-Blázquez et al., 2014; Martín-Navarro et al., 2015; González Delgado et al., 2015, 2016; Sánchez et al., 2016) and for studies of the physical properties of the ionized gas (i.e., Kehrig et al., 2012; Marino et al., 2013; Singh et al., 2013; Sánchez et al., 2013; Papaderos et al., 2013; Sánchez et al., 2014; Galbany et al., 2014; Wild et al., 2014; Sánchez et al., 2015; García-Lorenzo et al., 2015; Barrera-Ballesteros et al., 2015; Holmes et al., 2015; Catalán-Torrecilla et al., 2015; Marino et al., 2016; Sánchez-Menguiano et al., 2016). The second setup is based on the V1200 grating with better spectral resolution = 1650 at 4500Å . This grating covers from 3400Å to 4750Å and is perfectly suited to kinematic studies using stellar absorption features (examples of its use within the CALIFA collaboration includes Barrera-Ballesteros et al., 2014; Aguerri et al., 2015). In this work, we are interested in the kinematic properties of the bulges in S0 galaxies, therefore our initial sample is constrained to those galaxies observed with the V1200 grating. After removing those systems undergoing an interaction, with strongly disturbed morphologies, or highly inclined, we end up with an initial sample of 81 early-type galaxies. The photometric properties of these galaxies were analysed in detail in Méndez-Abreu et al. (2017).
3 Surface photometry and S0 selection
The accurate analysis of the surface-brightness distribution (SBD) of our S0 galaxies is a critical step in our study. First, it is used to properly define a sample of bona-fide photometric S0 galaxies (Sect. 3.3); second, the bulge size provides the galaxy region from which the stellar kinematics are extracted (Sect. 5.2); and finally, the structural parameters, combined with the galaxy kinematics, are used to constrain the formation scenarios of S0 galaxies (Sect. 7).
The CALIFA DR3 sample is based on the SDSS-DR7 database and therefore high-quality, homogeneous, and multi-wavelength imaging of the galaxy sample is assured. We used the imaging frames in the -, -, and -bands provided in the SDSS-DR7 to perform our surface brightness analysis (see Méndez-Abreu et al., 2017). These images are pre-reduced but they still contain information about the local sky background. To guarantee an accurate analysis, we used our own procedures to remove the sky background instead of using the tabulated values in the SDSS-DR7 database (Sect. 3.1).
3.1 SDSS images sky subtraction
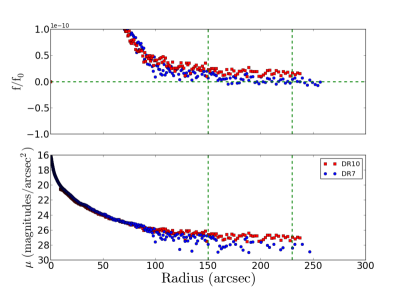
Although SDSS-DR7 provides a measurement of the sky level (as the median value of every pixel after a sigma-clipping is applied), this estimate has proven insufficient, specially to study the faintest parts of spiral galaxies (Pohlen & Trujillo, 2006). Therefore, we apply our own sky subtraction procedure to the SDSS-DR7 fully calibrated frames. We automatically mask out foreground stars in every frame using the code SOURCE EXTRACTOR (SExtractor, Bertin & Arnouts, 1996) as well as visually-inspect and manually-mask small features that SExtractor might have missed. This mask will also be provided as input to the 2D photometric decomposition algorithm at a later stage (see Sect. 3.2). We follow the sky subtraction procedure proposed by Pohlen & Trujillo (2006): first, we use the ellipse IRAF111IRAF is distributed by the National Optical Astronomy Observatory, which is operated by the Association of Universities for Research in Astronomy (AURA) under cooperative agreement with the National Science Foundation. task to obtain the one dimensional (1D) surface-brightness profile using a fixed ellipticity () and position angle () matching the disc outermost isophotes. Figure 1 shows an example of this methodology where is the zero-point count rate necessary to calibrate the SDSS data222Check http://www.sdss2.org/dr7/algorithms/fluxcal.html and https://www.sdss3.org/dr10/algorithms/magnitudes.php for further information.. We compute the sky level by averaging such distribution in a region with no influence from either the studied galaxy or other distant sources, where a flat radial count profile is displayed (region between vertical lines in Figure 1). Then, the obtained value is subtracted from each science frame.
To test the accuracy of this sky subtraction procedure, we compared with the SDSS-DR10 data release (Ahn et al., 2014) that provides sky subtracted and fully calibrated frames. In Figure 1, we compare the surface-brightness profiles and the band profiles for an example galaxy (NGC 0001) using both approaches, i.e., our sky subtraction scheme and the automated procedure performed by the SDSS-DR10 pipeline. In an ideal scenario, the value of should be 0. With our sky subtraction procedure we improve the sky level determination by a factor of 60 in the case of the band (54.1 for band and 53.8 for band), allowing us to reach 1 magnitude deeper (see Figure 1).
Using the sky-subtracted images, we run ellipse again allowing the isophotes to change the values of and to detect changes in the morphology. These , , and 1D surface-brightness profiles along with the previously created masks are then provided to the 2D photometric decomposition.
3.2 Photometric decomposition
The structural parameters of the galaxy sample were taken from the two-dimensional (2D) photometric decomposition described in Méndez-Abreu et al. (2017). To this aim, we applied the GASP2D algorithm described in Méndez-Abreu et al. (2008) and Méndez-Abreu et al. (2014). We refer the reader to these papers for details about the actual implementation of the code. In the following we will only describe the specific developments introduced in this work.
The galaxy SBD is assumed to be the sum of multiple photometric structures (i.e., bulge, disc, or bar component) depending on its specific morphology. The inclusion of the bar SBD in the photometric decomposition has been proved to be critical in order to recover accurate bulge parameters (e.g., Aguerri et al., 2005; Laurikainen et al., 2005). Several studies have shown that both the Sérsic index () and the bulge-to-total luminosity ratio () can artificially increase if the bar is not properly accounted for in the fit (Gadotti, 2008; Salo et al., 2015). In addition, we allowed the disc component to depart from its purely exponential profile in the outer regions (Erwin et al., 2005; Pohlen & Trujillo, 2006). Nowadays, it is commonly accepted that galaxy discs can be classified into three general categories: (i) Type I profiles that follow a single exponential profile along all the optical extension of the galaxy, (ii) Type II profiles that present a double exponential law with a down-bending beyond the so-called break radius, and (iii) Type III profiles that exhibit an up-bending in the outer parts of the disc.
To account for these possibilities we adopted the following functional parameterisation of the disc component
| (1) |
where
| (2) |
and is the radius measured in the Cartesian coordinates describing the reference system of the disc. , , , and are the central surface brightness, inner scale-length, outer scale-length, and break radius of the disc, respectively.
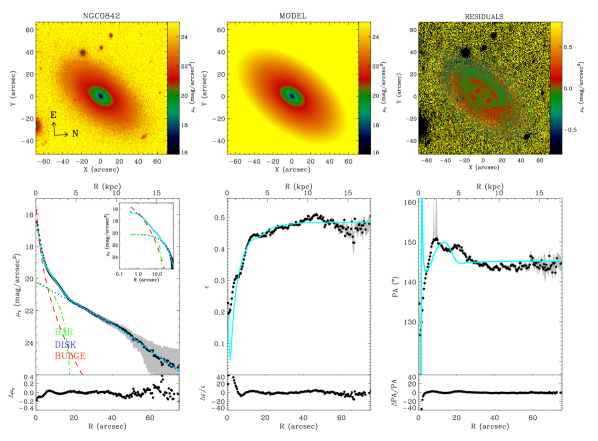
Figure 2 shows an example of the photometric fit used to separate the stellar structures present in NGC 0842. Upper panels show the 2D SBD for the galaxy, model, and residuals, and the lower panels represent the 1D radial profiles of the surface brightness, ellipticity, and position angle. In this particular case, the best fit is achieved using a three component model with a bulge, a bar, and a Type II disc. The photometric bulge, described by a Sérsic profile, is shown with a red dashed line.
The errors on individual parameters have been computed using extensive Monte Carlo simulations. Mock galaxies were generated with a variety of SBD combinations to estimate reliable uncertainties. Further details are presented in Méndez-Abreu et al. (2017) where the photometric decomposition of the entire CALIFA sample is described.
Tables LABEL:tab:decompbulge, LABEL:tab:decompdisc, and LABEL:tab:decompbar show the structural parameters derived for our final sample of bona-fide lenticular galaxies described in Sect. 3.3. The surface-brightness of the different components has been corrected for both inclination using the disc axis ratio and Galactic extinction (Schlegel et al., 1998). No internal dust correction has been attempted.
3.3 S0 vs E separation based on the photometric decomposition
The initial sample of 81 early-type (ellipticals and lenticulars) galaxies selected from the CALIFA sample, and described in Sect. 2, represents the outcome of a visual classification. Despite its undeniable importance, in this work we aim to provide an accurate quantitative description of the photometric bulges in S0 galaxies. Spiral and early-type galaxies are relatively easy to separate based only on a visual classification, however, a more thorough analysis, based on quantitative photometric decompositions is needed to isolate the different galaxy components in early-type galaxies and to distinguish between S0 and elliptical galaxies. The problem of model selection, i.e., of selecting the most appropriate model that represents your data among a set of possibilities, is a well-studied topic in statistics (i.e., MacKay, 2003). In astronomy, a clear example is provided by the well-known difficulties in separating ellipticals from S0s using only photometric information. We develop our own procedure to approach this problem based exclusively on the photometric properties of the galaxies. The final aim was to obtain a bona-fide sample of S0 galaxies defined in the canonical way, i.e., composed of a photometric bulge dominating the central galaxy regions and an outer disc dominating the light in the galaxy outskirts.
The process depicted in this section was applied to the 81 galaxies visually classified as either elliptical or S0, and it is based on two steps: i) a logical filtering and ii) a statistical criteria to select the best model.
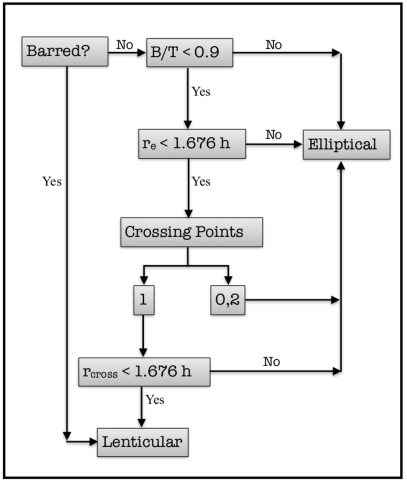
We assume that elliptical galaxies are photometrically well described by a single component with a Sérsic profile. The simplest description of a S0 galaxy consists of a two-component model, i.e., a Sérsic profile describing the SBD of the bulge and a single exponential representing the outer disc. The appropriateness of the two-component model to describe the SBD of our visually classified elliptical and S0 galaxies was evaluated through a logical filter (e.g., Allen et al., 2006). The idea behind this step is to provide the best mathematical fit with a physical meaning. The logical filter used in this paper is shown in Figure 3. It is worth noting that most of the conditions are set to assure that the final two-component fit is reliable and follow the canonical view of S0 galaxies, i.e., an inner dominant bulge with an outer disc. The filter will discard intermediate cases with embedded discs in larger elliptical galaxies.
Those galaxies accepted by the logical filtering as possibly hosting two components, i.e., lenticulars, are then compared to the single Sérsic fit of the whole galaxy using the Bayesian Information Criterion (; Schwarz, 1978). This model selection criterium adds a penalization to the standard accounting for the number of free parameters included in the fit. Thus, this parameter can be applied to determine whether or not adding an extra component (i.e., an outer disc) would statistically improve the best fit. Under the hypothesis of normal errors the statistic can be written as
| (3) |
where is the number of free parameters and is the number of independent data points. Since in a galaxy image not all the pixels are independent, we followed the prescriptions of Simard et al. (2011) and substitute the number of pixels by the number of resolution elements where is the size area of the Point Spread Function (PSF) at Full Width Half Maximum (FWHM). Then Eq. 3 can be rewritten as
| (4) |
Figure 4 (left panels) shows the values of , i.e., (Sérsic) - (Sérsic+Exp), for our visually classified sample of ellipticals and lenticular galaxies that passed the logical filter. In this scheme, models with lower values of are considered the preferred models. Then, would imply that single component Sérsic models are preferred against two components Sérsic + Exponential. Visually classified elliptical galaxies are in good agreement with this model selection criterium except for 4 galaxies (8%). However, visually classified lenticular galaxies span a wider range of values. The actual line of demarcation for strong evidence against one of the models is however not clear. Some studies have proposed a value of as division for a very strong preference against higher models (Kass & Raftery, 1995), but in complex cases such as the one presented here a calibration of the parameter using mock galaxy simulations is preferred.


Mock galaxies were created as in Sect. 3.2 (photometric error computation) and therefore they provide a good representation of the real galaxies with the same observational SDSS setup. We used a sample of 250 single Sérsic component galaxies and 350 two component Sérsic + Exponential galaxies. Both samples were fitted again as if they were real galaxies using both a single Sérsic component and a two component Sérsic + Exponential model, and the statistics was computed as for real galaxies. Figure 4 (right panels) shows the results obtained for the simulated mock galaxies. As for real galaxies, mock elliptical galaxies show a narrow distribution of the statistics with all galaxies showing . The distribution of lenticular galaxies is also similar to the real galaxies, strongly overlapping with the region defined by ellipticals. These results highlight the intrinsic difficulties of separating ellipticals from S0 galaxies using photometric data, but it also provides us with a method to define bona-fide S0 galaxies as those with , since no ellipticals lie in this range of values. It is worth noting that another model selection statistics such as the Akaike Information Criteria (; Akaike, 1974) was also used in this study obtaining similar results. Nevertheless, the penalizes the number of parameters less strongly than the does and therefore we restrict our further analysis to the selected sample to minimise the number of false-positive detections due to overfitting.
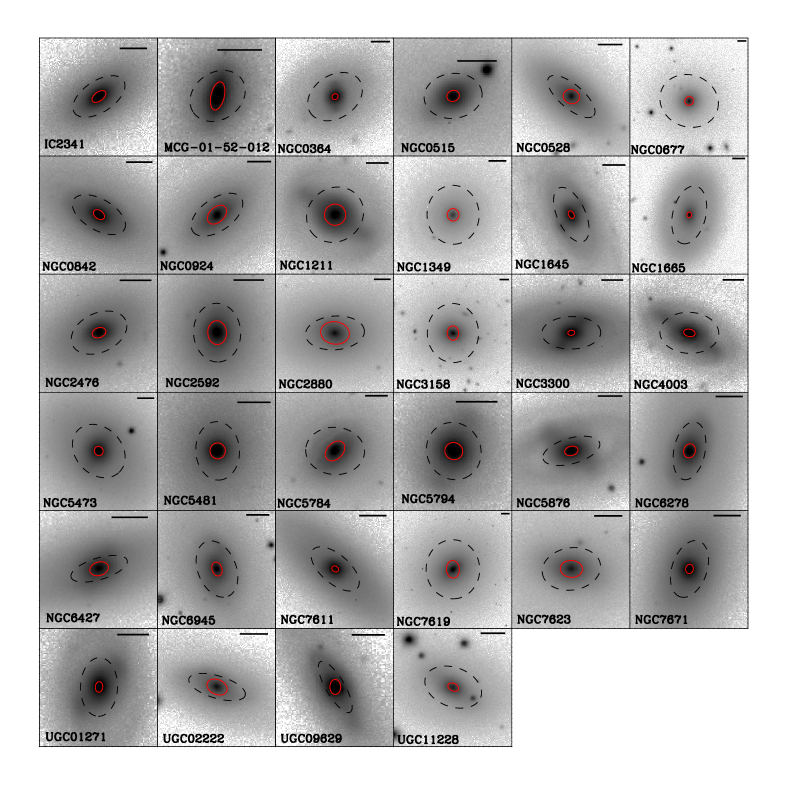
Summarizing, all galaxies with additional structural components (i.e., bars or non-single exponential discs) were directly classified as lenticular galaxies. For the remaining galaxies, those classified by the logical filter as elliptical and with a were photometrically classified as ellipticals. On the other hand, those accepted by the logical filter as two-component and with represent our final sample of bona-fide photometric lenticular galaxies. Finally, those galaxies accepted by the logical filter as two-component and with cannot be safely classified and they were labelled in our sample as unknown. This latter group has not been used in any further analysis in this paper. There are not galaxies classified as elliptical by the logical filter and with . Table 1 shows a compendium of the number of galaxies in each sample. The final sample studied in this work is composed by 34 S0 galaxies. Figure 5 shows a mosaic with the thumbnail images for our S0 galaxies. The effective radius of the whole galaxy (black dashed), as computed from the growth curves (see Walcher et al., 2014), is shown and the image size has been rescaled accordingly. The bulge effective radius (, red) is also shown. This parameter was obtained from the photometric decomposition described in this section.
| CALIFA VISUAL | LF | LF + | FINAL |
| (1) | (2) | (3) | (4) |
| 48 E | 21 E | 21 E | |
| 27 S0 | 15 U | ||
| 12 S0 | 26 E | ||
| 33 S0 | 5 E | 5E | 21 U |
| 28 S0 | 6 U | 34 S0 | |
| 22 S0 |
4 Global properties of the galaxy sample
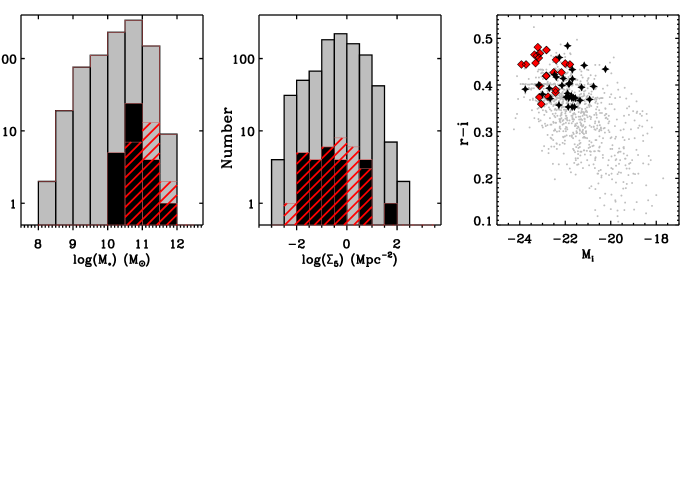
Figure 6 shows the range of stellar masses, local galaxy densities, and colours probed by our final sample of S0 galaxies. For comparison, we have also included the values for the CALIFA mother sample and the elliptical sample that will be used for comparison in Sect 6.3.
From Figure 6 (left panel) it is clear that our S0 sample covers a narrow range of stellar masses, . Compared to the elliptical sample they show slightly lower masses but they both represent the high mass end of the whole CALIFA mother sample (e.g., González Delgado et al., 2015). Although the tight stellar mass range covered by our sample is not representative of the wide range of masses encompassed by the whole population of S0 galaxies, it allows us to characterise a well-defined sample of high-mass S0 galaxies.
The environment where our S0 galaxies live is presented in Figure 6 (middle panel). The local galaxy densities were extracted from Walcher et al. (2014) and they were computed as in Aguerri et al. (2009). Despite S0 galaxies being found in a wide range of local densities, our sample is mainly composed of galaxies living in low-density environments ( gal/Mpc2). Therefore, we are not probing S0 in galaxy clusters. We have further checked this by studying the membership of our S0 sample within well-known galaxy structures. We found that none of our galaxies belong to a high-density structure (see Walcher et al., 2014, for details on the membership definition).
The S0 galaxy colours shown in Figure 6 (right panel) show that they lie on the red-sequence. Their colours are similar to the reddest galaxies in the CALIFA mother sample and comparable with those of the elliptical galaxies.
To summarise, our galaxy sample represents a well characterised sample of high mass, red, and relatively isolated S0 galaxies.
5 Stellar kinematic measurements
5.1 Stellar kinematics maps
The stellar kinematics of the galaxy sample were measured from the spectral datacubes observed with the V1200 grating. An extensive description of the methodology is explained in Falcón-Barroso et al. (2017). We briefly describe in the following the main characteristics of the process.
The spaxels of the datacube were binned using a Voronoi tessellation method (Cappellari & Copin, 2003) in order to achieve a signal-to-noise (S/N) ratio 20. Spaxels with S/N 3 were removed from the analysis. The first two moments of the line-of-sight velocity distribution (LOSVD) were then measured for each Voronoi bin using the penalised pixel-fitting method (pPXF) from Cappellari & Emsellem (2004). The possibility of fitting higher-order moments of the LOSVD was turned off during the fit due to the limited S/N of the spectra. A non-negative linear combination of a subset of 328 stellar templates from the Indo-US library (Valdes et al., 2004) was used to fit the spectra. The final errors in both velocity and velocity dispersion were obtained via Monte Carlo simulations.
5.2 Stellar kinematic properties
Historically, most of the studies in galaxy bulge kinematics were based on long-slit spectroscopy, therefore most of these studies focus on edge-on disc galaxies in order to avoid as much as possible contamination from the disc component. Then, slits were placed at different heights over the disc plane to compute the maximum rotation velocity. With the advent of IFS spectroscopy, a re-formulation of the vs diagram was done by Binney (2005). The updated formulae to compute the relation using 2D spectroscopy can be defined as
| (5) |
where is the flux contained inside the th Voronoi bin and and are the corresponding measured mean velocity and velocity dispersion.
According to this new formulation, and in their quest for a better representation of the dynamical support of galaxies, Emsellem et al. (2007) defined a new kinematic parameter, , as a function of surface brightness weighted averages of and . Furthermore, they included a factor depending on the galactocentric distance in order to capture the spatial information provided by the IFS, thus converting into a proxy for the specific angular momentum. The equation to measure takes the form
| (6) |
where is the flux inside the th bin, is the distance to the galaxy centre, and and the corresponding mean stellar velocity and velocity dispersion.
is by definition a function of the radius, thus its integrated value will depend on the radial extension over which it is measured. Previous works carried out by the SAURON and ATLAS3D teams (Emsellem et al., 2007, 2011) have used the half light radius () of the whole galaxy. This quantity is relatively easy to measure (using the curve of growth obtained from ellipse fitting to the galaxy isophotes) and provides a single parameterisation of the rotational support of the galaxy independently of morphology. However, in this work we are interested in the kinematics of the galaxy bulges and therefore we computed the values of both and over 1 effective radius of the photometric bulge component (see Sect 3.2). A complete analysis on the and properties of the whole galaxy, and the comparison with previous surveys, will be given in Falcon-Barroso et al. (in prep.)
The final errors in our integrated kinematic properties (, and ) come from three main sources: the measurement errors of the stellar kinematic maps (see Falcón-Barroso et al., 2017), the effects of pixelization and PSF associated with measuring integrated properties in small apertures, and the errors corresponding to the correction for the disc kinematics. All errors were added in quadrature. The measurement errors were propagated to the integrated quantities by using Monte Carlo simulations of the velocity and velocity dispersion maps, i.e., varying randomly the values in each spaxel within their error. The pixelation and PSF effects were estimated using mock datacube spectroscopic simulations. The methodology is explained in detail in Appendix B. The impact of the disc kinematics in the bulge measurements are also estimated using mock spectroscopic simulations as described in Sect. 6.2.1 and compared with the results from Schwarzschild dynamical modelling of the galaxies (see Sect. 6.2.2). The final corrected values of and , their edge-on deprojections, and their corresponding errors are shown in Table 2.
| Galaxy | |||||||||
| (m) | (p+r) | (p+r+d) | (edge-on) | (m) | (p+r) | (p+r+d) | (edge-on) | ||
| (1) | (2) | (3) | (4) | (5) | (6) | (7) | (8) | (9) | (10) |
| IC2341 | 0.300.04 | 0.440.04 | 0.380.07 | 0.410.07 | 0.300.04 | 0.420.04 | 0.330.06 | 0.350.07 | 0.69 |
| MCG-01-52-012 | 0.220.02 | 0.320.02 | 0.290.06 | 0.370.10 | 0.210.02 | 0.290.02 | 0.250.03 | 0.330.11 | 0.28 |
| NGC0364 | 0.190.04 | 0.340.04 | 0.330.04 | 0.380.09 | 0.200.03 | 0.320.03 | 0.310.03 | 0.380.10 | 0.26 |
| NGC0515 | 0.120.05 | 0.220.05 | 0.210.06 | 0.270.10 | 0.130.04 | 0.260.04 | 0.200.04 | 0.260.10 | 0.44 |
| NGC0528 | 0.260.07 | 0.460.07 | 0.390.07 | 0.390.07 | 0.280.07 | 0.410.07 | 0.340.07 | 0.340.10 | 0.19 |
| NGC0677 | 0.100.01 | 0.140.01 | - | - | 0.110.01 | 0.140.01 | - | - | 0.24 |
| NGC0842 | 0.260.05 | 0.440.05 | 0.420.05 | 0.440.07 | 0.260.04 | 0.400.04 | 0.380.04 | 0.410.07 | 0.50 |
| NGC0924 | 0.390.05 | 0.620.05 | 0.590.05 | 0.610.08 | 0.420.05 | 0.590.05 | 0.550.06 | 0.600.10 | 0.52 |
| NGC1211 | 0.190.01 | 0.270.01 | - | - | 0.200.01 | 0.260.01 | - | - | 0.35 |
| NGC1349 | 0.120.01 | 0.190.02 | 0.160.05 | 0.250.15 | 0.130.02 | 0.190.02 | 0.170.02 | 0.270.12 | 0.23 |
| NGC1645 | 0.200.06 | 0.350.06 | 0.330.06 | 0.340.08 | 0.210.06 | 0.340.06 | 0.320.06 | 0.330.08 | 0.48 |
| NGC1665 | 0.120.01 | 0.230.01 | 0.220.01 | 0.230.03 | 0.130.01 | 0.210.01 | 0.200.01 | 0.220.03 | 0.28 |
| NGC2476 | 0.190.06 | 0.330.06 | 0.300.06 | 0.320.11 | 0.200.06 | 0.310.06 | 0.280.06 | 0.320.11 | 0.57 |
| NGC2592 | 0.320.02 | 0.490.02 | 0.450.05 | 0.540.12 | 0.310.02 | 0.440.02 | 0.360.04 | 0.480.14 | 0.75 |
| NGC2880 | 0.370.02 | 0.490.02 | - | - | 0.380.02 | 0.460.02 | - | - | 0.30 |
| NGC3158 | 0.210.01 | 0.280.01 | - | - | 0.250.01 | 0.300.01 | - | - | 0.76 |
| NGC3300 | 0.110.05 | 0.190.05 | 0.180.12 | 0.200.07 | 0.110.05 | 0.180.05 | 0.170.14 | 0.190.06 | 0.36 |
| NGC4003 | 0.300.06 | 0.480.06 | 0.440.05 | 0.490.11 | 0.310.07 | 0.450.07 | 0.390.05 | 0.460.16 | 0.76 |
| NGC5473 | 0.120.03 | 0.180.03 | 0.140.06 | 0.190.11 | 0.120.03 | 0.180.03 | 0.140.08 | 0.190.12 | 0.20 |
| NGC5481 | 0.090.02 | 0.170.02 | 0.140.03 | 0.180.07 | 0.100.02 | 0.150.02 | 0.130.03 | 0.160.07 | 0.15 |
| NGC5784 | 0.220.02 | 0.320.02 | - | - | 0.230.02 | 0.300.02 | - | - | 0.64 |
| NGC5794 | 0.170.02 | 0.300.02 | 0.270.05 | 0.420.17 | 0.180.02 | 0.280.02 | 0.260.03 | 0.460.22 | 0.11 |
| NGC5876 | 0.170.04 | 0.250.04 | 0.240.04 | 0.250.05 | 0.170.04 | 0.240.04 | 0.230.04 | 0.230.04 | 0.38 |
| NGC6278 | 0.170.03 | 0.270.03 | 0.260.03 | 0.280.05 | 0.170.03 | 0.240.03 | 0.240.03 | 0.250.05 | 0.25 |
| NGC6427 | 0.240.05 | 0.380.05 | 0.360.10 | 0.360.05 | 0.240.04 | 0.350.04 | 0.340.13 | 0.340.04 | 0.32 |
| NGC6945 | 0.170.03 | 0.290.03 | 0.280.03 | 0.310.06 | 0.180.03 | 0.260.03 | 0.250.03 | 0.290.06 | 0.60 |
| NGC7611 | 0.130.05 | 0.250.05 | 0.250.04 | 0.260.06 | 0.150.03 | 0.270.03 | 0.260.04 | 0.280.04 | 0.29 |
| NGC7619 | 0.110.01 | 0.130.01 | - | - | 0.120.01 | 0.140.01 | - | - | 0.71 |
| NGC7623 | 0.140.02 | 0.210.02 | 0.160.05 | 0.200.10 | 0.140.01 | 0.190.01 | 0.170.04 | 0.210.07 | 0.58 |
| NGC7671 | 0.160.02 | 0.310.02 | 0.300.02 | 0.330.05 | 0.160.03 | 0.270.03 | 0.260.02 | 0.290.06 | 0.26 |
| UGC01271 | 0.200.03 | 0.350.03 | 0.340.03 | 0.370.07 | 0.200.03 | 0.320.04 | 0.310.04 | 0.350.07 | 0.46 |
| UGC02222 | 0.280.03 | 0.440.03 | 0.400.04 | 0.400.04 | 0.290.04 | 0.410.04 | 0.400.04 | 0.400.04 | 0.36 |
| UGC09629 | 0.210.03 | 0.360.04 | 0.350.04 | 0.360.05 | 0.210.04 | 0.320.04 | 0.310.04 | 0.320.05 | 0.28 |
| UGC11228 | 0.120.02 | 0.200.02 | 0.180.04 | 0.210.05 | 0.120.02 | 0.180.02 | 0.170.04 | 0.200.05 | 0.79 |
6 Results
6.1 Structural components and photometric properties of the sample
In this section we dissect the structural components present in our sample of 34 S0 galaxies. A comparison with previous results from the literature using similar methodologies, but larger samples, allow us to place our photometric components in a more general context.
6.1.1 Bulge properties
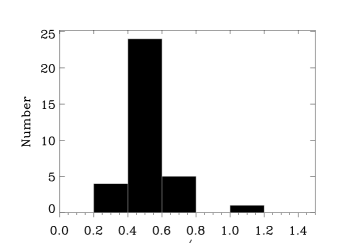
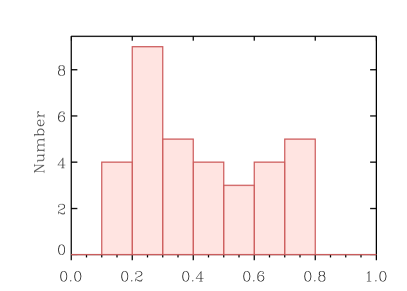
Figure 7 shows the band distribution of the luminosity ratio, Sérsic index, and their correlation for the bulges of our galaxy sample. The distribution is compared with the sample of S0 galaxies from Laurikainen et al. (2010) which uses the same photometric definitions for the different galaxy components. The distributions are in good agreement showing a wide range of values from small bulges ( 0.1) to galaxies with large bulges (). The Sérsic index distribution also shows a large range of values and a similar distribution to that of Laurikainen et al. (2010). These two parameters are commonly used to describe bulges and occasionally they are used interchangeably. Figure 7 shows the correlation between and . Despite the fact that high bulges show larger values of , the correlation is weak (Pearson coefficient ) and there is large scatter in the relation, with highly concentrated bulges () can be found in galaxies with either large or small ratios.
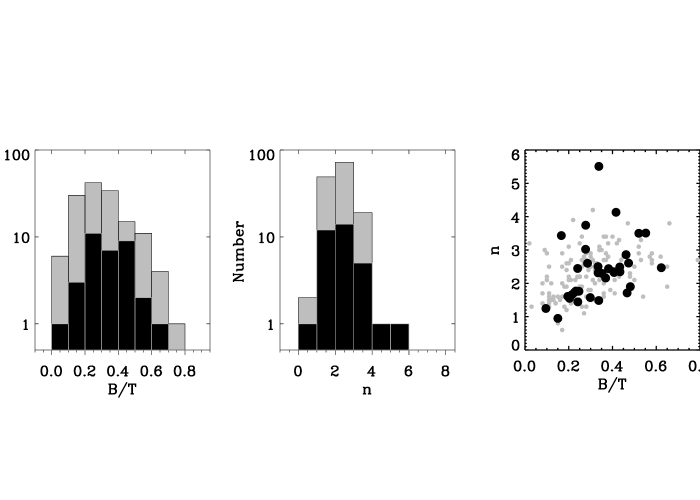
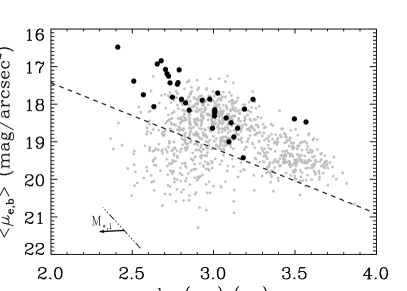
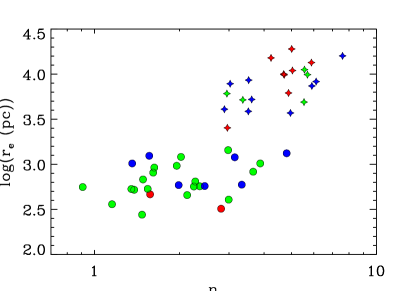
Figure 8 shows the relation between the mean effective surface brightness within the effective radius () against the effective radius for the S0 bulges in our sample. This relation is also known as the Kormendy relation (Kormendy, 1977) and it represents a projection of the fundamental plane (Djorgovski & Davis, 1987; Dressler et al., 1987). Gadotti (2009) used the Kormendy relation to separate classical from disc-like bulges based on the sensible assumption that they should be photometrically and structurally different. He suggested that disc-like bulges must be faint outliers of the relation defined by ellipticals and classical bulges. Thus, he introduced the empirical line shown in Figure 8 as a division between the two types of bulges. According only to this photometric criterium, and since all our S0 bulges lie in the region of classical bulges of the diagram, none of them would be compatible with a disc-like structure. Nevertheless, the Kormendy relation shows a strong dependence with the spheroid magnitude/mass (Nigoche-Netro et al., 2008) and therefore bulges below the separation line might only represent the less luminous/massive systems (Costantin et al., 2017).
6.1.2 Disc properties
Galaxy discs in our sample were fitted using either a single exponential profile, or a double exponential with a down-bending or up-bending outer slope (see Sect 3.2). We found that 17 (68%), 6 (24%), and 2 (8%) S0 galaxies were best fitted with a type I, type II, or type III profile, respectively. These values are significantly different from those provided by Erwin et al. (2008) for early type barred galaxies (27%, 42%, and 24% for types I, II, and III, respectively) and Gutiérrez et al. (2011) for a larger sample of early type discs (30%, 25%, and 45% for types I, II, and III, respectively). An obvious source for these differences might be in the different sample selections and sizes. However, other differences such as either the accurate selection of a well-defined sample of S0 galaxies done in this work or the application of a 2D decomposition algorithm to understand the disc structure instead of relying on 1D azimutally-averaged profiles can also contribute to these differences. The latter issues are discussed in detail in Méndez-Abreu et al. (2017) and Ruiz-Lara et al. (2017).
6.1.3 Bar properties
The study of bar properties is not the main scope of this paper, but their inclusion in the 2D photometric decomposition method is mandatory to obtain an accurate description of the remaining galaxy components. We found that 21 galaxies in our sample are barred, representing of the sample. This value is higher than those found in the literature for this range of galaxy masses (Méndez-Abreu et al., 2010b; Méndez-Abreu et al., 2012) and for S0 galaxies in general (Aguerri et al., 2009; Barazza et al., 2009), but see Méndez-Abreu et al. (2017). Recently, Laurikainen et al. (2013) presented a detailed inventory of photometric structures in S0 galaxies finding a strong variation of the bar fraction with the bulge prominence. They found a bar fraction of 64%, 64.5%, and 32% for values between 0-0.2, 0.2-0.4, and 0.4-1, respectively. A similar trend has been recently reported by Buta et al. (2015). These strong variations can explain our high fraction of bars once the distribution of our sample is taken into account (22 out of 34 galaxies in our sample have ). Moreover, our S0 vs elliptical separation methodology is biased towards barred systems. Barred galaxies are automatically classified as S0 whereas non-barred S0 could still be misclassified as ellipticals, thus increasing the bar fraction.
Even if not included in the fit as an independent component, we also perform a visual search for the presence of ’barlenses’. A barlens refers to the inner part of a galaxy bar, different from the bulge, and they were first recognized by Laurikainen et al. (2010). Recently, Laurikainen et al. (2014) and Athanassoula et al. (2015) use both observations and numerical simulations to show that barlenses are likely to be the more face-on view of the boxy/peanut shape of the bar where seen edge-on. According to the prescriptions given in those papers we found signatures of barlenses in 5 barred galaxies in our sample (UGC01271, NGC1211, NGC1645, NGC3300, and NGC5876) as well as tentative hints in other 3 galaxies (NGC0364, NGC4003, and NGC6945).
6.1.4 Bulge and disc interplay
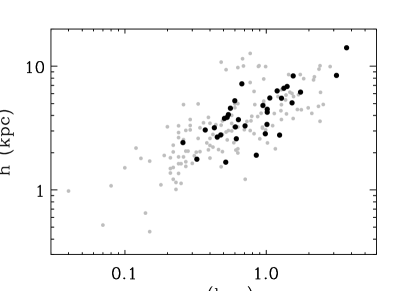
Figure 9 shows the relation between the effective radius of the bulge and the scale-length of the disc for our S0 sample. The clear correlation, quantified using the Spearman correlation test (, statistically significant at ) indicates that larger bulges reside in galaxies with larger discs. This relation was already observed by Courteau et al. (1996) and later confirmed in the optical (Aguerri et al., 2005) and the near infrared by several authors (Möllenhoff & Heidt, 2001; MacArthur et al., 2003; Méndez-Abreu et al., 2008). The values obtained from the multi-component photometric decomposition of Laurikainen et al. (2013) are also shown. The good agreement between the different samples indicate that despite the small number statistics our sample reproduces the expected photometric scaling relation for S0 galaxies.
6.2 Stellar kinematics of S0 bulges
In this section we analyse the kinematic properties of our sample of S0 bulges. As already stated throughout the paper, our definition of bulge is entirely photometric and based on our 2D photometric decomposition. We use the value of the photometric effective radius to define the aperture where the kinematic parameters are measured (see Sect. 5.2), and we study our S0 bulges as if they were an independent structure within the galaxy. This assumption has been widely adopted in the literature regarding either photometric, kinematic, or combined studies. An important example is the comparison of bulges and other spheroidal systems in scaling relations related to the virial theorem such as the Kormendy relation (Kormendy, 1985), Faber-Jackson relation (Faber & Jackson, 1976), and the fundamental plane (Djorgovski & Davis, 1987). We refer the reader to Falcón-Barroso (2016) for a recent review on the kinematic properties of bulges.
6.2.1 Disc contamination in our S0 bulges
A common caveat associated with the study of the stellar kinematics of galaxy bulges is how the contamination from the underlying stars in the disc is affecting the measurements.
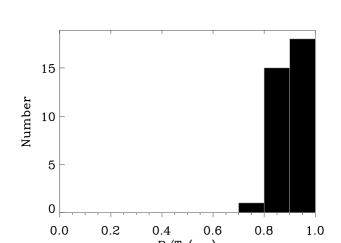
From a photometric point of view, we can quantify the ratio of the radial extension where the kinematic measurements were performed, i.e., the of the bulges, with respect to the radius where the light of another component (usually the disc) has the same contribution to the SB distribution (). Figure 10 (upper panel) shows the distribution of values. It is clear that for most of our galaxies we are measuring the bulge stellar kinematics within the region dominated by light coming from the bulge. Similarly, Figure 10 (bottom panel) shows the ratio computed at one bulge . This allows us to quantify the integrated amount of light coming from the bulge with respect to other structures present in the galaxy centre (i.e., disc and/or bar). In all cases, more than 70% of the light in the region where we are measuring the stellar kinematics is coming from the central bulge.
From the spectroscopic point of view, quantifying the impact of the disc stellar light on our bulge velocity and velocity dispersion measurements is not straightforward. We approach this issue by performing simulations on mock datacubes in a similar manner as explained in Appendix B, but including the photometric and kinematic presence of an underlying disc. A set of 90 tailor-made mock datacubes are created for each observed galaxy in our sample. We used the measured values of the bulge and disc SBD (see Tables LABEL:tab:decompbulge, LABEL:tab:decompdisc) to reproduce realistic spaxel to spaxel intensity variation within the datacube. The photometric properties of the datacubes are kept fixed for all the 90 simulated cubes for each galaxy, allowing us to produce realistic ratios in the region where the stellar kinematics are measured (i.e., ). The velocity and velocity dispersion distributions were assumed to follow the analytical descriptions by Salucci et al. (2007) and an exponential profile, respectively (see Appendix B for details on the actual implementation). The same parameterisation was used for the bulge and disc components. These functional forms involve the choice of a maximum rotational velocity (), a spatial scale of the velocity profile (), a maximum central velocity dispersion (), and a scale-length of the velocity dispersion distribution (). The analysis of the rotational velocity and velocity dispersion distributions for our observed galaxies was carried out using the kinemetry code (Krajnović et al., 2006). We create mock datacubes within the limits of our observed galaxies (Appendix B). Thus, our mock datacubes were created with the following kinematic characteristics: [, ] = [50, 150], [50, 300], [150, 150], [200, 300], and [300, 300] in km/s, [, ] = [5, 5], [10, 10], and [15, 15] in arcsecs, [, ] = [150, 100] and [250, 200] in km/s, and [, ] = [10, 10], [20, 20] and [30, 30] in arcsecs. The different combinations of these pairs of values for the bulge and disc components produce our 90 mock datacubes for each galaxy. Our set of kinematic models cover extreme cases in terms of , , , and for both components. Nevertheless, we check that both the rotation curve and velocity dispersion profiles obtained from this analysis represent typical observed profiles for real galaxies. Then, for each galaxy we create a similar set of mock datacubes but removing the disc component. The differences between these two sets of simulations in terms of the and values measured within for each galaxy tell us about the contamination from the disc component.
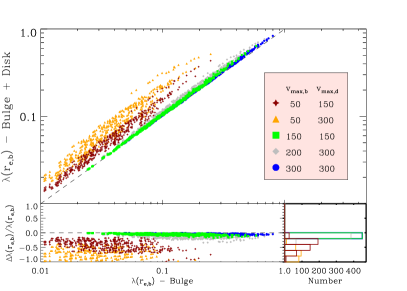
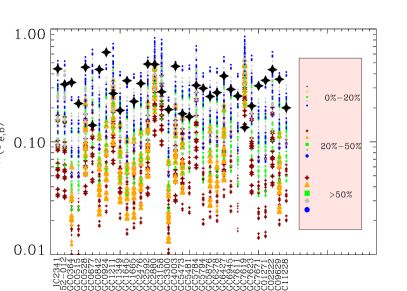
Figure 11 shows the results of our simulations. The left panel shows the distribution of measured in the mock datacubes including a bulge + disc photometric and kinematic model vs the same measurement on simulations including only the bulge model. We separate different pairs of maximum rotational velocities for the bulge and the disc in different colours and symbols. Three different behaviours can be seen based on these separations apart from the expected larger values of when the disc component is included in the modelling. First, datacubes with low maximum rotational of the bulge ( 50 km/s) show the largest deviations, with the maximum difference depending on the maximum rotational velocity of the disc. Departures from the actual values of can be as high as 100%, but most of the measured values have 0.1. Therefore, bulges with low are heavily contaminated by the underlying disc, but even in the extreme case of discs with km/s they still show values unrealistically low compared with our measurements. The second trend is shown by datacubes with similar maximum rotational velocities for the bulge and the disc. They show almost no differences () in the measured , and this is independent of the maximum rotational velocity value. The third possibility involves cases where the bulge and disc maximum rotational velocity are different, but the bulge shows some rotation ( 200 km/s). In this case, the differences () with respect to the actual are larger than in the second case, but much smaller than in the first case. We conclude that high contamination from the underlying disc is not strongly dependent on the different maximum rotational velocity of bulge and disc, but mostly on the rotation of the bulge component.
We use these mock datacube simulations to quantify the disc contamination in our measured and values. The process is exemplified in the right panel of Figure 11. It shows the distribution of measured , including a bulge + disc photometric and kinematic model, for each galaxy, with the symbol sizes representing the deviation from the input value. Using those models with comparable values of with respect to the real measurements (i.e, ), we computed the mean difference and its standard deviation for each galaxy. A similar approach was followed for the measurements. The mean value of the difference is then used as a correction factor for our measured values of and and the standard deviation was added in quadrature to the errors (see Sect. 5.2). From this analysis, we found that six of our sample bulges were strongly contaminated by the disc (large mean value) and the correction was also highly uncertain (large standard deviation value), therefore we decided to remove these bulges from any further analysis of the bulge dynamics. They are NGC0677, NGC1211, NGC2880, NGC3158, NGC5784, and NGC7619. For the sake of completeness their kinematic values are included in Table 2 but not used in the following study.
6.2.2 Schwarzschild dynamical modelling of our galaxy sample
Schwarzschild modelling of galaxies (Schwarzschild, 1979) has been demonstrated to be a very powerful technique to study the dynamics of stellar systems (van de Ven et al., 2006; van den Bosch et al., 2008). Due to its orbit-superposition methodology, where galaxies are build up by weighting the orbits generated in a gravitational potential, its application to the modelling of real galaxies has been used to identify different dynamical components (van den Bosch et al., 2008; Breddels & Helmi, 2014).
In this paper, we have used the Schwarzschild modelling of the CALIFA galaxies carried out by Zhu et al. (2017). We refer the reader to the paper for a full description of the method. In short, the Schwarzschild model requires an adequate model of the galaxy gravitational potential (generally derived from the luminosity distribution of the galaxy image). Then, a set of representative orbits is explored under the effect of this triaxial gravitational potential and finally, the combination of orbits that best reproduces our galaxy is found by fitting the observed luminosity and kinematic distribution. We find that 20 out of 34 galaxies in our sample were analysed using the Schwarzschild modelling by Zhu et al. (submitted). From these, we discard 3 of them because the disc contamination is strongly affecting the bulge kinematics, so we remain with 17 galaxies for this analysis. We use these galaxies to check our disc contamination correction (Sect. 6.2.1), and to understand our ability to deproject our kinematic measurements.
The Schwarzschild dynamical modelling of each galaxy provides us with a set of orbits, each one contributing differently to the surface-brightness distribution and stellar kinematics. For the sake of comparison with our previous analysis of the real galaxies, we also looked for orbits building both our disc and bulge component using their luminosity profiles. We first determined the region of the galaxy where the disc dominates the SBD of the galaxy according to our photometric decomposition (i.e., ). Then, we ranked the orbits by their relative contribution to the disc total luminosity (computed between and , where is the maximum radius used in the Schwarzschild modelling). Finally, the most luminous orbits contributing up to an 80% of the total luminosity of the disc are tagged as belonging to the disc component. The remaining orbits were considered to build the bulge component.
Using the previously defined bulge orbits, we reconstructed the maps of SBD, , and , and measured the and as if they were real galaxies (see Sect. 5.2). Figure 12 shows the comparison of computed using the Schwarzschild modelling with respect to our empirical corrected values using mock datacubes. The agreement between both measurements is remarkable with most of the differences being within the estimated errors (no errors were estimated for the Schwarzschild modelling). The standard deviation of the differences is . This is reassuring by taking into account the completely different methodologies used to remove the disc component. Still, there are two galaxies with differences larger than their errors, that correspond to the lowest values of in our sample. After a careful check of the orbits derived from the Schwarzschild modelling, we find that the SBD of the disc orbits do not present a single exponential profile, but they are more peaked at the galaxy centre. The different slope in the SBD of the discs is not taken into account in our mock datacubes, and therefore our disc correction is underestimated with respect to orbital modelling for these galaxies.

Another advantage of the Schwarzschild modelling is that we have now the possibility of measuring the values of and using the edge-on projection of the bulge model. Observationally, the measured values of and depend on three parameters of the bulge: the orbital anisotropy, the intrinsic shape, and the inclination with respect to the line-of-sight (see Emsellem et al., 2011). Observations do not provide access to the orbital anisotropy. Therefore, we considered that the vertical anisotropy of our bulges can take any value from , and we added this uncertainty to the error bars. Regarding the intrinsic flattening, we considered that both the bulge and disc are oblate ellipsoids sharing the same inclination. Despite this being a strong assumption (see Méndez-Abreu, 2016), it provides a first order estimation that helped us to deproject the bulge kinematics. The distribution of intrinsic flattening of our bulges is shown in Figure 13. Finally, we derived the galaxy inclination assuming that discs have an intrinsic flattening given by a normal distribution with mean flattening = 0.267 and standard deviation =0.102 (see Rodríguez & Padilla, 2013). Figure 14 shows the comparison of the edge-on values derived from the Schwarzschild modelling and our deprojected measurements based on the observations. Despite the larger errors, the standard deviation of the differences is , showing a good agreement. Similarly as for the projected values, the two galaxies with lower also show the largest differences.

A similar analysis was performed for obtaining a standard deviation of the differences and for the projected and deprojected values, respectively. The good agreement between the results from our empirical correction and the Schwarzschild modelling confirms our ability to recover the bulge stellar kinematics. In the following, we will consider only the deprojected values obtained from our statistical analysis unless otherwise stated. Using our own estimation allows us to use the whole sample of 28 bulges with good kinematics described throughout the paper. The final deprojected values are listed in Table 2.
6.3 Photometry vs kinematics in S0 bulges
Figure 15 shows the distribution of deprojected values of and for our S0 bulges sorted by their photometric properties: Sérsic index (upper panels) and (bottom panels). We do not find any clear trend between the photometric and kinematic properties of our bulges. We compute the Spearman correlation test () in order to understand the statistical significance of a possible correlation between the proposed measurements. This test assesses how well the relationship between two variables can be described using a monotonic (not necessary linear) function. We find low values of the correlation coefficient in all cases: 0.2, 0.4, 0.2, and 0.4 for the vs. , vs. , vs. , and vs. relations, respectively. In addition, we computed the statistical significance of the possible correlation with respect to the null hypothesis (no correlation). We find that we cannot reject the null hypothesis at more than 1 in any of the cases, therefore we can conclude that there is no statistical correlation between the photometric ( and ) and kinematic ( and ) properties of our bulges.

Due to the relatively large uncertainties of the kinematic measurements for some of our bulges, we decided to perform a further test to understand the statistical significance of our results. Therefore, we carried out the Spearman test using Monte Carlo simulations taking into account the errors in both variables for each case (i.e., or and or ). We performed 1000 simulations allowing each bulge to take a possible value confined within its error, and computed the Spearman correlation coefficient for each simulation of the sample. As a result of this exercise we obtained a distribution of both the correlation coefficients () and statistical significance. We found that, for correlations including the Sérsic index, only in 3% of the trials the null hypothesis could be rejected at 2 . This number increase up to a 10% regarding the correlations with . These percentages are low and they confirm that there is no correlation between the photometry and kinematics of our bulges independently of the uncertainties in the measurements.
In Sects. 6.2.1 and 6.2.2 we discussed how the disc contamination was removed from the bulge kinematics. We make use of the kinematics results obtained from the Schwarzschild reconstructed bulge maps to study the possible correlation with their photometric properties. Despite the lower number statistics (17 galaxies), we confirm results obtained with the whole sample about the lack of a statistically significant correlation between the morpho-kinematic properties of S0 bulges.
Figure 16 shows the relation between the apparent bulge effective radii () and the deprojected values of and for our S0 bulges. A possible caveat to our analysis might be the small apparent size of our bulges. We checked whether the kinematic measurements are correlated with the aperture where they were measured (). We carried out the same statistical analysis, based on Monte Carlo simulations, as performed with the and parameters. We find that we can only reject the lack of correlation at 2 level in less than 10% of the realisations, showing the lack of correlation between our kinematic measurements and bulge apparent size.

The relation between the kinematic and photometric properties of bulges has been greatly debated in the literature, but it is poorly constrained by observations. Previous observational results suggested that bulges with low Sérsic index and low should present more disc-like characteristics (Fisher & Drory, 2016), therefore they should show larger rotational support than bulges with either higher Sérsic index or . We have demonstrated that there is no such trend in our sample of S0 bulges.
Another commonly used diagram to separate bulges with disc-like properties from bulges with features similar to ellipticals (classical bulges) is presented in Figure 17. It shows the relation between the Sérsic index and the effective radius of the bulge. In general, bulges with both low and low are considered disc-like whereas bulges with large and large are considered as classical (Fisher & Drory, 2010). In order to add information about their kinematic properties we have included a colour code where blue, green, and red circles represent bulges with , , and , respectively. We also included a subsample of elliptical galaxies (see Sect. 4) with measured kinematics at 1 of the galaxy. We do not find any trend between the stellar kinematics and the position of the bulges in this diagram. Previous works reported the presence of a break (knee) separating both kind of bulges (Fisher & Drory, 2016), we find that for our sample bulges there is no such break, but this is only present whenever we add the elliptical galaxies to the sample.
Therefore, we suggest that pure photometric diagrams, such as a Sérsic index based separation or the vs relation, might not be useful to separate disc-like from classical bulges in S0 galaxies.
7 Discussion
7.1 Morpho-kinematic properties of S0 bulges
The photometric properties of our S0 bulges (effective radius, Sérsic index, and ratio) span a wide range of values (see Figure 7). This lack of homogeneity in the photometric properties of S0 bulges has raised the idea that different formation scenarios, or at least different initial conditions, are needed to explain their observational properties.
From the kinematics point of view, we find that our bulges show a large range of angular momentum and () values. We demonstrate that this result is robust despite the difficulties inherent to separate the bulge kinematics from the total galaxy, and the uncertainties inherent to deprojection issues.
Figure 15 shows our attempt to understand the possible connection between bulge photometry and kinematics. We demonstrate that regardless of projection effects, there is no statistically significant relation between either the Sérsic index, or the luminosity ratio, and the stellar angular momentum, or the , of our S0 bulges. A similar lack of correlation was found in Falcón-Barroso et al. (2003). They showed that the central gradient of the velocity dispersion was not related to the Sérsic index for a sample of 19 early-type disc galaxies. On the other hand, Fabricius et al. (2012) claimed that purely kinematic diagnostics of bulge dichotomy agree with those based on Sérsic index, i.e., low Sérsic index bulges have increased rotational support. This morpho-kinematic approach has barely been explored in the literature, and the results of Fabricius et al. (2012) show a significant degree of overlap between different bulge types. Nevertheless, we suggest that a possible explanation of the results is the different morphological mixing in Fabricius et al. (2012) sample ( spiral, 30 S0s), suggesting a diverse origin of their bulges, possibly with a larger fraction of disc-like bulges in later Hubble types, with respect to our pure sample of S0s. Recently, Tabor et al. (2017) performed the spectro-photometric bulge to disc decomposition of three galaxies from the CALIFA survey. They found that all their bulges are photometrically described by a Sérsic index . However, despite the stellar kinematics of the bulges show some rotation, they are considered as dispersion dominated systems due to their high velocity dispersion values.
7.2 Bulge formation scenarios
Different formation scenarios are expected to leave distinct fingerprints on the photometric and kinematic properties of bulges (Kormendy & Kennicutt, 2004; Athanassoula, 2005). These scenarios are generally divided into two main types depending on whether their final outcome could be classified as a classical or disc-like bulge.
The major merger scenario has commonly been invoked as the main channel for the formation of classical-like bulges (Hopkins et al., 2009, but see Keselman & Nusser 2012). Recent merger simulations in a cosmological context have demonstrated that only the right combination of major and minor, wet and dry mergers can reproduce the current population of galaxies (Oser et al., 2012). In particular, the amount of gas available in the merger has been found to be critical for the bulge growth. Hopkins et al. (2009) showed that dissipative processes are the main driver of bulge growth after a merger, whereas stellar redistribution plays a minor role (Brooks & Christensen, 2016). These mechanisms have been explored in high resolution cosmological simulations where the properties of the bulge regions are better resolved (Guedes et al., 2013; Okamoto, 2013; Christensen et al., 2014). If bulges are formed by mergers, like elliptical galaxies, then they should show a variety of photometric and kinematic properties depending mainly on the amount of dissipation involved in the merger and, eventually, merger-built bulges might show the decoupled morpho-kinematics found in Figure 15 (Hopkins et al., 2010; Naab et al., 2014).
At high redshift, disc-like star-forming galaxies have irregular optical morphologies dominated by giant clumps of star formation (Abraham et al., 1996; van den Bergh et al., 1996; Elmegreen et al., 2007; Hinojosa-Goñi et al., 2016). These clumpy galaxies might be the early progenitors of the S0 galaxies observed in the nearby Universe. The observed properties of the bulges resulting from this process are still a matter of debate. However, some numerical simulations have already provided some ideas about the final outcome of the clump merging process. If the clumps are short-lived, and efficiently destroyed by stellar feedback before their inward migration timescale, there could still be a diffuse inflow of inter-clump gas driven by the instability (Hopkins et al., 2012; Bournaud et al., 2011). This will create a low-concentration bulge if no other relaxation process affects the central region. On the other hand, the models with long-lived clumps, the repeated clump coalescence (Elmegreen et al., 2008), and the relatively short star-formation timescales (Immeli et al., 2004) would produce bulges with low rotational support and high Sérsic indices. While we are far from a definitive answer about the observational properties of clump-driven bulges and their evolution until , the variety of morphological and kinematic properties predicted from recent models might also be in agreement with the results shown in this paper.
The minor merger (mass ratios lower than 1:4) mechanism is also known to induce gentle transformations to the prominence of the remnant bulge (Aguerri et al., 2001; Eliche-Moral et al., 2006; Eliche-Moral et al., 2011), producing in all cases an increase of the Sérsic index. The stellar kinematics of the bulge remnants after dry minor merger accretion of galaxy satellites was studied by Tapia et al. (2014). They found that the net effect of multiple minor mergers is to increase (or keep) the ratio of the bulges. Therefore, the combination of the kinematic and photometric evolution of bulges due to minor mergers leads to a scenario where there might be a lack of correlation between the morpho-kinematics of the remnant bulges, and in extreme cases to a scenario where high Sérsic index bulges might have large angular momentum values.
Internal secular evolution processes, such as those induced by the presence of a bar or spiral arms in an unstable disc, are thought to produce disc-like bulges (Kormendy & Kennicutt, 2004). In this picture, non-axisymmetric galaxy structures such as bars redistribute the angular momentum of disc material and thereby they are responsible for an efficient transport of gas into the central bulge region (Pfenniger & Norman, 1990; Friedli & Benz, 1995). The stellar kinematics of these disc-like bulges is expected to be dominated by rotation with a structure similar to an oblate ellipsoid. Most of the galaxies in our sample host a stellar bar (72%) and we find some low-Sérsic index bulges with relatively large values of and in our sample that might be considered compatible with an internal secular evolution origin. We investigated a possible relation between the presence of a bar and the rotational support ( and ) of our bulges but none was found. The lack of relation could be explained if bar-induced secular evolution is not efficient in building new central structures in S0 galaxies. This scenario needs either a deficit of gas in the outer disc (see Masters et al., 2010) or an inefficient gas inflow and posterior star formation. de Lorenzo-Cáceres et al. (2013) already suggested a minor role of bar-induced secular evolution in the formation of new central structures. In addition, recent results by Seidel et al. (2015) confirmed that more than 50% of the bulge mass was created at high redshift and not due to secular evolution.
Based on the morpho-kinematic properties derived for our sample of S0 bulges it seems unlikely that they were mainly formed through secular processes induced by bars. On the other hand, dissipational processes taking place at high redshift such as major galaxy mergers or coalescence of star-forming clumps are favoured. The relative influence of these two mechanisms and the role of minor mergers on the observed properties of our bulges is difficult to evaluate, and further high-resolution cosmological simulations are necessary to address this problem.
7.3 Implications on S0 formation
In Sect. 4 we discussed the local and global environment where the S0 galaxies in our sample live. We found that none of the S0s belong to a known cluster structure, and that the majority of our S0 galaxies live in a low-density local environment similar to that of the field or loose groups. Most of the proposed mechanisms able to transform a star-forming spiral galaxy into a passive S0 are related to high-density environments: galaxy harassment (Moore et al., 1996; Moore et al., 1999; Aguerri & González-García, 2009), ram pressure stripping (Gunn & Gott, 1972; Quilis et al., 2000; Bekki, 2009), starvation (Bekki et al., 2002), or gravitational heating (Khochfar & Ostriker, 2008). Therefore, a suggested path of S0 formation invoking a quenching of star-formation through any of these mechanisms, and a later fading of spiral galaxies into S0s is unlikely to be happening in our galaxies. In the fading scenario due to high-density environments, most of the previous processes only affect either the gas-phase of the galaxy (i.e., ram pressure stripping, starvation; Abadi et al., 1999) or the outer stellar discs (i.e., harassment Aguerri & González-García, 2009), therefore leaving unchanged the stellar angular momentum of the galaxy. Bulges of late-type spirals have been found to be well represented by exponential surface-brightness (Laurikainen et al., 2010) and with stellar kinematics typical of a disc-like structure (Ganda et al., 2006). As previously shown, we found that the morphology and kinematics of our bulges are not correlated, with photometrically exponential bulges not showing the largest rotational support, pointing against a simple transition from spirals to S0 in our sample. A similar argument in terms of the global galaxy properties has recently been proposed by Querejeta et al. (2015). They claim that the stellar angular momentum and concentration of late-type spiral galaxies are incompatible with those of S0s, thus concluding that fading alone cannot satisfactorily explain the evolution from spirals into S0s.
The star-formation quenching of spiral galaxies is a process associated not only to high-density environments, but could also be related to galaxy internal processes (see Aguerri, 2012, and references therein). AGN feedback has been suggested to be efficient in transforming early-type spiral galaxies located in the blue cloud into galaxies located close to or on the red sequence (Schawinski et al., 2006). However, stellar angular momentum studies are usually not compatible with a simple quenching mechanism, and dynamical evolution of the system is needed to explain the observations (Querejeta et al., 2015). Another internal mechanism able to modify the star formation and dynamics of the galaxy centre is related to bar structures. If gas is efficiently driven by bars to the galaxy centre, it could accelerate the depletion of the gas supply from the outer disc. If this process is not balanced by an increased inflow of cosmological gas, this would ultimately produce a quiescent red barred galaxy as those studied in this paper (Cheung et al., 2013; Masters et al., 2011). Nevertheless the likely massive disc-like bulges resulting from this process (Kormendy & Kennicutt, 2004) are not the main population in our sample. Still, unresolved inner rotating structures could still be present in our galaxies and this scenario cannot be ruled out.
We have discussed the most likely formation scenarios for our sample of field S0 galaxies. We suggest that the global properties of our S0 galaxies also point toward a formation mechanism based on dissipational processes at high redshift; either major mergers or gas accretion onto gravitationally unstable disc galaxies, with a possible later evolution due to minor merger accretion. This picture is also consistent with a mass-related evolution of S0s (van den Bergh, 2009; Barway et al., 2013) and the general picture for the evolution of early-type galaxies proposed in Cappellari et al. (2013). According to this view, massive S0 galaxies have likely formed at an early epoch through major mergers, as it is believed to be the case with elliptical galaxies. On the other hand, faint S0 galaxies have likely formed through secular processes. We cannot discard that faint S0s would have been originated from spiral galaxies which in the process of their interaction with dense environments had their star formation quenched due to stripping of gas (Aragón-Salamanca et al., 2006; Barr et al., 2007). Our sample of S0 galaxies target only the high mass end of the S0 family (see Fig. 6) and therefore would be compatible with this mass-dependent idea of S0 formation.
8 Conclusions
We have studied the photometric and kinematic properties of a sample of 34 S0 bulges drawn from the IFS CALIFA survey. Extensive work has been devoted to select our final sample of bona-fide S0 galaxies. We developed a two-step method to identify S0 galaxies. First, all visually classified elliptical and S0 galaxies in the CALIFA sample pass through a logical filtering in order to provide the best fit model with a physical meaning. Then, the final model selection was done using the statistical criteria. The aim was to obtain a well-defined sample of canonical S0 galaxies, i.e., composed by a central bulge and an outer disc dominating the light in the galaxy outskirts.
Our final sample was found to be representative of a particular type of S0s. All galaxies have high stellar masses (), they lie on the red sequence, and they live in relatively isolated environments with a local density similar to that of the field and loose groups.
A careful multi-component photometric decomposition of the sample was performed to derive the bulge parameters using the GASP2D code. The structural parameters of the S0 bulges were used to both provide the galaxy region from which the stellar kinematics were extracted and, combined with the galaxy dynamics, to constrain the formation scenarios of S0 bulges.
Using the CALIFA IFS data we have explored the stellar kinematics of our S0 bulges measuring the vs and vs diagrams within 1 of the bulge. We quantified the impact of the underlying large scale disc in the bulge kinematic measurements using both mock spectroscopic datacubes and Schwarzschild dynamical modelling of the galaxies. We found that six bulges in the sample were heavily contaminated and they were removed from the analysis. The remaining bulges (28 galaxies) were corrected from disc contamination and deprojected to the edge-on line of sight using the statistical approach.
We found that our S0 bulges show a large range of values for the deprojected and values. We also found a lack of correlation between the photometric ( and ) and kinematic ( and ) properties of the S0 bulges. This behaviour might be puzzling in the current picture of bulge formation where classical bulges are expected to be photometrically modelled with high Sérsic index and a kinematics dominated by random motions, whereas secularly-built bulges are expected to be disc-like in both their light distribution () and kinematics (dominated by rotation). We have found that purely photometric diagnostics separating disc-like from classical bulges might not be applicable to S0 bulges. We discuss that the observed photometric and stellar kinematic properties of the majority of our S0 bulges are hard to reconcile with the predictions of numerical simulations for an internal secular evolution scenario driven by bars or spiral arms.
In summary, we suggest that the morpho-kinematic properties of our S0 bulges might be explained if field S0 galaxies were mainly formed through dissipational processes happening at an early stage of their evolution, either through wet major mergers or coalescence of giant star-forming clumps. Then, a possible later evolution might imply that galaxies evolved secularly through both external accretion of satellite galaxies (inducing changes in the bulge properties) and internal bar-induced mechanisms in gas-devoided discs (with little effect in the formation of new central structures). These results seem to also be supported by the global properties of our S0 galaxies, i.e., their high masses and relatively isolated environment. However, a proper understanding of the dominant formation process of S0 galaxies will not be achieved until high-resolution cosmological simulations resolving the bulge structure and kinematics will be studied.
Acknowledgements
We would like to thank the referee for useful comments and suggestions. JMA and VW acknowledges support from the European Research Council Starting Grant (SEDmorph; P.I. V. Wild). JMA and JALA acknowledge support from the Spanish Ministerio de Economia y Competitividad (MINECO) by the grant AYA2013-43188-P. J. F-B. from grant AYA2016-77237-C3-1-P from the Spanish Ministry of Economy and Competitiveness (MINECO). J. F-B and GvdV acknowledge finantial support from the FP7 Marie Curie Actions of the European Commission, via the Initial Training Network DAGAL under REA grant agreement number 289313. TRL and EF acknowledge the support from the projects AYA2014-53506-P and JA-FQM-108. AdLC acknowledges support from the UK Science and Technology Facilities Council (STFC) grant ST/J001651/1 and from the Spanish Ministry of Economy and Competitiveness (MINECO) grant AYA2011-24728. EMC is supported by Padua University through grants 60A02-5857/13, 60A02-5833/14, 60A02-4434/15, and CPDA133894. RGD and RGB acknowledge the support from the project AyA2014-57490-P y JA-FQM-2828. Support for LG is provided by the Ministry of Economy, Development, and Tourism’s Millennium Science Initiative through grant IC120009 awarded to The Millennium Institute of Astrophysics (MAS), and CONICYT through FONDECYT grant 3140566. RAM acknowledges support by the Swiss National Science Foundation. IIM acknowledges financial support from the Spanish AEI and European FEDER fundings through the research project AYA2016-76682-C3-1P. This paper is based on data from the Calar Alto Legacy Integral Field Area Survey, CALIFA (http://califa.caha.es), funded by the Spanish Ministery of Science under grant ICTS-2009-10, and the Centro Astronómico Hispano-Alemán.
Based on observations collected at the Centro Astronómico Hispano Alemán (CAHA) at Calar Alto, operated jointly by the Max-Planck Institut für Astronomie and the Instituto de Astrofísica de Andalucía (CSIC)
References
- Abadi et al. (1999) Abadi M. G., Moore B., Bower R. G., 1999, MNRAS, 308, 947
- Abazajian et al. (2009) Abazajian K. N., et al., 2009, ApJS, 182, 543
- Abraham et al. (1996) Abraham R. G., van den Bergh S., Glazebrook K., Ellis R. S., Santiago B. X., Surma P., Griffiths R. E., 1996, ApJS, 107, 1
- Aguerri (2012) Aguerri J. A. L., 2012, Advances in Astronomy, 2012, 382674
- Aguerri & González-García (2009) Aguerri J. A. L., González-García A. C., 2009, A&A, 494, 891
- Aguerri et al. (2001) Aguerri J. A. L., Balcells M., Peletier R. F., 2001, A&A, 367, 428
- Aguerri et al. (2005) Aguerri J. A. L., Elias-Rosa N., Corsini E. M., Muñoz-Tuñón C., 2005, A&A, 434, 109
- Aguerri et al. (2009) Aguerri J. A. L., Méndez-Abreu J., Corsini E. M., 2009, A&A, 495, 491
- Aguerri et al. (2015) Aguerri J. A. L., et al., 2015, A&A, 576, A102
- Ahn et al. (2014) Ahn C. P., et al., 2014, ApJS, 211, 17
- Akaike (1974) Akaike H., 1974, IEEE Transactions on Automatic Control
- Allen et al. (2006) Allen P. D., Driver S. P., Graham A. W., Cameron E., Liske J., de Propris R., 2006, MNRAS, 371, 2
- Aragón-Salamanca et al. (2006) Aragón-Salamanca A., Bedregal A. G., Merrifield M. R., 2006, A&A, 458, 101
- Athanassoula (2005) Athanassoula E., 2005, MNRAS, 358, 1477
- Athanassoula et al. (2015) Athanassoula E., Laurikainen E., Salo H., Bosma A., 2015, MNRAS, 454, 3843
- Balogh et al. (2000) Balogh M. L., Navarro J. F., Morris S. L., 2000, ApJ, 540, 113
- Barazza et al. (2009) Barazza F. D., et al., 2009, A&A, 497, 713
- Barr et al. (2007) Barr J. M., Bedregal A. G., Aragón-Salamanca A., Merrifield M. R., Bamford S. P., 2007, A&A, 470, 173
- Barrera-Ballesteros et al. (2014) Barrera-Ballesteros J. K., et al., 2014, A&A, 568, A70
- Barrera-Ballesteros et al. (2015) Barrera-Ballesteros J. K., et al., 2015, A&A, 579, A45
- Barway et al. (2013) Barway S., Wadadekar Y., Vaghmare K., Kembhavi A. K., 2013, MNRAS, 432, 430
- Bekki (1998) Bekki K., 1998, ApJ, 502, L133
- Bekki (2009) Bekki K., 2009, MNRAS, 399, 2221
- Bekki & Couch (2011) Bekki K., Couch W. J., 2011, MNRAS, 415, 1783
- Bekki et al. (2002) Bekki K., Couch W. J., Shioya Y., 2002, ApJ, 577, 651
- Bender et al. (1992) Bender R., Burstein D., Faber S. M., 1992, ApJ, 399, 462
- Bertin & Arnouts (1996) Bertin E., Arnouts S., 1996, A&AS, 117, 393
- Binney (2005) Binney J., 2005, MNRAS, 363, 937
- Bournaud et al. (2007) Bournaud F., Elmegreen B. G., Elmegreen D. M., 2007, ApJ, 670, 237
- Bournaud et al. (2011) Bournaud F., et al., 2011, ApJ, 730, 4
- Breddels & Helmi (2014) Breddels M. A., Helmi A., 2014, ApJ, 791, L3
- Brooks & Christensen (2016) Brooks A., Christensen C., 2016, Galactic Bulges, 418, 317
- Buta (2013) Buta R. J., 2013, Galaxy Morphology. p. 155
- Buta et al. (2015) Buta R. J., et al., 2015, ApJS, 217, 32
- Cappellari & Copin (2003) Cappellari M., Copin Y., 2003, MNRAS, 342, 345
- Cappellari & Emsellem (2004) Cappellari M., Emsellem E., 2004, PASP, 116, 138
- Cappellari et al. (2011) Cappellari M., et al., 2011, MNRAS, 416, 1680
- Cappellari et al. (2013) Cappellari M., et al., 2013, MNRAS, 432, 1862
- Catalán-Torrecilla et al. (2015) Catalán-Torrecilla C., et al., 2015, A&A, 584, A87
- Cheung et al. (2013) Cheung E., et al., 2013, ApJ, 779, 162
- Christensen et al. (2014) Christensen C. R., Brooks A. M., Fisher D. B., Governato F., McCleary J., Quinn T. R., Shen S., Wadsley J., 2014, MNRAS, 440, L51
- Cid Fernandes et al. (2013) Cid Fernandes R., et al., 2013, A&A, 557, A86
- Costantin et al. (2017) Costantin L., Méndez-Abreu J., Corsini E. M., Morelli L., Aguerri J. A. L., Dalla Bontà E., Pizzella A., 2017, A&A, 601, A84
- Courteau et al. (1996) Courteau S., de Jong R. S., Broeils A. H., 1996, ApJ, 457, L73
- Djorgovski & Davis (1987) Djorgovski S., Davis M., 1987, ApJ, 313, 59
- Dressler et al. (1987) Dressler A., Lynden-Bell D., Burstein D., Davies R. L., Faber S. M., Terlevich R., Wegner G., 1987, ApJ, 313, 42
- Eggen et al. (1962) Eggen O. J., Lynden-Bell D., Sandage A. R., 1962, ApJ, 136, 748
- Eliche-Moral et al. (2006) Eliche-Moral M. C., Balcells M., Aguerri J. A. L., González-García A. C., 2006, A&A, 457, 91
- Eliche-Moral et al. (2011) Eliche-Moral M. C., González-García A. C., Balcells M., Aguerri J. A. L., Gallego J., Zamorano J., Prieto M., 2011, A&A, 533, A104
- Elmegreen et al. (2007) Elmegreen D. M., Elmegreen B. G., Ravindranath S., Coe D. A., 2007, ApJ, 658, 763
- Elmegreen et al. (2008) Elmegreen B. G., Bournaud F., Elmegreen D. M., 2008, ApJ, 688, 67
- Emsellem et al. (2007) Emsellem E., et al., 2007, MNRAS, 379, 401
- Emsellem et al. (2011) Emsellem E., et al., 2011, MNRAS, 414, 888
- Erwin et al. (2005) Erwin P., Beckman J. E., Pohlen M., 2005, ApJ, 626, L81
- Erwin et al. (2008) Erwin P., Pohlen M., Beckman J. E., 2008, AJ, 135, 20
- Erwin et al. (2015) Erwin P., et al., 2015, MNRAS, 446, 4039
- Eskridge et al. (2000) Eskridge P. B., et al., 2000, AJ, 119, 536
- Faber & Jackson (1976) Faber S. M., Jackson R. E., 1976, ApJ, 204, 668
- Fabricius et al. (2012) Fabricius M. H., Saglia R. P., Fisher D. B., Drory N., Bender R., Hopp U., 2012, ApJ, 754, 67
- Falcón-Barroso (2016) Falcón-Barroso J., 2016, Galactic Bulges, 418, 161
- Falcón-Barroso et al. (2002) Falcón-Barroso J., Peletier R. F., Balcells M., 2002, MNRAS, 335, 741
- Falcón-Barroso et al. (2003) Falcón-Barroso J., Balcells M., Peletier R. F., Vazdekis A., 2003, A&A, 405, 455
- Falcón-Barroso et al. (2017) Falcón-Barroso J., et al., 2017, A&A, 597, A48
- Fisher & Drory (2008) Fisher D. B., Drory N., 2008, AJ, 136, 773
- Fisher & Drory (2010) Fisher D. B., Drory N., 2010, ApJ, 716, 942
- Fisher & Drory (2016) Fisher D. B., Drory N., 2016, Galactic Bulges, 418, 41
- Freeman (1970) Freeman K. C., 1970, ApJ, 160, 811
- Friedli & Benz (1995) Friedli D., Benz W., 1995, A&A, 301, 649
- Gadotti (2008) Gadotti D. A., 2008, MNRAS, 384, 420
- Gadotti (2009) Gadotti D. A., 2009, MNRAS, 393, 1531
- Galbany et al. (2014) Galbany L., et al., 2014, A&A, 572, A38
- Ganda et al. (2006) Ganda K., Falcón-Barroso J., Peletier R. F., Cappellari M., Emsellem E., McDermid R. M., de Zeeuw P. T., Carollo C. M., 2006, MNRAS, 367, 46
- García-Benito et al. (2015) García-Benito R., et al., 2015, A&A, 576, A135
- García-Lorenzo et al. (2015) García-Lorenzo B., et al., 2015, A&A, 573, A59
- González Delgado et al. (2014a) González Delgado R. M., et al., 2014a, A&A, 562, A47
- González Delgado et al. (2014b) González Delgado R. M., et al., 2014b, ApJ, 791, L16
- González Delgado et al. (2015) González Delgado R. M., et al., 2015, A&A, 581, A103
- González Delgado et al. (2016) González Delgado R. M., et al., 2016, A&A, 590, A44
- Governato et al. (2009) Governato F., et al., 2009, MNRAS, 398, 312
- Guedes et al. (2013) Guedes J., Mayer L., Carollo M., Madau P., 2013, ApJ, 772, 36
- Gunn & Gott (1972) Gunn J. E., Gott III J. R., 1972, ApJ, 176, 1
- Gutiérrez et al. (2011) Gutiérrez L., Erwin P., Aladro R., Beckman J. E., 2011, AJ, 142, 145
- Hinojosa-Goñi et al. (2016) Hinojosa-Goñi R., Muñoz-Tuñón C., Méndez-Abreu J., 2016, A&A, 592, A122
- Holmes et al. (2015) Holmes L., et al., 2015, MNRAS, 451, 4397
- Hopkins et al. (2009) Hopkins P. F., Cox T. J., Dutta S. N., Hernquist L., Kormendy J., Lauer T. R., 2009, ApJS, 181, 135
- Hopkins et al. (2010) Hopkins P. F., et al., 2010, ApJ, 715, 202
- Hopkins et al. (2012) Hopkins P. F., Kereš D., Murray N., Quataert E., Hernquist L., 2012, MNRAS, 427, 968
- Hubble (1936) Hubble E. P., 1936, Realm of the Nebulae
- Immeli et al. (2004) Immeli A., Samland M., Gerhard O., Westera P., 2004, A&A, 413, 547
- Kannappan et al. (2009) Kannappan S. J., Guie J. M., Baker A. J., 2009, AJ, 138, 579
- Kass & Raftery (1995) Kass R. E., Raftery A. E., 1995, Journal of the American Statistical Association
- Kauffmann (1996) Kauffmann G., 1996, MNRAS, 281, 487
- Kehrig et al. (2012) Kehrig C., et al., 2012, A&A, 540, A11
- Keselman & Nusser (2012) Keselman J. A., Nusser A., 2012, MNRAS, 424, 1232
- Khochfar & Ostriker (2008) Khochfar S., Ostriker J. P., 2008, ApJ, 680, 54
- Kormendy (1977) Kormendy J., 1977, ApJ, 218, 333
- Kormendy (1985) Kormendy J., 1985, ApJ, 295, 73
- Kormendy & Bender (2012) Kormendy J., Bender R., 2012, ApJS, 198, 2
- Kormendy & Kennicutt (2004) Kormendy J., Kennicutt Jr. R. C., 2004, ARA&A, 42, 603
- Krajnović et al. (2006) Krajnović D., Cappellari M., de Zeeuw P. T., Copin Y., 2006, MNRAS, 366, 787
- Larson et al. (1980) Larson R. B., Tinsley B. M., Caldwell C. N., 1980, ApJ, 237, 692
- Laurikainen et al. (2005) Laurikainen E., Salo H., Buta R., 2005, MNRAS, 362, 1319
- Laurikainen et al. (2010) Laurikainen E., Salo H., Buta R., Knapen J. H., Comerón S., 2010, MNRAS, 405, 1089
- Laurikainen et al. (2013) Laurikainen E., Salo H., Athanassoula E., Bosma A., Buta R., Janz J., 2013, MNRAS, 430, 3489
- Laurikainen et al. (2014) Laurikainen E., Salo H., Athanassoula E., Bosma A., Herrera-Endoqui M., 2014, MNRAS, 444, L80
- MacArthur et al. (2003) MacArthur L. A., Courteau S., Holtzman J. A., 2003, ApJ, 582, 689
- MacKay (2003) MacKay D. J. C., 2003, Information Theory, Inference, and Learning Algorithms
- Marino et al. (2013) Marino R. A., et al., 2013, A&A, 559, A114
- Marino et al. (2016) Marino R. A., et al., 2016, A&A, 585, A47
- Martín-Navarro et al. (2015) Martín-Navarro I., et al., 2015, ApJ, 806, L31
- Masters et al. (2010) Masters K. L., et al., 2010, MNRAS, 405, 783
- Masters et al. (2011) Masters K. L., et al., 2011, MNRAS, 411, 2026
- Méndez-Abreu (2016) Méndez-Abreu J., 2016, Galactic Bulges, 418, 15
- Méndez-Abreu et al. (2008) Méndez-Abreu J., Aguerri J. A. L., Corsini E. M., Simonneau E., 2008, A&A, 478, 353
- Méndez-Abreu et al. (2010a) Méndez-Abreu J., Simonneau E., Aguerri J. A. L., Corsini E. M., 2010a, A&A, 521, A71+
- Méndez-Abreu et al. (2010b) Méndez-Abreu J., Sánchez-Janssen R., Aguerri J. A. L., 2010b, ApJ, 711, L61
- Méndez-Abreu et al. (2012) Méndez-Abreu J., Sánchez-Janssen R., Aguerri J. A. L., Corsini E. M., Zarattini S., 2012, ApJ, 761, L6
- Méndez-Abreu et al. (2014) Méndez-Abreu J., Debattista V. P., Corsini E. M., Aguerri J. A. L., 2014, A&A, 572, A25
- Méndez-Abreu et al. (2017) Méndez-Abreu J., et al., 2017, A&A, 598, A32
- Möllenhoff & Heidt (2001) Möllenhoff C., Heidt J., 2001, A&A, 368, 16
- Moore et al. (1996) Moore B., Katz N., Lake G., Dressler A., Oemler A., 1996, Nature, 379, 613
- Moore et al. (1998) Moore B., Lake G., Katz N., 1998, ApJ, 495, 139
- Moore et al. (1999) Moore B., Lake G., Quinn T., Stadel J., 1999, MNRAS, 304, 465
- Naab et al. (2014) Naab T., et al., 2014, MNRAS, 444, 3357
- Nigoche-Netro et al. (2008) Nigoche-Netro A., Ruelas-Mayorga A., Franco-Balderas A., 2008, A&A, 491, 731
- Noguchi (1999) Noguchi M., 1999, ApJ, 514, 77
- Okamoto (2013) Okamoto T., 2013, MNRAS, 428, 718
- Oser et al. (2012) Oser L., Naab T., Ostriker J. P., Johansson P. H., 2012, ApJ, 744, 63
- Papaderos et al. (2013) Papaderos P., et al., 2013, A&A, 555, L1
- Pérez et al. (2013) Pérez E., et al., 2013, ApJ, 764, L1
- Pfenniger & Norman (1990) Pfenniger D., Norman C., 1990, ApJ, 363, 391
- Pohlen & Trujillo (2006) Pohlen M., Trujillo I., 2006, A&A, 454, 759
- Querejeta et al. (2015) Querejeta M., et al., 2015, A&A
- Quilis et al. (2000) Quilis V., Moore B., Bower R., 2000, Science, 288, 1617
- Rodríguez & Padilla (2013) Rodríguez S., Padilla N. D., 2013, MNRAS, 434, 2153
- Ruiz-Lara et al. (2017) Ruiz-Lara T., et al., 2017, A&A, 604, A4
- Salo et al. (2015) Salo H., et al., 2015, ApJS, 219, 4
- Salucci et al. (2007) Salucci P., Lapi A., Tonini C., Gentile G., Yegorova I., Klein U., 2007, MNRAS, 378, 41
- Sánchez-Blázquez (2016) Sánchez-Blázquez P., 2016, Galactic Bulges, 418, 127
- Sánchez-Blázquez et al. (2006) Sánchez-Blázquez P., et al., 2006, MNRAS, 371, 703
- Sánchez-Blázquez et al. (2014) Sánchez-Blázquez P., et al., 2014, A&A, 570, A6
- Sánchez-Menguiano et al. (2016) Sánchez-Menguiano L., et al., 2016, A&A, 587, A70
- Sánchez et al. (2012) Sánchez S. F., et al., 2012, A&A, 538, A8
- Sánchez et al. (2013) Sánchez S. F., et al., 2013, A&A, 554, A58
- Sánchez et al. (2014) Sánchez S. F., et al., 2014, A&A, 563, A49
- Sánchez et al. (2015) Sánchez S. F., et al., 2015, A&A, 574, A47
- Sánchez et al. (2016) Sánchez S. F., et al., 2016, A&A, 594, A36
- Schawinski et al. (2006) Schawinski K., et al., 2006, Nature, 442, 888
- Schlegel et al. (1998) Schlegel D. J., Finkbeiner D. P., Davis M., 1998, ApJ, 500, 525
- Schwarz (1978) Schwarz G. E., 1978, Annals of Statistics
- Schwarzschild (1979) Schwarzschild M., 1979, ApJ, 232, 236
- Seidel et al. (2015) Seidel M. K., et al., 2015, MNRAS, 446, 2837
- Sérsic (1968) Sérsic J. L., 1968, Atlas de galaxias australes
- Simard et al. (2011) Simard L., Mendel J. T., Patton D. R., Ellison S. L., McConnachie A. W., 2011, ApJS, 196, 11
- Singh et al. (2013) Singh R., et al., 2013, A&A, 558, A43
- Tabor et al. (2017) Tabor M., Merrifield M., Aragón-Salamanca A., Cappellari M., Bamford S. P., Johnston E., 2017, MNRAS, 466, 2024
- Tapia et al. (2014) Tapia T., et al., 2014, A&A, 565, A31
- Valdes et al. (2004) Valdes F., Gupta R., Rose J. A., Singh H. P., Bell D. J., 2004, ApJS, 152, 251
- Walcher et al. (2014) Walcher C. J., et al., 2014, A&A, 569, A1
- Wild et al. (2014) Wild V., et al., 2014, A&A, 567, A132
- Wilman et al. (2009) Wilman D. J., Oemler Jr. A., Mulchaey J. S., McGee S. L., Balogh M. L., Bower R. G., 2009, ApJ, 692, 298
- Zhu et al. (2017) Zhu L., et al., 2017, preprint, (arXiv:1709.06649)
- de Lorenzo-Cáceres et al. (2012) de Lorenzo-Cáceres A., Vazdekis A., Aguerri J. A. L., Corsini E. M., Debattista V. P., 2012, MNRAS, 420, 1092
- de Lorenzo-Cáceres et al. (2013) de Lorenzo-Cáceres A., Falcón-Barroso J., Vazdekis A., 2013, MNRAS, 431, 2397
- van de Ven et al. (2006) van de Ven G., van den Bosch R. C. E., Verolme E. K., de Zeeuw P. T., 2006, A&A, 445, 513
- van den Bergh (1976) van den Bergh S., 1976, ApJ, 206, 883
- van den Bergh (2009) van den Bergh S., 2009, ApJ, 702, 1502
- van den Bergh et al. (1996) van den Bergh S., Abraham R. G., Ellis R. S., Tanvir N. R., Santiago B. X., Glazebrook K. G., 1996, AJ, 112, 359
- van den Bosch et al. (2008) van den Bosch R. C. E., van de Ven G., Verolme E. K., Cappellari M., de Zeeuw P. T., 2008, MNRAS, 385, 647
Appendix A Structural parameters of the galaxy sample
| Galaxy | Band | ||||||
|---|---|---|---|---|---|---|---|
| (mag/″2) | (″) | (kpc) | (∘) | ||||
| (1) | (2) | (3) | (4) | (5) | (6) | (7) | (8) |
| IC2341 | 19.60.2 | 2.90.3 | 1.00.1 | 1.30.1 | 0.520.03 | 74 | |
| IC2341 | 18.90.2 | 3.00.3 | 1.00.1 | 1.40.1 | 0.550.03 | 54 | |
| IC2341 | 18.50.2 | 3.00.3 | 1.00.1 | 1.50.1 | 0.540.03 | 54 | |
| MCG-01-52-012 | 19.20.2 | 3.50.4 | 0.90.1 | 1.60.1 | 0.480.01 | 863 | |
| MCG-01-52-012 | 19.40.2 | 3.30.4 | 0.80.1 | 1.60.1 | 0.460.01 | 853 | |
| MCG-01-52-012 | 18.60.2 | 3.50.4 | 0.90.1 | 1.70.1 | 0.460.01 | 863 | |
| NGC0364 | 19.00.3 | 1.50.3 | 0.50.1 | 1.40.2 | 0.850.05 | 426 | |
| NGC0364 | 18.30.3 | 1.70.3 | 0.50.1 | 1.40.2 | 0.900.05 | 416 | |
| NGC0364 | 17.90.3 | 1.70.4 | 0.50.1 | 1.60.2 | 0.870.05 | 456 | |
| NGC0515 | 18.60.3 | 1.70.3 | 0.50.1 | 1.50.2 | 0.840.05 | 1185 | |
| NGC0515 | 18.90.3 | 1.70.3 | 0.50.1 | 1.50.2 | 0.840.05 | 1186 | |
| NGC0515 | 17.70.3 | 1.60.3 | 0.50.1 | 1.80.3 | 0.820.05 | 1166 | |
| NGC0528 | 19.90.2 | 4.00.4 | 1.20.1 | 4.30.4 | 0.850.03 | 904 | |
| NGC0528 | 19.60.2 | 3.40.4 | 1.00.1 | 3.90.4 | 0.850.03 | 804 | |
| NGC0528 | 19.40.2 | 4.20.5 | 1.20.1 | 4.10.4 | 0.830.03 | 714 | |
| NGC0677 | 20.30.1 | 4.70.3 | 1.50.1 | 2.10.1 | 0.900.01 | 332 | |
| NGC0677 | 19.50.1 | 5.00.3 | 1.60.1 | 2.40.1 | 0.910.01 | 292 | |
| NGC0677 | 19.00.1 | 5.00.4 | 1.60.1 | 2.30.1 | 0.920.01 | 322 | |
| NGC0842 | 18.70.1 | 2.10.1 | 0.50.1 | 2.10.1 | 0.660.02 | 1383 | |
| NGC0842 | 18.20.1 | 2.40.1 | 0.60.1 | 2.50.1 | 0.660.02 | 1393 | |
| NGC0842 | 17.70.1 | 2.20.1 | 0.50.1 | 2.60.1 | 0.640.02 | 1383 | |
| NGC0924 | 20.20.3 | 3.10.6 | 0.90.2 | 4.00.6 | 0.720.05 | 516 | |
| NGC0924 | 20.00.3 | 4.80.6 | 1.30.3 | 4.80.7 | 0.650.05 | 566 | |
| NGC0924 | 19.10.3 | 3.70.8 | 1.00.2 | 5.50.8 | 0.640.05 | 586 | |
| NGC1211 | 20.60.1 | 6.30.4 | 1.20.1 | 2.40.1 | 0.910.02 | 1693 | |
| NGC1211 | 19.50.1 | 4.80.4 | 1.00.1 | 2.20.1 | 0.990.02 | 1753 | |
| NGC1211 | 19.30.1 | 6.10.4 | 1.20.1 | 2.50.1 | 0.940.02 | 1643 | |
| NGC1349 | 20.50.2 | 2.20.2 | 0.90.1 | 1.50.1 | 0.940.01 | 983 | |
| NGC1349 | 20.30.2 | 3.60.2 | 1.40.2 | 3.00.2 | 0.950.01 | 983 | |
| NGC1349 | 19.40.2 | 3.20.4 | 1.30.1 | 2.40.1 | 0.940.01 | 983 | |
| NGC1645 | 18.50.3 | 1.90.4 | 0.60.1 | 0.80.1 | 0.670.05 | 896 | |
| NGC1645 | 18.10.3 | 1.80.4 | 0.60.1 | 0.90.1 | 0.630.05 | 896 | |
| NGC1645 | 17.60.3 | 1.80.4 | 0.60.1 | 0.90.1 | 0.620.05 | 886 | |
| NGC1665 | 19.50.1 | 2.10.2 | 0.40.1 | 2.80.1 | 0.770.01 | 522 | |
| NGC1665 | 18.90.1 | 2.30.2 | 0.40.1 | 3.00.1 | 0.790.01 | 562 | |
| NGC1665 | 18.70.1 | 2.50.2 | 0.40.1 | 3.40.1 | 0.790.01 | 542 | |
| NGC2476 | 19.00.1 | 2.40.2 | 0.60.1 | 2.30.1 | 0.700.02 | 1454 | |
| NGC2476 | 18.00.1 | 2.30.2 | 0.60.1 | 2.30.1 | 0.700.02 | 1424 | |
| NGC2476 | 17.70.1 | 2.50.2 | 0.60.1 | 2.30.1 | 0.700.02 | 1444 | |
| NGC2592 | 19.40.1 | 3.40.3 | 0.50.1 | 2.30.1 | 0.820.01 | 582 | |
| NGC2592 | 18.80.1 | 4.00.3 | 0.60.1 | 3.30.1 | 0.780.01 | 582 | |
| NGC2592 | 18.10.1 | 3.50.3 | 0.50.1 | 2.60.1 | 0.790.01 | 582 | |
| NGC2880 | 20.60.1 | 9.10.5 | 1.20.1 | 3.10.1 | 0.750.01 | 1323 | |
| NGC2880 | 19.80.1 | 8.90.5 | 1.10.1 | 3.20.1 | 0.780.01 | 1313 | |
| NGC2880 | 19.20.1 | 7.80.4 | 1.00.1 | 2.90.1 | 0.790.01 | 1293 | |
| NGC3158 | 20.70.1 | 8.40.6 | 3.90.3 | 2.40.1 | 0.770.01 | 712 | |
| NGC3158 | 19.80.1 | 7.90.6 | 3.60.3 | 2.20.1 | 0.780.01 | 712 | |
| NGC3158 | 19.40.1 | 8.00.6 | 3.70.3 | 2.30.1 | 0.780.01 | 712 | |
| NGC3300 | 19.00.2 | 1.60.2 | 0.40.1 | 1.10.1 | 0.760.03 | 1803 | |
| NGC3300 | 18.20.2 | 1.60.2 | 0.40.1 | 1.10.1 | 0.730.03 | 1773 | |
| NGC3300 | 17.90.2 | 1.70.2 | 0.40.1 | 1.20.1 | 0.740.03 | 1763 | |
| NGC4003 | 20.10.3 | 2.70.6 | 1.20.2 | 1.30.2 | 0.650.05 | 1666 | |
| NGC4003 | 19.20.3 | 2.80.6 | 1.20.3 | 1.60.2 | 0.630.05 | 1666 | |
| NGC4003 | 19.10.3 | 3.20.7 | 1.40.3 | 1.40.2 | 0.680.05 | 1666 | |
| NGC5473 | 18.70.1 | 2.90.1 | 0.50.1 | 1.50.1 | 0.910.01 | 1382 | |
| NGC5473 | 17.80.1 | 2.90.1 | 0.50.1 | 1.60.1 | 0.920.01 | 1362 | |
| NGC5473 | 17.50.1 | 2.90.1 | 0.50.1 | 1.60.1 | 0.920.01 | 1372 | |
| NGC5481 | 19.10.1 | 2.60.2 | 0.30.1 | 3.10.2 | 0.930.02 | 1144 | |
| NGC5481 | 19.00.1 | 2.50.2 | 0.30.1 | 2.80.1 | 0.940.02 | 1154 | |
| NGC5481 | 18.30.1 | 2.50.2 | 0.30.1 | 3.00.2 | 0.920.02 | 1144 | |
| NGC5784 | 20.70.1 | 7.30.5 | 2.70.2 | 3.10.1 | 0.670.01 | 752 | |
| NGC5784 | 19.30.1 | 5.20.5 | 1.90.1 | 2.60.1 | 0.690.01 | 742 | |
| NGC5784 | 18.70.1 | 4.70.3 | 1.70.1 | 2.50.1 | 0.710.01 | 752 | |
| NGC5794 | 18.70.3 | 2.00.4 | 0.50.1 | 1.90.3 | 0.870.05 | 25 | |
| NGC5794 | 19.20.3 | 2.20.4 | 0.60.1 | 2.00.3 | 0.950.05 | 35 | |
| NGC5794 | 18.40.3 | 2.30.5 | 0.60.1 | 2.20.3 | 0.980.05 | 1765 | |
| NGC5876 | 19.30.1 | 2.90.2 | 0.70.1 | 1.40.1 | 0.690.02 | 523 | |
| NGC5876 | 18.40.1 | 2.80.2 | 0.70.1 | 1.50.1 | 0.680.02 | 503 | |
| NGC5876 | 17.90.1 | 2.80.2 | 0.70.1 | 1.60.1 | 0.670.02 | 513 | |
| NGC6278 | 19.30.1 | 2.90.2 | 0.60.1 | 2.40.1 | 0.810.02 | 1233 | |
| NGC6278 | 18.20.1 | 2.70.2 | 0.60.1 | 2.40.1 | 0.810.02 | 1223 | |
| NGC6278 | 17.80.1 | 2.80.2 | 0.60.1 | 2.30.1 | 0.800.02 | 1233 | |
| NGC6427 | 19.80.3 | 3.60.7 | 0.90.2 | 2.90.4 | 0.710.05 | 386 | |
| NGC6427 | 18.40.3 | 2.70.7 | 0.60.1 | 2.30.3 | 0.700.05 | 366 | |
| NGC6427 | 18.20.3 | 3.00.6 | 0.70.1 | 2.40.3 | 0.700.05 | 346 | |
| NGC6945 | 19.40.2 | 2.50.3 | 0.60.1 | 2.40.2 | 0.720.03 | 1133 | |
| NGC6945 | 19.10.2 | 3.20.3 | 0.80.1 | 3.70.3 | 0.680.03 | 1163 | |
| NGC6945 | 19.00.2 | 3.90.5 | 1.00.1 | 3.70.3 | 0.680.03 | 1183 | |
| NGC7611 | 17.80.2 | 1.20.1 | 0.20.1 | 1.60.1 | 0.770.03 | 1373 | |
| NGC7611 | 17.10.2 | 1.30.1 | 0.30.1 | 1.50.1 | 0.790.03 | 1433 | |
| NGC7611 | 16.60.2 | 1.20.2 | 0.30.1 | 1.70.1 | 0.760.03 | 1423 | |
| NGC7619 | 20.60.1 | 10.80.3 | 2.60.1 | 3.00.1 | 0.740.00 | 901 | |
| NGC7619 | 19.60.1 | 10.50.3 | 2.50.1 | 3.00.1 | 0.730.00 | 901 | |
| NGC7619 | 19.60.1 | 13.00.4 | 3.10.1 | 3.50.1 | 0.730.00 | 901 | |
| NGC7623 | 19.70.2 | 3.90.5 | 0.90.1 | 1.90.2 | 0.750.03 | 1735 | |
| NGC7623 | 19.00.2 | 4.00.5 | 1.00.1 | 2.00.2 | 0.760.03 | 1735 | |
| NGC7623 | 18.50.2 | 4.00.5 | 0.90.1 | 1.90.2 | 0.750.03 | 1735 | |
| NGC7671 | 18.80.1 | 1.80.1 | 0.50.1 | 2.00.1 | 0.870.02 | 1473 | |
| NGC7671 | 17.80.1 | 1.70.1 | 0.50.1 | 2.10.1 | 0.820.02 | 1423 | |
| NGC7671 | 17.30.1 | 1.70.1 | 0.50.1 | 1.80.1 | 0.820.02 | 1423 | |
| UGC01271 | 19.50.3 | 1.90.4 | 0.60.1 | 1.70.2 | 0.720.05 | 906 | |
| UGC01271 | 18.40.3 | 1.70.4 | 0.50.1 | 1.30.2 | 0.700.05 | 906 | |
| UGC01271 | 18.30.3 | 2.00.4 | 0.60.1 | 1.70.2 | 0.730.05 | 926 | |
| UGC02222 | 21.00.3 | 4.70.9 | 1.50.3 | 3.20.5 | 0.670.05 | 936 | |
| UGC02222 | 19.80.3 | 3.90.9 | 1.20.2 | 3.10.4 | 0.690.05 | 946 | |
| UGC02222 | 19.60.3 | 4.91.0 | 1.50.3 | 3.50.5 | 0.680.05 | 926 | |
| UGC09629 | 19.80.2 | 2.30.3 | 1.20.1 | 1.80.1 | 0.730.01 | 1253 | |
| UGC09629 | 18.90.2 | 2.30.3 | 1.20.1 | 2.00.1 | 0.710.01 | 1243 | |
| UGC09629 | 18.70.2 | 2.60.3 | 1.30.1 | 2.30.1 | 0.730.01 | 1243 | |
| UGC11228 | 19.50.3 | 2.40.5 | 1.00.2 | 1.60.2 | 0.670.05 | 1726 | |
| UGC11228 | 18.50.3 | 2.40.5 | 0.90.2 | 1.60.2 | 0.650.05 | 1716 | |
| UGC11228 | 18.40.3 | 2.70.6 | 1.10.2 | 2.50.4 | 0.620.05 | 1726 | |
| Note. (1) Galaxy name; (2) SDSS band, (3), (4), (5), (6), (7), and (8) effective surface brightness, effective radius (arcsec), effective radius (kpc), shape parameter, axis ratio, and position angle of the bulge, respectively. |
| Galaxy | Band | |||||||||
|---|---|---|---|---|---|---|---|---|---|---|
| (mag/″2) | (″) | (kpc) | (″) | (kpc) | (″) | (kpc) | (∘) | |||
| (1) | (2) | (3) | (4) | (5) | (6) | (7) | (8) | (9) | (10) | (11) |
| MCG-01-52-012 | 20.50.2 | 8.10.5 | 2.00.1 | - | - | - | - | 0.790.03 | 444 | |
| MCG-01-52-012 | 20.70.2 | 8.00.5 | 2.00.1 | - | - | - | - | 0.790.03 | 474 | |
| MCG-01-52-012 | 19.80.2 | 7.80.5 | 1.90.1 | - | - | - | - | 0.800.03 | 434 | |
| IC2341 | 20.60.1 | 9.70.4 | 3.30.1 | 322 | 11.10.6 | 142 | 4.90.6 | 0.520.01 | 22 | |
| IC2341 | 19.90.1 | 9.90.4 | 3.40.1 | 332 | 11.20.6 | 152 | 5.40.7 | 0.520.01 | 22 | |
| IC2341 | 19.60.1 | 10.00.4 | 3.40.1 | 322 | 11.00.6 | 152 | 5.20.7 | 0.530.01 | 22 | |
| NGC0364 | 21.10.2 | 12.60.5 | 4.00.2 | - | - | - | - | 0.720.02 | 332 | |
| NGC0364 | 20.30.2 | 12.60.5 | 4.00.2 | - | - | - | - | 0.720.02 | 332 | |
| NGC0364 | 19.90.2 | 12.80.5 | 4.10.2 | - | - | - | - | 0.720.02 | 332 | |
| NGC0515 | 20.60.2 | 11.40.5 | 3.70.2 | - | - | - | - | 0.750.02 | 1032 | |
| NGC0515 | 20.90.2 | 11.20.5 | 3.60.2 | - | - | - | - | 0.740.02 | 1052 | |
| NGC0515 | 19.90.2 | 11.70.5 | 3.80.2 | - | - | - | - | 0.760.02 | 1042 | |
| NGC0528 | 18.80.1 | 8.60.4 | 2.60.1 | 292 | 8.90.5 | 162 | 5.00.6 | 0.420.01 | 571 | |
| NGC0528 | 19.00.1 | 8.90.4 | 2.60.1 | 312 | 9.50.5 | 172 | 5.40.7 | 0.410.01 | 571 | |
| NGC0528 | 18.80.1 | 9.30.4 | 2.80.1 | 332 | 10.00.5 | 182 | 5.60.7 | 0.400.01 | 571 | |
| NGC0677 | 22.40.1 | 24.90.7 | 7.80.2 | - | - | - | - | 0.800.01 | 1731 | |
| NGC0677 | 21.70.1 | 27.20.8 | 8.50.2 | - | - | - | - | 0.820.01 | 1711 | |
| NGC0677 | 21.10.1 | 26.60.7 | 8.40.2 | - | - | - | - | 0.820.01 | 1711 | |
| NGC0842 | 20.80.1 | 16.00.4 | 3.80.1 | 382 | 9.00.4 | 121 | 2.90.1 | 0.510.01 | 1451 | |
| NGC0842 | 20.20.1 | 16.60.4 | 3.90.1 | 402 | 9.50.4 | 121 | 3.00.1 | 0.510.01 | 1451 | |
| NGC0842 | 19.70.1 | 16.30.4 | 3.90.1 | 372 | 8.90.4 | 131 | 3.10.1 | 0.520.01 | 1451 | |
| NGC0924 | 21.20.2 | 17.00.7 | 4.70.2 | - | - | - | - | 0.500.02 | 502 | |
| NGC0924 | 20.60.2 | 17.80.8 | 4.90.2 | - | - | - | - | 0.510.02 | 472 | |
| NGC0924 | 20.00.2 | 16.30.7 | 4.50.2 | - | - | - | - | 0.540.02 | 482 | |
| NGC1211 | 23.10.1 | 39.21.0 | 7.70.2 | 191 | 3.90.2 | 61 | 1.20.1 | 0.900.01 | 371 | |
| NGC1211 | 21.80.1 | 29.30.8 | 5.80.2 | 191 | 3.90.2 | 81 | 1.50.1 | 0.880.01 | 371 | |
| NGC1211 | 21.60.1 | 32.00.8 | 6.30.2 | 191 | 3.90.2 | 101 | 1.90.1 | 0.900.01 | 371 | |
| NGC1349 | 21.40.2 | 12.40.8 | 5.00.3 | - | - | - | - | 0.870.01 | 984 | |
| NGC1349 | 20.70.2 | 13.50.9 | 5.50.4 | - | - | - | - | 0.870.01 | 984 | |
| NGC1349 | 20.20.2 | 13.60.9 | 5.50.4 | - | - | - | - | 0.880.01 | 984 | |
| NGC1645 | 20.50.2 | 17.90.8 | 5.40.2 | - | - | - | - | 0.460.01 | 862 | |
| NGC1645 | 20.10.2 | 15.80.7 | 4.80.2 | - | - | - | - | 0.460.01 | 872 | |
| NGC1645 | 19.60.2 | 15.00.6 | 4.60.2 | - | - | - | - | 0.470.01 | 862 | |
| NGC1665 | 20.70.1 | 17.60.5 | 3.10.1 | - | - | - | - | 0.560.01 | 481 | |
| NGC1665 | 20.00.1 | 18.00.5 | 3.20.1 | - | - | - | - | 0.550.01 | 481 | |
| NGC1665 | 19.60.1 | 18.20.5 | 3.20.1 | - | - | - | - | 0.550.01 | 482 | |
| NGC2476 | 20.20.1 | 10.10.2 | 2.50.1 | 311 | 8.00.2 | 141 | 3.60.2 | 0.650.01 | 1491 | |
| NGC2476 | 19.40.1 | 9.90.2 | 2.50.1 | 311 | 7.90.2 | 131 | 3.50.2 | 0.650.01 | 1491 | |
| NGC2476 | 19.10.1 | 10.30.2 | 2.60.1 | 331 | 8.30.2 | 141 | 3.60.2 | 0.660.01 | 1491 | |
| NGC2592 | 20.50.1 | 10.90.3 | 1.60.1 | - | - | - | - | 0.790.01 | 582 | |
| NGC2592 | 19.90.1 | 11.10.3 | 1.60.1 | - | - | - | - | 0.800.01 | 582 | |
| NGC2592 | 19.30.1 | 11.30.3 | 1.70.1 | - | - | - | - | 0.800.01 | 582 | |
| NGC2880 | 21.20.1 | 23.70.3 | 3.00.1 | - | - | - | - | 0.560.01 | 1461 | |
| NGC2880 | 20.40.1 | 23.20.3 | 2.90.1 | - | - | - | - | 0.540.01 | 1431 | |
| NGC2880 | 19.80.1 | 22.40.2 | 2.80.1 | - | - | - | - | 0.570.01 | 1431 | |
| NGC3158 | 22.30.1 | 32.50.9 | 15.00.4 | - | - | - | - | 0.850.01 | 722 | |
| NGC3158 | 21.40.1 | 31.40.9 | 14.50.4 | - | - | - | - | 0.860.01 | 712 | |
| NGC3158 | 20.90.1 | 30.60.9 | 14.10.4 | - | - | - | - | 0.860.01 | 712 | |
| NGC3300 | 20.20.1 | 13.40.4 | 3.00.1 | - | - | - | - | 0.540.01 | 1741 | |
| NGC3300 | 19.40.1 | 13.50.4 | 3.00.1 | - | - | - | - | 0.540.01 | 1741 | |
| NGC3300 | 19.00.1 | 13.60.4 | 3.10.1 | - | - | - | - | 0.550.01 | 1741 | |
| NGC4003 | 21.90.2 | 14.60.6 | 6.50.3 | - | - | - | - | 0.680.02 | 1692 | |
| NGC4003 | 21.10.2 | 14.60.6 | 6.50.3 | - | - | - | - | 0.700.02 | 1732 | |
| NGC4003 | 20.80.2 | 15.50.7 | 6.90.3 | - | - | - | - | 0.690.02 | 1752 | |
| NGC5473 | 20.20.1 | 17.10.3 | 2.80.1 | 291 | 4.80.1 | 251 | 4.10.1 | 0.780.01 | 1561 | |
| NGC5473 | 19.40.1 | 17.10.3 | 2.80.1 | 301 | 5.00.1 | 261 | 4.30.1 | 0.780.01 | 1551 | |
| NGC5473 | 19.00.1 | 17.00.3 | 2.80.1 | 311 | 5.10.1 | 241 | 4.00.1 | 0.780.01 | 1551 | |
| NGC5481 | 20.30.1 | 13.70.2 | 1.80.1 | 842 | 10.90.2 | 502 | 6.50.3 | 0.730.01 | 1141 | |
| NGC5481 | 20.20.1 | 13.40.2 | 1.70.1 | 792 | 10.20.2 | 442 | 5.70.3 | 0.730.01 | 1151 | |
| NGC5481 | 19.50.1 | 13.70.2 | 1.80.1 | 852 | 11.00.2 | 492 | 6.40.3 | 0.730.01 | 1151 | |
| NGC5784 | 21.90.1 | 20.70.6 | 7.70.2 | - | - | - | - | 0.690.01 | 122 | |
| NGC5784 | 20.80.1 | 17.90.5 | 6.70.2 | - | - | - | - | 0.780.01 | 202 | |
| NGC5784 | 20.20.1 | 16.50.5 | 6.20.2 | - | - | - | - | 0.800.01 | 252 | |
| NGC5794 | 21.00.2 | 10.90.5 | 2.90.1 | - | - | - | - | 0.930.02 | 1392 | |
| NGC5794 | 21.30.2 | 11.60.5 | 3.10.1 | - | - | - | - | 0.920.02 | 1402 | |
| NGC5794 | 20.50.2 | 12.20.5 | 3.20.1 | - | - | - | - | 0.910.02 | 1452 | |
| NGC5876 | 21.80.1 | 33.50.9 | 8.10.2 | 552 | 13.20.6 | 111 | 2.80.1 | 0.420.01 | 541 | |
| NGC5876 | 21.00.1 | 31.60.8 | 7.60.2 | 522 | 12.70.5 | 111 | 2.90.1 | 0.420.01 | 521 | |
| NGC5876 | 20.50.1 | 29.90.8 | 7.20.2 | 492 | 11.90.5 | 111 | 2.80.1 | 0.430.01 | 521 | |
| NGC6278 | 21.50.1 | 28.60.7 | 6.10.2 | 372 | 7.90.3 | 121 | 2.60.1 | 0.520.01 | 1271 | |
| NGC6278 | 20.40.1 | 24.50.6 | 5.20.1 | 382 | 8.10.4 | 111 | 2.50.1 | 0.510.01 | 1271 | |
| NGC6278 | 20.00.1 | 24.70.6 | 5.30.1 | 392 | 8.40.4 | 121 | 2.60.1 | 0.530.01 | 1271 | |
| NGC6427 | 20.60.2 | 14.30.6 | 3.40.1 | - | - | - | - | 0.330.02 | 362 | |
| NGC6427 | 19.60.2 | 13.10.6 | 3.10.1 | - | - | - | - | 0.370.02 | 362 | |
| NGC6427 | 19.30.2 | 13.80.6 | 3.30.1 | - | - | - | - | 0.360.02 | 362 | |
| NGC6945 | 20.90.1 | 16.10.5 | 4.20.1 | - | - | - | - | 0.610.01 | 1201 | |
| NGC6945 | 20.20.1 | 16.40.5 | 4.30.1 | - | - | - | - | 0.600.01 | 1221 | |
| NGC6945 | 19.80.1 | 16.30.5 | 4.20.1 | - | - | - | - | 0.640.01 | 1201 | |
| NGC7611 | 20.10.1 | 12.10.4 | 2.50.1 | - | - | - | - | 0.450.01 | 1371 | |
| NGC7611 | 19.20.1 | 12.00.4 | 2.50.1 | - | - | - | - | 0.450.01 | 1371 | |
| NGC7611 | 18.80.1 | 11.50.3 | 2.40.1 | - | - | - | - | 0.480.01 | 1371 | |
| NGC7619 | 21.80.1 | 34.40.4 | 8.30.1 | - | - | - | - | 0.870.01 | 911 | |
| NGC7619 | 21.00.1 | 34.30.4 | 8.30.1 | - | - | - | - | 0.870.01 | 901 | |
| NGC7619 | 20.70.1 | 35.00.4 | 8.40.1 | - | - | - | - | 0.900.01 | 911 | |
| NGC7623 | 21.90.2 | 19.01.1 | 4.60.3 | 273 | 6.60.6 | 111 | 2.60.3 | 0.720.01 | 72 | |
| NGC7623 | 21.10.2 | 20.41.1 | 4.90.3 | 252 | 6.10.6 | 142 | 3.50.4 | 0.700.01 | 82 | |
| NGC7623 | 20.60.2 | 20.11.1 | 4.80.3 | 252 | 6.00.6 | 122 | 2.90.4 | 0.710.01 | 72 | |
| NGC7671 | 20.10.1 | 10.50.3 | 2.70.1 | 462 | 12.20.5 | 171 | 4.50.2 | 0.580.01 | 1351 | |
| NGC7671 | 19.20.1 | 10.30.3 | 2.70.1 | 462 | 12.30.5 | 161 | 4.40.2 | 0.580.01 | 1351 | |
| NGC7671 | 18.70.1 | 10.20.3 | 2.70.1 | 472 | 12.30.5 | 161 | 4.30.2 | 0.590.01 | 1351 | |
| UGC01271 | 21.10.2 | 11.50.5 | 3.60.2 | - | - | - | - | 0.620.02 | 952 | |
| UGC01271 | 20.10.2 | 11.60.5 | 3.60.2 | - | - | - | - | 0.610.02 | 1082 | |
| UGC01271 | 19.90.2 | 11.80.5 | 3.70.2 | - | - | - | - | 0.620.02 | 942 | |
| UGC02222 | 22.00.2 | 15.20.6 | 4.70.2 | - | - | - | - | 0.380.02 | 1022 | |
| UGC02222 | 20.90.2 | 14.60.6 | 4.60.2 | - | - | - | - | 0.390.02 | 1012 | |
| UGC02222 | 20.70.2 | 16.20.7 | 5.10.2 | - | - | - | - | 0.370.02 | 1022 | |
| UGC09629 | 20.80.2 | 12.30.8 | 6.40.4 | - | - | - | - | 0.330.03 | 1254 | |
| UGC09629 | 20.10.2 | 12.50.8 | 6.50.4 | - | - | - | - | 0.320.03 | 1244 | |
| UGC09629 | 19.70.2 | 12.70.8 | 6.60.4 | - | - | - | - | 0.310.03 | 1244 | |
| UGC11228 | 21.50.2 | 13.80.6 | 5.40.2 | - | - | - | - | 0.670.02 | 1782 | |
| UGC11228 | 20.50.2 | 13.10.6 | 5.10.2 | - | - | - | - | 0.650.02 | 1762 | |
| UGC11228 | 20.20.2 | 14.20.6 | 5.50.2 | - | - | - | - | 0.660.02 | 1762 | |
| Note. (1) Galaxy name; (2) SDSS band, (3), (4), (5), (6), (7), (8), (9), (10), and (11) central surface brightness, scale-length (arcsec), scale-length (kpc), break radius (arcsec), break radius (kpc), outer scale length (arcsec), outer scale length (kpc), axis ratio, and position angle of the disc, respectively. |
| Galaxy | Band | |||||
|---|---|---|---|---|---|---|
| (mag/″2) | (″) | (kpc) | (∘) | |||
| (1) | (2) | (3) | (4) | (5) | (6) | (7) |
| IC2341 | - | - | - | - | - | |
| IC2341 | - | - | - | - | - | |
| IC2341 | - | - | - | - | - | |
| MCG-01-52-012 | - | - | - | - | - | |
| MCG-01-52-012 | - | - | - | - | - | |
| MCG-01-52-012 | - | - | - | - | - | |
| NGC0364 | 20.90.4 | 12.61.2 | 4.00.1 | 0.550.06 | 914 | |
| NGC0364 | 20.00.4 | 12.71.2 | 4.00.1 | 0.550.06 | 914 | |
| NGC0364 | 19.70.4 | 12.91.2 | 4.10.1 | 0.540.06 | 924 | |
| NGC0515 | 19.90.4 | 12.31.2 | 4.00.1 | 0.470.06 | 1324 | |
| NGC0515 | 20.20.4 | 12.21.2 | 4.00.1 | 0.470.06 | 1324 | |
| NGC0515 | 19.20.4 | 12.11.2 | 4.00.1 | 0.460.06 | 1324 | |
| NGC0528 | - | - | - | - | - | |
| NGC0528 | - | - | - | - | - | |
| NGC0528 | - | - | - | - | - | |
| NGC0677 | - | - | - | - | - | |
| NGC0677 | - | - | - | - | - | |
| NGC0677 | - | - | - | - | - | |
| NGC0842 | 20.90.3 | 18.51.2 | 4.40.1 | 0.540.03 | 1542 | |
| NGC0842 | 20.20.3 | 18.91.2 | 4.50.1 | 0.520.03 | 1552 | |
| NGC0842 | 19.80.3 | 18.21.2 | 4.30.1 | 0.540.03 | 1562 | |
| NGC0924 | 21.20.4 | 18.01.4 | 5.00.1 | 0.380.06 | 514 | |
| NGC0924 | 20.40.4 | 19.61.4 | 5.40.1 | 0.370.06 | 504 | |
| NGC0924 | 19.70.4 | 19.01.4 | 5.20.1 | 0.360.06 | 504 | |
| NGC1211 | 21.50.3 | 40.11.5 | 7.90.1 | 0.280.03 | 1452 | |
| NGC1211 | 20.30.3 | 35.81.4 | 7.10.1 | 0.310.03 | 1462 | |
| NGC1211 | 20.20.3 | 38.81.5 | 7.70.1 | 0.290.03 | 1452 | |
| NGC1349 | - | - | - | - | - | |
| NGC1349 | - | - | - | - | - | |
| NGC1349 | - | - | - | - | - | |
| NGC1645 | 19.80.4 | 13.31.3 | 4.10.1 | 0.650.06 | 264 | |
| NGC1645 | 19.50.4 | 13.31.3 | 4.10.1 | 0.630.06 | 254 | |
| NGC1645 | 19.10.4 | 13.41.3 | 4.10.1 | 0.610.06 | 234 | |
| NGC1665 | - | - | - | - | - | |
| NGC1665 | - | - | - | - | - | |
| NGC1665 | - | - | - | - | - | |
| NGC2476 | - | - | - | - | - | |
| NGC2476 | - | - | - | - | - | |
| NGC2476 | - | - | - | - | - | |
| NGC2592 | - | - | - | - | - | |
| NGC2592 | - | - | - | - | - | |
| NGC2592 | - | - | - | - | - | |
| NGC2880 | 20.60.1 | 14.61.1 | 1.90.1 | 0.550.02 | 801 | |
| NGC2880 | 19.70.1 | 14.71.1 | 1.90.1 | 0.540.02 | 811 | |
| NGC2880 | 19.50.1 | 14.61.1 | 1.90.1 | 0.540.02 | 821 | |
| NGC3158 | - | - | - | - | - | |
| NGC3158 | - | - | - | - | - | |
| NGC3158 | - | - | - | - | - | |
| NGC3300 | 20.30.2 | 17.81.2 | 4.00.1 | 0.420.05 | 441 | |
| NGC3300 | 19.50.2 | 17.71.2 | 4.00.1 | 0.420.05 | 441 | |
| NGC3300 | 19.10.2 | 17.71.2 | 4.00.1 | 0.420.05 | 441 | |
| NGC4003 | 21.80.4 | 39.11.9 | 17.30.4 | 0.270.06 | 1444 | |
| NGC4003 | 21.00.4 | 39.31.9 | 17.40.4 | 0.270.06 | 1444 | |
| NGC4003 | 20.60.4 | 39.31.9 | 17.40.4 | 0.270.06 | 1444 | |
| NGC5473 | 20.60.2 | 22.21.1 | 3.60.1 | 0.490.02 | 801 | |
| NGC5473 | 19.80.2 | 22.21.1 | 3.60.1 | 0.480.02 | 791 | |
| NGC5473 | 19.40.2 | 22.31.1 | 3.60.1 | 0.470.02 | 791 | |
| NGC5481 | - | - | - | - | - | |
| NGC5481 | - | - | - | - | - | |
| NGC5481 | - | - | - | - | - | |
| NGC5784 | - | - | - | - | - | |
| NGC5784 | - | - | - | - | - | |
| NGC5784 | - | - | - | - | - | |
| NGC5794 | 20.60.4 | 17.81.4 | 4.70.1 | 0.490.06 | 994 | |
| NGC5794 | 21.00.4 | 18.41.4 | 4.90.1 | 0.480.06 | 1014 | |
| NGC5794 | 20.20.4 | 19.01.4 | 5.10.1 | 0.470.06 | 1004 | |
| NGC5876 | 21.10.3 | 21.51.2 | 5.20.1 | 0.490.03 | 1802 | |
| NGC5876 | 20.20.3 | 21.61.2 | 5.20.1 | 0.490.03 | 1802 | |
| NGC5876 | 19.80.3 | 22.01.2 | 5.30.1 | 0.480.03 | 1792 | |
| NGC6278 | 21.00.3 | 22.51.2 | 4.80.1 | 0.380.03 | 1172 | |
| NGC6278 | 20.10.3 | 21.81.2 | 4.60.1 | 0.390.03 | 1162 | |
| NGC6278 | 19.80.3 | 22.41.2 | 4.80.1 | 0.370.03 | 1172 | |
| NGC6427 | 20.90.4 | 13.01.3 | 3.10.1 | 0.470.06 | 784 | |
| NGC6427 | 19.90.4 | 12.71.2 | 3.00.1 | 0.520.06 | 804 | |
| NGC6427 | 19.50.4 | 12.71.2 | 3.00.1 | 0.490.06 | 784 | |
| NGC6945 | 20.90.2 | 19.61.3 | 5.10.1 | 0.560.05 | 911 | |
| NGC6945 | 20.10.2 | 19.21.3 | 5.00.1 | 0.530.05 | 871 | |
| NGC6945 | 19.70.2 | 19.51.3 | 5.10.1 | 0.500.05 | 871 | |
| NGC7611 | 19.70.2 | 8.011.1 | 1.70.1 | 0.690.05 | 21 | |
| NGC7611 | 19.00.2 | 8.211.1 | 1.70.1 | 0.690.05 | 41 | |
| NGC7611 | 18.30.2 | 7.751.1 | 1.60.1 | 0.710.05 | 21 | |
| NGC7619 | - | - | - | - | - | |
| NGC7619 | - | - | - | - | - | |
| NGC7619 | - | - | - | - | - | |
| NGC7623 | 21.70.5 | 21.91.6 | 5.20.2 | 0.410.07 | 1613 | |
| NGC7623 | 20.90.5 | 21.41.6 | 5.10.2 | 0.380.07 | 1613 | |
| NGC7623 | 20.40.5 | 21.51.6 | 5.10.2 | 0.400.07 | 1613 | |
| NGC7671 | 21.10.3 | 9.181.1 | 2.40.1 | 0.590.03 | 242 | |
| NGC7671 | 19.70.3 | 8.771.1 | 2.30.1 | 0.620.03 | 242 | |
| NGC7671 | 19.40.3 | 9.011.1 | 2.40.1 | 0.610.03 | 242 | |
| UGC01271 | 21.20.4 | 18.71.4 | 5.80.1 | 0.430.06 | 524 | |
| UGC01271 | 20.30.4 | 18.31.4 | 5.70.1 | 0.390.06 | 534 | |
| UGC01271 | 19.90.4 | 18.71.4 | 5.80.1 | 0.420.06 | 524 | |
| UGC02222 | 22.40.4 | 22.61.5 | 7.10.2 | 0.350.06 | 1024 | |
| UGC02222 | 21.20.4 | 20.31.4 | 6.30.1 | 0.370.06 | 984 | |
| UGC02222 | 20.90.4 | 22.41.5 | 7.00.2 | 0.340.06 | 1014 | |
| UGC09629 | - | - | - | - | - | |
| UGC09629 | - | - | - | - | - | |
| UGC09629 | - | - | - | - | - | |
| UGC11228 | 21.90.4 | 23.51.5 | 9.20.2 | 0.300.06 | 1604 | |
| UGC11228 | 20.90.4 | 22.91.5 | 8.90.2 | 0.310.06 | 1584 | |
| UGC11228 | 20.60.4 | 23.01.5 | 9.00.2 | 0.280.06 | 1574 | |
| Note. (1) Galaxy name; (2) SDSS band, (3), (4), (5), (6), and (7) central surface brightness, semi-major axis length (arcsec), semi-major axis length (kpc), axis ratio, and position angle of the bar, respectively. |
Appendix B Effects of pixelization and PSF on the stellar kinematics
Despite the good spatial coverage and sampling of the CALIFA datacubes, we face the problem that some of our bulges have effective radii comparable to the measured PSF of the final CALIFA datacubes (2.5 arcsec; García-Benito et al., 2015).
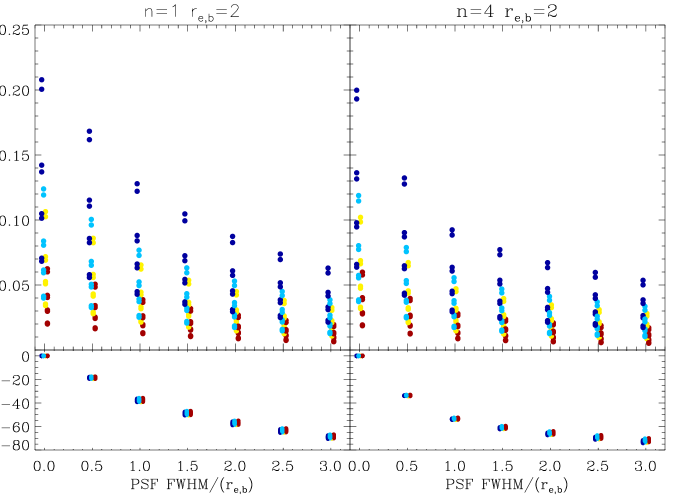
In order to estimate the uncertainties due to the effects of pixelization and PSF, and eventually include them in the error budget of our integrated kinematic measurements, we decided to carry out a set of tests using simulations with mock datacubes. To this aim, mock datacubes were created from scratch including both photometric and kinematics properties comparable to those of our sample galaxies. Mock datacubes also share the technical properties of real CALIFA data in terms of spatial and spectral resolution.
In detail, the mock datacubes were created with the following properties: i) we used a single stellar population spectrum, corresponding to an old and metal rich star, chosen from the MILES library (Sánchez-Blázquez et al., 2006) to create our datacube. Since we are only interested in the effect of the spatial resolution on the kinematic measurements, a realistic combination of single stellar populations (SSPs) to reproduce a galaxy is not necessary. Therefore all the spaxels in the datacube were assumed to have the same SSP. ii) We used a set of SBD to reproduce realistic spaxel intensity variation within the datacube. Each spaxel intensity was scaled to follows a SBD described by a Sérsic profile with values of the effective radius and 5 arcsec and Sérsic index and 4. Then, all datacubes were convolved with values of the FWHM and 6 arcsecs where FWHM =0 represent the perfect model. iii) The velocity field was modelled assuming that the mock galaxies have a rotation curve that follow the parameterisation by Salucci et al. (2007)
| (7) |
where is the maximum rotation velocity and define the spatial rising of the rotation velocity profile. We projected the velocity field on the sky plane assuming cartesian coordinates with the origin in the centre of the galaxy, axis aligned along the apparent major axis of the galaxy, and axis along the line of sight directed towards the observer. The sky plane is confined to the () plane. If the galaxy has an inclination angle i (with i = 0∘ corresponding to the face-on case), at a given sky point with coordinates (), the observed velocity is
| (8) |
where is the azimuthal angle measured from the apparent major axis of the galaxy. The spectra in each spaxel was then shifted according to this rotation curve using values of 150 and 300 km/s, and 10 and 15 arcsec. The velocity field parameterisation was tested against the real data. To this aim, we derived the rotation curves from our galaxy sample using the kinemetry routine developed by Krajnović et al. (2006). Then, the rotation curves were fitted using Eqs. 7 and 8 with and as free parameters. The mock galaxy values correspond to the minimum and maximum values obtained from this fit. The velocity dispersion of the real galaxies was modelled by a simple exponentially declining profile with two free parameters: the maximum velocity dispersion () and the scale-length (). Attending to the typical values for our galaxy sample (obtained from the fit to the kinemetry velocity dispersion profiles) we built the datacubes with a velocity dispersion profile with 150 and 200 km/s and 20 and 40 arcsecs. Finally, all datacubes were created using models with two different inclinations 30 and 60 degrees to test possible inclination effects on our measurements. A final sample of 2688 mock datacubes was created.
Since measurement errors were already included in the error budget using the observed galaxy datacubes (see Sect. 5.2), mock datacubes were created noise free. Furthermore, to minimise problems related to template mismatching, we decided to run the pPXF algorithm using the same SSP as that used to create the datacubes. Then, the pPXF algorithm was run as for real datacubes and the stellar kinematic maps of velocity and velocity dispersion were obtained and analysed as described in Sect. 5.1.
We measured the values of the and using Eqs. 5 and 6. Figure 18 shows, for a given photometric configuration, an example of the biases introduced when the measurement radii are comparable to the spatial resolution of the data. The measured value of is a strong function of the PSF/ ratio, with differences reaching up to 70% from the actual value, and always affecting the measurements towards lower values of . In fact, pixelation and PSF effect can be considered as a systematic variation and therefore a correction factor should be applied to the data. Fortunately, Figure 18 (bottom panels) also shows that the correction factor does not strongly depend on the kinematics of the system but mostly on their photometric configuration and the PSF/ ratio. In fact, the errors due to the different kinematic of the system (different colours in Figure 18) are always much smaller () than the correction factor itself. Therefore, since the photometric parameters can be obtained with a better spatial resolution (SDSS) than the datacubes (CALIFA) we can safely compute the correction factor, and its corresponding dispersion, and properly correct the integrated values of and .
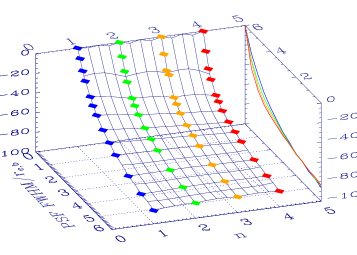
We computed the correction factor for each galaxy by interpolating the plane shown in Figure 19 using the corresponding values of /PSF ratio and Sérsic index () for each bulge. In order to account for the errors due to the different possible kinematics, inclinations, and bulge effective radius () (shown with different colours in Figure 18), we perform this interpolation in a Monte Carlo fashion. We created 2000 interpolation planes by randomly changing the position of every node of the plane, i.e., for all the different kinematic configurations. Both the mean and standard deviation were taken as the correction factor and its error, respectively. This error was then propagated into the value of and summed quadratically with measurements errors as described in Sect. 6.2.