Thermal conductivity of ternary III-V semiconductor alloys: the role of mass difference and long-range order
Abstract
Thermal transport in bulk ternary III-V arsenide (III-As) semiconductor alloys was investigated using equilibrium molecular dynamics with optimized Albe-Tersoff empirical interatomic potentials. Existing potentials for binary AlAs, GaAs, and InAs were optimized to obtain accurate phonon dispersions and temperature-dependent thermal conductivity. Calculations of thermal transport in ternary III-Vs commonly employ the virtual-crystal approximation (VCA), where the structure is assumed to be a random alloy and all group-III atoms (cations) are treated as if they have an effective weighted-average mass. Here, we showed that is critical to treat atomic masses explicitly, and that the thermal conductivity obtained with explicit atomic masses differs considerably from the value obtained with the average VCA cation mass. The larger the difference between the cation masses, the poorer the VCA prediction for thermal conductivity. The random-alloy assumption in the VCA is also challenged, because X-ray diffraction and transmission electron microscopy show order in InGaAs, InAlAs, and GaAlAs epi-layers. We calculated thermal conductivity for three common types of order [CuPt-B, CuAu-I, and triple-period-A (TPA)] and showed that the experimental results for In0.53Ga0.47As and In0.52Al0.48As, which are lattice matched to the InP substrate, can be reproduced in molecular dynamics simulation with 2% and 8% of random disorder, respectively. Based on our results, thermal transport in ternary III-As alloys appears to be governed by the competition between mass-difference scattering, which is much more pronounced than the VCA suggests, and the long-range order that these alloys support.
I Introduction
III-V arsenide (III-As) ternary alloys and their superlattices (SLs) are widely used in optoelectronic and thermoelectric devices.Faist et al. (1994); Köhler et al. (2002) In particular, the use of III-As alloys brings about great flexibility in the design of the active region of quantum cascade lasers (QCLs).Razeghi et al. (2013) Despite the wide popularity, even the bulk thermal properties of these ternary alloys have not been completely characterized to date,Adachi (2007) which hinders the analysis of device thermal performance.
Measuring the thermal conductivity (TC) of bulk ternary alloys requires growing them strain-free on a substrate. Since GaAs substrate is lattice matched to AlxGa1-xAs with any Al composition, TC measurement of AlGaAs were carried out early on, though only at room temperature (RT).Afromowitz (1973) Measurements on InxGa1-xAs and InxAl1-xAs are more challenging, as they each only have a specific composition (In0.53Ga0.47As and In0.52Al0.48As) that is lattice matched to InP, a common substrate for the growth of midinfrared QCLs.Kim, Rodwell, and Gossard (2002) As a result, InxGa1-xAs and InxAl1-xAs often exist in pairs inside a strain-balanced SL on top of InP. As the influence that the interfaces in SLs have on thermal transport is poorly understood,Cahill et al. (2003, 2014) it is very difficult to extract the TC of each material from the measurements on SLs. Abrahams et al. measured the RT TC of InxGa1-xAs with various In compositions, where the samples were formed through zone leveling.Abrahams, Braunstein, and Rosi (1959) However, this method is not applicable to InxAl1-xAs, as they oxidize easily. Koh et al. measured the RT TC of In0.53Ga0.47As and In0.52Al0.48As to be 4.02 W/mK and 2.68 W/mK , respectively, using both the technique and time-domain thermoreflectance (TDTR).Koh et al. (2009) Sood et al. used TDTR to measure the cross-plane TC of In0.53Ga0.47As/In0.52Al0.48As SLs with different layer thicknesses and extracted the TC of In0.53Ga0.47As and In0.52Al0.48As to be 5.0 W/mK and 1.2 W/mK, respectively. The two sets of results disagree, with the disparity being particularly pronounced for In0.52Al0.48As. Furthermore, both sets of results were obtained for In0.53Ga0.47As and In0.52Al0.48As lattice matched to InP. We still have very limited knowledge about the TC of InxGa1-xAs and InxAl1-xAs bulk materials with various compositions.
Our recent theoretical work solved the Boltzmann transport equation for phonons under the relaxation-time approximation in order to describe the TC of III-As semiconductors.Mei and Knezevic (2015) We accurately captured the TC of binary compounds (AlAs, GaAs, and InAs) from 100 K to 600 K with full acoustic phonon dispersions. Additionally, we adopted the virtual crystal approximationAbeles (1963) (VCA) to compute the TC of ternary alloys AlxGa1-xAs, InxGa1-xAs, and InxAl1-xAs at RT. For InxGa1-xAs and AlxGa1-xAs, our calculated TC agreed reasonably well with experimental values with various compositions.Abrahams, Braunstein, and Rosi (1959); Adachi (1983); Afromowitz (1973) For InxAl1-xAs, an experimental TC value was only available for In0.52Al0.48As.Koh et al. (2009); Sood et al. (2014) Our calculated TC is 2.82 W/mK, which is close to the Koh et al. value of 2.68 W/mK,Koh et al. (2009) but far from the Sood et al. value of 1.2 W/mK.Sood et al. (2014) Considering that we have benchmarked the technique for binaries, we speculate that the VCA that is not entirely suitable for characterizing the TC of ternary III-As alloys.
Within the VCA, there are two major assumptions whose validity needs to be questioned when it comes to the calculation of TC in ternary alloys AxB1-xC. (1) All cations can effectively be replaced with an effective averaged cation, whose mass is calculated as the weighted average of cation masses, i.e., m. (2) The alloy is random, i.e., cation sites are randomly taken by atom A or atom B, with the frequency proportional to cation abundance [ and , respectively]. Although an effective mass-difference scattering rate is often employed in Boltzmann-equation-based approaches to compensate for the fact that assumption (1) eliminates scattering caused by cation mass difference,Abeles (1963) these rates are calculated under the assumption that the cation mass difference is small with respect to the average cation mass. Therefore, the validity of this perturbative mass-difference-scattering approach becomes suspect when the cation masses are very different. In our case, m au, m au, and m au, so it makes sense that the model would work better for InxGa1-xAs and AlxGa1-xAs than it does for InxAl1-xAs, since the mass difference between Al atoms and In atoms is significant. The second assumption is directly contradicted by a number of X-ray and transmission-electron-microscopy (TEM) experiments conducted on ternary III-V alloys grown epitaxially on GaAs or InP substrate.Shahid et al. (1987); Shin et al. (2006); Kuan, Wang, and Wilkie (1987); Mori et al. (2004); Kulik et al. (1999); Forrest et al. (2000); Suzuki (2002); Suzuki, Ichihashi, and Nakayama (1998); Gomyo et al. (1994); Ohkouchi et al. (2005); Kuan et al. (1985); Bernard et al. (1990) These experiments show that group III atoms in ternary III-As epi-layers are arranged with a certain order rather than completely randomly. This ordered structure is also backed up by an observable change in the width of the electronic band gap of these materials. The most commonly observed types of ordering for In0.53Ga0.47As and In0.52Al0.48As are the CuPt-B orderShahid et al. (1987); Shin et al. (2006); Kuan, Wang, and Wilkie (1987); Kulik et al. (1999) and the triple-period-A (TPA) order.Mori et al. (2004); Forrest et al. (2000); Suzuki (2002); Suzuki, Ichihashi, and Nakayama (1998); Gomyo et al. (1994); Ohkouchi et al. (2005) The CuAu-I order is more common in Al0.5Ga0.5AsKuan et al. (1985); Bernard et al. (1990), but could also be observed in In0.53Ga0.47As or In0.52Al0.48As under appropriate growth conditions.Suzuki (2002); Bernard et al. (1990)
In this work, we used molecular dynamics (MD) to study thermal transport in ternary III-As alloys. In a MD simulation, the mass and location of each atom are tracked in real space; therefore, it is straightforward to include individual atom masses and the exact alloy structure explicitly in the simulation. We adopted the TersoffTersoff (1988, 1989) empirical interatomic potentials (EIPs) to describe the interaction between atoms. The parameters we used in the EIPs were obtained by an optimization technique, starting from the existing values,Sayed et al. (1995); Powell, Migliorato, and Cullis (2007); Hammerschmidt, Kratzer, and Scheffler (2008) with the goal of better capturing the phonon properties of binary III-As semiconductors.Lindsay and Broido (2010) We then used the optimized EIPs to study the influence of mass difference and ordering on the TC of ternary III-As alloys. The results show that the atom mass must be explicitly considered, especially in In-based compounds. Ordering can significantly increase the TC and partial ordering is a likely reason for the higher experimentally obtained thermal conductivities than what the VCA within the Boltzmann transport framework predicts. Moreover, TC can vary a great deal with the introduction of even low levels of disorder.
In Sec. III, we discuss the way we compute the bulk TC from an MD simulation and our process of optimizing the Tersoff potentials for AlAs, GaAs, and InAs. In Sec. IV, we apply the optimized potentials to ternary alloys. We isolate the effect of mass difference by comparing the TC obtained from structures where each cation has its own mass and those where all cations have the effective VCA mass. In Sec. V, we study the TC of bulk ternary III-As alloys with perfect ordering and lattice-matched In0.53Ga0.47As and In0.52Al0.48As that contain small levels of random disorder. Finally, we summarize our findings in Sec. VI.
II Thermal Conductivity from Equilibrium Molecular Dynamics
II.1 The Green-Kubo Formula for Thermal Conductivity
All the MD simulations in this work were carried out in the LAMMPSPlimpton (1995) package. We used equilibrium molecular dynamics (EMD) together with the Green-Kubo (GK) formula to compute the TC of compound semiconductors. When a system is equilibrated and then kept at a set temperature, the TC can be derived from the fluctuation–dissipation theorem using instantaneous heat flux.Frenkel and Smit (2001) In a three-dimensional (3D) bulk material where all three directions are equivalent, thermal conductivity is described by the GK formula asFrenkel and Smit (2001)
| (1) |
where is the Boltzmann constant, is the system volume, and is the system temperature. is the instantaneous heat flux calculated from the atom velocities and local potentials. The integral is over the heat-current autocorrelation function, . In an MD simulation, the time is discretized and the integration in Equation (1) is converted to a sum.
For cubic bulk semiconductors, the TC is expected to be isotropic. As a result, we used cubic simulation cells with periodic boundary conditions applied in all directions. In a typical simulation, the system was first initialized at the desired temperature by assigning each atom a random velocity that follows the thermal distribution at . Then the system was equilibrated as an ensemble (constant number of atoms, constant pressure at 1 atm, and constant temperature ) using the Nos-Hoover barostats and thermostatsNosé (1984); Hoover (1985) for 100 ps. After that, the system was further equilibrated as an ensemble (constant number of atoms, constant volume, and constant system energy) for another 100 ps before the heat flux is collected. The instantaneous heat flux was calculated and output into a file at every time step, for 5 million steps. A script was written to post-process the output file and obtain the heat-current autocorrelation function and its running integral. We made sure the integral saturated and extracted the bulk TC according to Equation (1). The time step was chosen to be small enough to ensure the system stayed stable throughout the simulation – here, the time step was 1 fs for binary materials and 0.1 fs for ternary alloys. For each simulation (given material and temperature), several random starting velocity distributions were used and the final result was averaged among the different runs. We tested the simulation domain sizes to make sure there was no size effect. The final results for binary III-As were obtained with a simulation cell in size, where is the lattice constant for the material. For ternary alloys, is enough for the TC to converge. We used cells for alloys with TPA ordering, as the algorithm for generating cells requires that the system size be a multiple of 3 (more detail in Sec. V).
II.2 Quantum Correction of Temperature
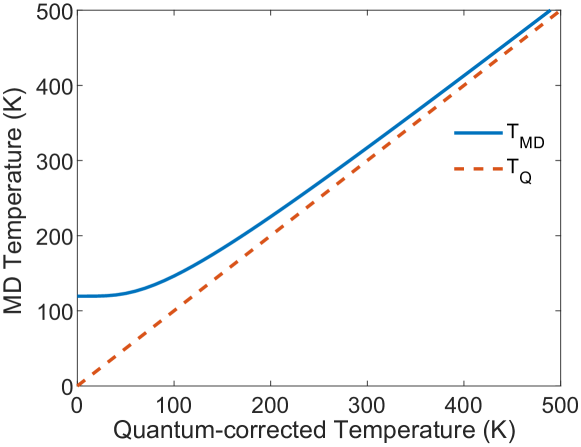
In MD simulations, system temperatures are calculated following the rules of classical statistical mechanics. Wang, Chan, and Ho (1990) We adopted a simple quantum-correction procedure for the temperatures by mapping the kinetic energy of an MD system at temperature onto that of a quantum system with temperature Wang, Chan, and Ho (1990); Lukes and Zhong (2007)
| (2) |
On the left-hand side, is the number of atoms in the system and is the Boltzmann constant. On the right-hand side, the summation is over all the phonon branches and wave vectors . is the corresponding phonon energy. For the right-hand side, we used an approximate isotropic phonon dispersion fitted to the full phonon dispersion, based on our previous work.Mei and Knezevic (2015) Figure 1 shows the mapping between the quantum-corrected temperature and the MD temperature for GaAs (the curve is similar for AlAs and InAs) between 0 K and 500 K. We see that and coincide at higher temperatures, but differ a great deal at lower temperatures. At room temperature, there is typically a difference between and for III-As. Henceforth, all the temperatures listed in this work are the quantum-corrected temperatures .
III Optimizing the Tersoff Potentials
III.1 Tersoff Potentials
The Tersoff EIP was proposed by Tersoff in 1988 for silicon,Tersoff (1988) extended to SiC in 1989,Tersoff (1989) and later successfully parameterized for most III-V binary compounds. Sayed et al. (1995); Nordlund et al. (2000); Powell, Migliorato, and Cullis (2007); Hammerschmidt, Kratzer, and Scheffler (2008) Tersoff potentials have a cutoff distance that limits the atom interactions to nearest neighbors, which is an advantage in our case: the nearest-neighbor interaction makes it easy to apply the optimized potentials for binary III-As to ternary III-As alloys.
In the LAMMPS package, the Tersoff potential is described using 14 parameters in the following form. The total energy of the system is the summation of energy between each pair:
| (3) |
| The pair interaction potential between atom and atom is described by the competition between a repulsive term and an attractive term , and is modulated by a cutoff term so that only nearest-neighbor interactions are included: | ||||
| (4a) | ||||
| The cutoff function is | ||||
| (4b) | ||||
| where is the variable. From Equation (4b), the cutoff length is and there is a transition window with width . Both and are parameters of the Tersoff potential. Both the repulsive and the attractive terms have an exponential form with and being the potential parameters: | ||||
| (4c) | ||||
| (4d) | ||||
| To include the influence of the bond angle and length, the attraction term is further modified by the bond angle term where | ||||
| (4e) | ||||
| and | ||||
| (4f) | ||||
| (4g) | ||||
| The summation in goes over all the central atom ’s neighbors within the cutoff except for the neighbor whose interaction with we are considering. The bond angle can be calculated with the three atoms’ coordinates and is a scaling parameter that is unity in most cases. , , , and are potential parameters. In particular, can only take the value of 1 or 3. and are bond-angle-related potential parameters. Note that is often denoted as ; the form of a cosine simply reminds us this parameter can only take values between -1 and 1. | ||||
A variation of the original Tersoff potential is the Albe-Tersoff potential where the strength and the decay rate in Equation (4c) and (4d) are expressed through parameters and in place of , and .Albe et al. (2002) The relationship between the two sets of parameters can be derived as
| (4h) | ||||
| (4i) | ||||
| (4j) | ||||
| (4k) |
In the case of Albe-Tersoff potential, we work with the parameters and and then use a script to convert them to , and for the input potential file of LAMMPS.
III.2 Phonon Dispersion from EIP
With a given EIP, the phonon frequencies for wave vector and branch can be obtained by diagonalizing the dynamical matrixSrivastava (1990)
| (5) |
where represents atom in the th unit cell and the summation is over all the relevant neighbors of the central atom . is the relative location of unit cell with respect to the unit cell that atom is in. The interatomic force constants (IFCs) between atoms and , denoted by , were calculated using centred finite differences:
| (6) |
Phonon dispersion curves were obtained by computing the phonon frequencies for multiple s along a certain direction in the first Brillouin zone (1BZ). The sound velocities were obtained from the acoustic branches near the zone center ( point) as
| (7) |
where the subscript is the branch index. Since the phonon dispersion is isotropic near the point, we used the dispersion curves along the [100] () direction to calculate the sound velocities. The two transverse acoustic (TA) branches are degenerate along the direction, so we only need one scalar velocity for the TA branches () and one for the longitudinal acoustic (LA) branch ().
III.3 Parameter Optimization
Most Tersoff potentials are parameterized so as to accurately capture the mechanical properties of materials.Tersoff (1988, 1989); Sayed et al. (1995); Nordlund et al. (2000); Powell, Migliorato, and Cullis (2007); Hammerschmidt, Kratzer, and Scheffler (2008) However, for the EIPs to be good at describing thermal transport, they also must produce good phonon properties. Lindsay and BroidoLindsay and Broido (2010) optimized the Tersoff potential of carbon (C) for thermal transport. They used a -minimization, where
| (8) |
and where runs over all the physical properties they optimize for. and are, respectively, the calculated and experimental values of the physical property . is the weighting factor determining the relative importance of each physical property in the optimization process. They assigned the most weight to the phonon frequencies and sound velocities, because of their crucial rule in thermal transport.Lindsay and Broido (2010)
Here, we followed a similar minimization approach to improve Tersoff EIPs for describing thermal transport in III-Vs. The physical properties we optimized for are the lattice constant , the cohesive energy , and sound velocities and . Note that the accuracy of phonon dispersions only guarantees the accuracy of the second derivatives of the EIPs (or the IFCs) (Sec. III.2), while the finite TC of crystals originates from the phonon–phonon scattering, related to the third and higher derivatives of the EIPs. Since the strength of these higher-order interactions is not easily accessible in experiments, we used the temperature-dependent TC measured in experiments as an additional gauge, because the temperature variation of TC is dictated by phonon-phonon interactions. First, we optimized the EIPs to match the phonon dispersion following Lindsay and Broido.Lindsay and Broido (2010) Then we used the optimized potential to calculate the temperature-dependent TC, following the procedure described in Sec. II. We were most interested in the temperature range between 100 K and 500 K, because most devices operate in this range. A comparison between the calculated and measured TC instructed us to further adjust the weights in the optimization process. This process was repeated until we obtained a satisfactory temperature-dependent TC from the potentials.
For simplicity, we used existing parameterizations as starting points. To choose the best starting point, we calculate the TDTC with existing potentials. For the three binary III-As materials (AlAs, GaAs, and InAs) we are most interested in, the potentials that yield the temperature-dependent TC closest to experiment are from Sayed et al.Sayed et al. (1995), Powell et al.Powell, Migliorato, and Cullis (2007), and Hammerschmidt et al.Hammerschmidt, Kratzer, and Scheffler (2008), respectively. Incidentally, all three sets are parameterized in the Albe-Tersoff form. Like Lindsay and Broido,Lindsay and Broido (2010) we tried to adjust just a few parameters. and were left untouched, because they dictate the cutoff of the EIP. also stayed constant, as per LAMMPS’s requirement. Among the remaining parameters, we found that and are very effective in adjusting the four physical properties we want to optimize. Therefore, during the minimization, we only varied these five parameters.
III.4 Optimized Potentials
In the optimization, we found that the parameters for GaAs from Powell et al.Powell, Migliorato, and Cullis (2007) yielded very good sound velocities as well as temperature-dependent TC from 100 K to 500 K. Therefore, we adopted this set of parameters as it was. However, the parameters for AlAsSayed et al. (1995) and InAsHammerschmidt, Kratzer, and Scheffler (2008) both had to be optimized. Table 1 shows the optimized parameters for AlAs and InAs. As mentioned in Sec. III.3, the parameters other than the five listed were kept the same as in the original sets.
| AlAs | InAs |
|---|---|
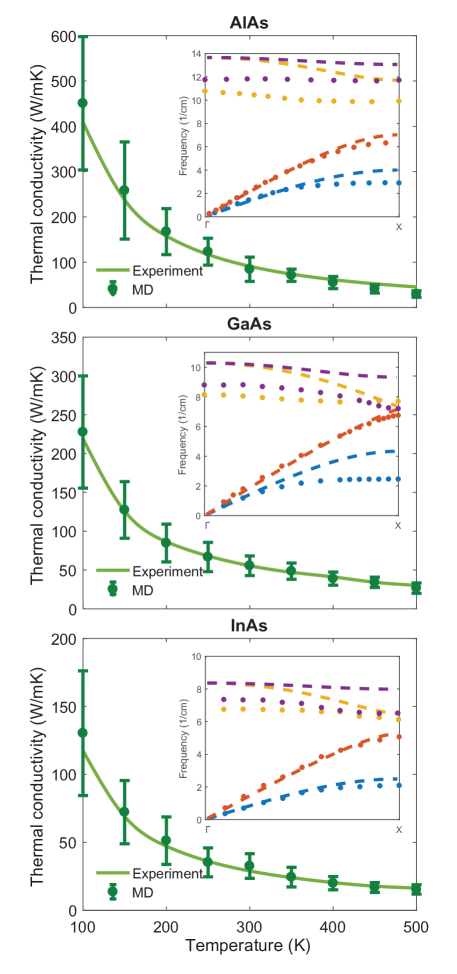
The three panels in Fig. 2 show the calculated temperature-dependent TC (dark green dots with error bars) in comparison with experimental data Inyushkin et al. (2003); Amith, Kudman, and Steigmeier (1965); Evans et al. (2008); Tamarin and Shalyt (1971); Le Guillou and Albany (1972); Bowers et al. (1959) (light green solid lines) for AlAs, GaAs, and InAs, respectively. The insets show the calculated phonon dispersions along the direction (dashed lines) in comparison with measured values Lindsay, Broido, and Reinecke (2013); Dorner and Strauch (1990); Orlova (1983); Carles et al. (1980) (dots).
IV Thermal Conductivity of Ternary Alloys: The Role of Cation Mass Difference
After obtaining the optimized EIPs for binary compounds, we applied these potentials to ternary alloys. We investigated the validity of the first assumption in the VCA (all cation atoms are assigned the same weighted-average mass) in predicting the TC. For this part, we kept the second assumption that all ternary alloys were random alloys. We considered InxGa1-xAs and InxAl1-xAs alloys with varying from 0.1 to 0.9. For each , we generated 10 different random simulation cells with the corresponding composition. For each random configuration, we conducted 20 simulations with different starting velocity distributions. Each of the final TC value was averaged over the 200 runs.
In order to isolate the effect of mass difference, we carried out two sets of simulations (all at RT). In the first set, all the cation atoms kept their own masses (m au, m au, and m au). In the second set, the cations were all assigned the same weighted-average VCA mass . Other than this difference, the two sets used the same EIPs and random (not ordered) configurations in the simulation. Figure 3 shows the TC data for both InxGa1-xAs and InxAl1-xAs. The results from the explicit-mass (EM) case and the averaged-mass VCA case are shown in blue diamonds and red dots, respectively. Existing experimental data are shown in stars, for comparison.Abrahams, Braunstein, and Rosi (1959); Koh et al. (2009); Sood et al. (2014)
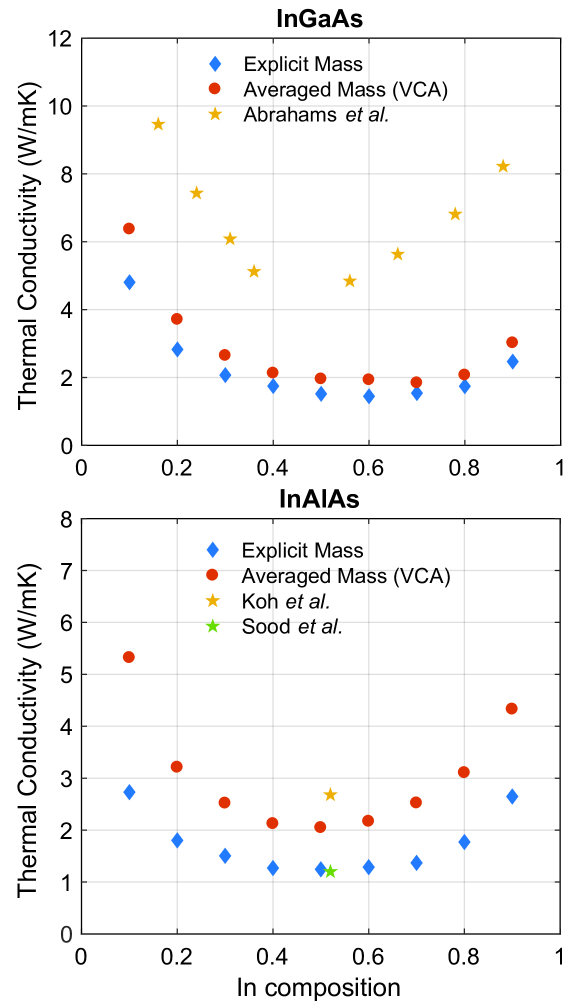
From Fig 3, the EM TC is consistently lower than the VCA TC across the range of different In% for both InxGa1-xAs and InxAl1-xAs. Moreover, the difference between the EM and VCA is much more pronounced in InxAl1-xAs (where the cation mass difference is larger) than in InxGa1-xAs (where the cation mass difference is smaller). Therefore, it is evident that mass-difference scattering of lattice waves is critical in III-V ternary random alloys. Using an averaged VCA mass for cations will underestimate the mass-difference scattering; the larger the mass difference, the greater the underestimate. Additionally, in the case of InxGa1-xAs, both the EM TC and the VCA TC are significantly lower than the experimental value; in the case of InxAl1-xAs, the two experimental results are so far apart that the EM TC and AM TC fall in between the two measurements. As a result, we can conclude that there must be another mechanism that competes with mass-difference scattering to influence the TC of ternary alloys.
V Thermal Conductivity of Ternary Alloys: The Role of Order
Experimentalists who grow and characterize III-V epitaxial layers discovered long ago that both long-range and short-range order exists in ternary III-V alloys.Shahid et al. (1987); Kuan, Wang, and Wilkie (1987); Mori et al. (2004); Kulik et al. (1999); Forrest et al. (2000); Suzuki (2002); Suzuki, Ichihashi, and Nakayama (1998); Suzuki, Ichihasfh, and Tsuji (1999); Gomyo et al. (1994); Ohkouchi et al. (2005); Kuan et al. (1985); Bernard et al. (1990) Order leads to changes in bond length and electronic band gaps. Since phonons are quanta of lattice waves,Ziman (1960) it is intuitive that thermal transport will also change in the presence of ordering. Duda et al.Duda et al. (2011a, b) studied one particular type of order in Si0.5Ge0.5 using nonequilibrium molecular dynamics (NEMD) with a simple Lennard-Jones potential. Baker and NorrisBaker and Norris (2015) later studied both long-range and short-range order in Si0.5Ge0.5 with Stillinger-Weber potentials. We were interested in III-V ternary alloys with compositions away from the 50%-50% case. We also wanted to use EIPs that would give us quantitatively accurate results for TC. It is noteworthy that order in III-V ternary alloy samples is often localized, i.e., it is common to have “poly-ordering,” where the sample has one type of order in one region and a different type of order in another.Kulik et al. (1999); Suzuki, Ichihasfh, and Tsuji (1999); Shin et al. (2006)
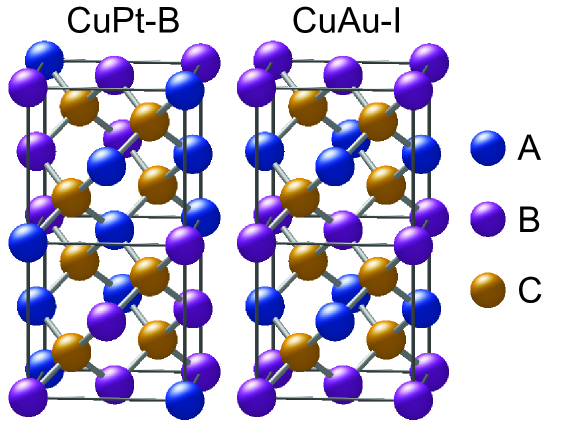
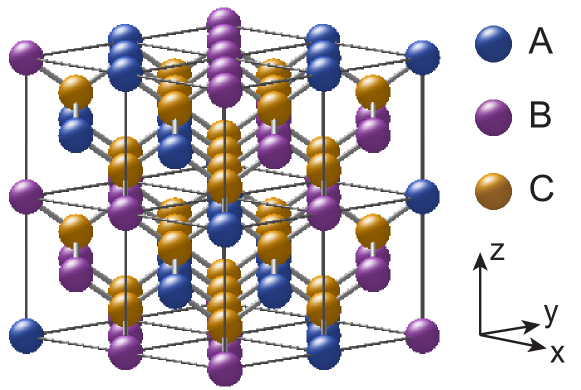
For the sake of simplicity, in this work we only simulated samples with a single type of order and we applied periodic boundary conditions. Moreover, we focused on three different types of order that are most commonly observed in III-V ternary alloys: the CuPt-B type, the CuAu-I type, and the triple-period-A (TPA) type.Suzuki (2002) Both CuPt-B and CuAu-I order yield alloys with the composition A0.5B0.5C within the zinc-blende lattice. Figure 4 shows the crystal structures for CuPt-B and CuAu-I order. In CuPt-B ordering, A atoms and B atoms take alternate cation planes along the [1̄11] direction. In CuAu-I ordering, A atoms and B atoms take alternate cation planes along the [100] direction. Note that perfectly ordered alloys do not exist in experiments, so the alternating planes are actually A-rich and B-rich planes. TPA order in its ideal form refers to the case where the cation planes along [111] direction have a repeated pattern involving 3 planes. Therefore, ternary alloy AxB1-xC with any composition can be represented in some TPA ordering where each period has the arrangement of AuB1-u/AvB1-v/AwB1-w and (note the three planes in a period cannot be all equal or the triple period collapses). Figure 5 depicts a typical crystal structure of ternary alloy A0.5B0.5C where and .
V.1 Thermal Conductivity of Alloys Near A0.5B0.5C Composition with CuPt-B and CuAu-I order
We calculated the RT TC of perfectly ordered In0.5Ga0.5As and In0.5Al0.5As with both CuPt-B and CuAu-I types of order; the results are in Table 2. The calculated TC for In0.5Ga0.5As and In0.5Al0.5As with random alloy structures (with explicit mass) are also shown for comparison. Since there are no experiments on In0.5Ga0.5As and In0.5Al0.5As, we compared the results with experiments on In0.53Ga0.47AsAbrahams, Braunstein, and Rosi (1959) and In0.52Al0.48As.Koh et al. (2009) From Table 2, we concluded that order of either type significantly increases the TC of both In0.5Ga0.5As and In0.5Al0.5As alloys compared to the random-alloy case. The CuAu-I type order leads to slightly higher TC than the CuPt-B type order in both alloys. All the simulated TC values from the perfectly ordered structures were higher than experimental measurements, which is intuitive because In0.53Ga0.47As and In0.52Al0.48As in experiments are 1) not perfectly ordered and 2) have In content different from 50%.
| Material | CuPt-B | CuAu-I | Rand. Alloy | Expt. |
|---|---|---|---|---|
| In0.5Ga0.5As | 12.71 | 14.39 | 1.52 | 4.84 (In0.53Ga0.47As) |
| In0.5Al0.5As | 6.488 | 6.472 | 1.25 | 2.68 (In0.52Al0.48As) |
To directly compare the simulated TC with the experimentally measured TC for In0.53Ga0.47As and In0.52Al0.48As lattice matched to InP, we randomly replace of Ga (Al) atoms in the perfectly ordered structure with In atoms to obtain lattice-matched simulation cells. Table 3 shows the TC of lattice-matched In0.53Ga0.47As and In0.52Al0.48As from both our simulations and experiments. We see that the TC obtained directly from the lattice-matched simulation cells are still quite large compared to experiment, which could be attributed to the existence of additional disorder that is inevitable in real experimental samples. Here we investigate one type of disorder: randomness. We take the lattice-matched simulation cells and randomly swap an In atom with a Ga or Al atom to create disorder. The amount of disorder is categorized by the percentage of swapped In atoms inside the cell. In Table 3, the cells with the simulation results are labeled with LM+, where LM stands for lattice matched and is the level of disorder. Consistent with the findings in Sec. IV, even little disorder () severely reduces the alloy TC. Comparing the calculation with experiments, the level of disorder in In0.53Ga0.47As is around 2% while in In0.52Al0.48As it is approximately 8%. Also, as expected, the calculated lattice-matched TC for InGaAs and InAlAs is lower than the corresponding TC calculated from the perfectly ordered structures.
| CuPt-B | CuAu-I | ||||||
| Material | LM | LM+4% | LM+8% | LM | LM+4% | LM+8% | Expt. |
| In0.53Ga0.47As | 5.022 | 3.165 | 2.585 | 5.728 | 3.567 | 2.845 | 4.84 |
| In0.52Al0.48As | 3.965 | 3.216 | 2.654 | 4.426 | 3.248 | 2.805 | 2.68 |
V.2 Thermal Conductivity of Alloys with Different Compositions and TPA Order
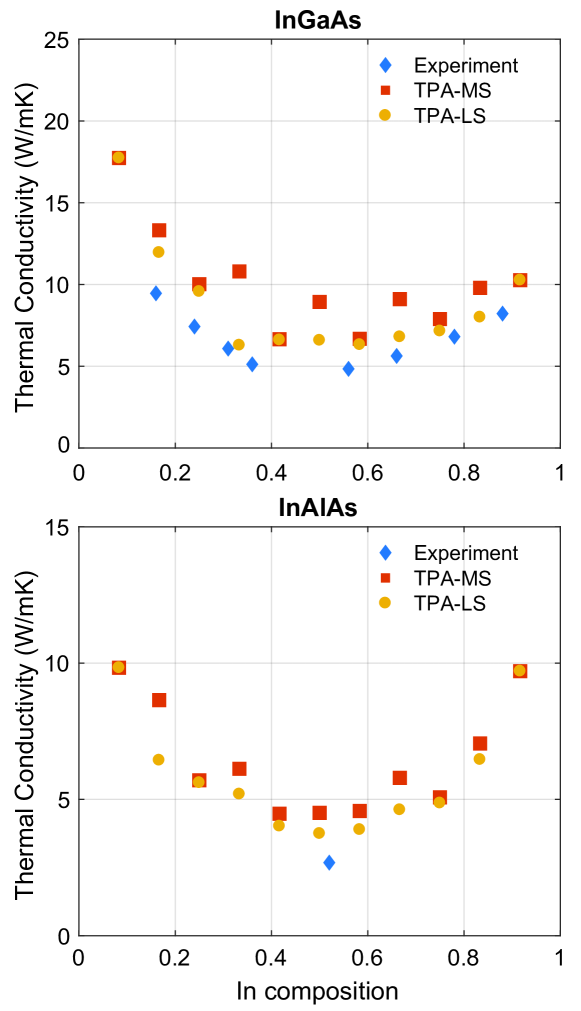
To study the TC of ordered InxGa1-xAs and InxAl1-xAs with various (away from 0.5), we needed to implement TPA order. While it was impossible to consider every feasible arrangement of the TPA order, we simulated the two extreme cases that would likely yield the upper and lower limits of the TC with TPA order for each . The idea is that with more symmetry comes less phonon scattering, and the resulting TC should be higher. Note here we only focused on the perfectly ordered structures, therefore values were limited to multiples of . For each , we generated two TPA cells: most symmetric (MS) and least symmetric (LS). Figure 6 shows the TC calculated from the MS cells (red squares), LS cells (yellow dots), and measured in experiment Abrahams, Braunstein, and Rosi (1959); Koh et al. (2009) (blue diamonds). The results are consistent with our expectations. The MS TC is higher than the LS TC while both are higher than the experimental data (simulated structures are perfectly ordered, while experimental samples contain disorder). TC values of MS and LS fall on top of each other when and because the MS and LS structures are equivalent in these cases. The calculated TC follows the general U-shape (TC is lowest when is close to 0.5 and increases as approaches 0 or 1), except for a sudden TC jump at certain values (). The jumps exist because these fractions are reducible, which leads to additional symmetry in the system.
VI Conclusion
In this paper, we studied the thermal conductivity of III-V ternary alloys, in particular InxGa1-xAs and InxAl1-xAs. Using equilibrium molecular dynamics, we investigated how the mass difference between cation atoms and the arrangement of cations affect thermal transport. Optimized Able-Tersoff EIPs were employed, owing to their demonstrated success in describing III-V binary materials and their nearest-neighbor cutoffs that lend themselves to application in alloys.
We first optimized the Able-Tersoff potentials by matching the calculated phonon dispersion to experiments. We also matched the calculated temperature-dependent TC to experiment so the EIPs would capture higher orders in phonon–phonon interaction that are key in thermal transport. The quantum correction to the temperature was also accounted for in the simulations.
The optimized potentials were used to describe ternary alloys with both random and ordered structures. For random alloys, we compared the cases where atom masses were explicitly considered versus where they were all replaced with the averaged VCA mass, as is commonly done within the Boltzmann transport framework. The results showed that explicit atomic mass drastically reduces the TC of ternary alloys. The larger the mass difference between the cations in the alloy, the larger the discrepancy between explicit-mass and averaged-mass VCA TC results. We concluded that, when cation masses differ a great deal (as is the case for InxAl1-xAs), it is essential to include atomic masses explicitly and any calculation that relies on VCA is likely inaccurate.
Moreover, measured thermal conductivities of ternary alloys are higher than calculations with either explicit or VCA mass and random positioning of cations, which led us to look at longer-range order in alloys. We considered perfectly ordered In0.5Ga0.5As and In0.5Al0.5As with both CuPt-B and CuAu-I types of order and the corresponding lattice-matched alloys In0.53Ga0.47As and In0.52Al0.48As. Order in ternary alloys considerably raises TC. By adding random disorder to the lattice-matched alloys In0.53Ga0.47As and In0.52Al0.48As, we found that experimental results could be reproduced with levels of disorder close to 2% in In0.53Ga0.47As and 8% in In0.52Al0.48As.
We also studied perfectly ordered TPA alloys InxGa1-xAs and InxAl1-xAs with various compositions . We found that more symmetry in the alloy led to higher TC, while the alloys with the least symmetry still yielded higher TC than experiments, indicating the existence of disorder in experiment.
In conclusion, in modeling thermal transport in III-V ternary alloys, it is crucial to include both the explicit masses of atoms and the effects of long-range order. The measured TC for III-V ternary alloys is likely a result of the competition between the two: reduction in TC stemming from mass-difference scattering associated with random disorder and an increase in TC associated with order in the alloy structure. These notions should be incorporated into other techniques for calculating thermal transport in alloys, and highlight the importance of critically evaluating the range of validity of even very common approximations, such as the VCA.
Acknowledgements.
The authors thank Luke Mawst for bringing the issue of long-range order in III-V alloys to our attention. We are also grateful to Dan Botez, Mark Eriksson, Jeremy Kirch, Gabriel Jaffe, and Colin Boyle for useful discussions. This work was supported by the the U.S. Department of Energy, Office of Science (Basic Energy Sciences, Division of Materials Sciences and Engineering, Physical Behavior of Materials Program) under Award No. DE-SC0008712. The simulation work was performed using the compute resources and assistance of the UW-Madison Center For High Throughput Computing (CHTC) in the Department of Computer Sciences.References
- Faist et al. (1994) J. Faist, F. Capasso, D. L. Sivco, C. Sirtori, A. L. Hutchinson, and A. Y. Cho, Science 264, 553 (1994).
- Köhler et al. (2002) R. Köhler, A. Tredicucci, F. Beltram, H. E. Beere, E. H. Linfield, A. G. Davies, D. A. Ritchie, R. C. Iotti, and F. Rossi, Nature 417, 156 (2002).
- Razeghi et al. (2013) M. Razeghi, N. Bandyopadhyay, Y. Bai, Q. Lu, and S. Slivken, Opt. Mater. Express 3, 1872 (2013).
- Adachi (2007) S. Adachi, J. Appl. Phys. 102, 063502 (2007).
- Afromowitz (1973) M. A. Afromowitz, J. Appl. Phys. 44, 1292 (1973).
- Kim, Rodwell, and Gossard (2002) Y. M. Kim, M. J. W. Rodwell, and A. C. Gossard, J. Electron. Mater. 31, 196 (2002).
- Cahill et al. (2003) D. G. Cahill, W. K. Ford, K. E. Goodson, G. D. Mahan, A. Majumdar, H. J. Maris, R. Merlin, and S. R. Phillpot, J. Appl. Phys. 93, 793 (2003).
- Cahill et al. (2014) D. G. Cahill, P. V. Braun, G. Chen, D. R. Clarke, S. Fan, K. E. Goodson, P. Keblinski, W. P. King, G. D. Mahan, A. Majumdar, H. J. Maris, S. R. Phillpot, E. Pop, and L. Shi, Appl. Phys. Rev. 1, 011305 (2014), http://dx.doi.org/10.1063/1.4832615.
- Abrahams, Braunstein, and Rosi (1959) M. Abrahams, R. Braunstein, and F. Rosi, J. Phys. Chem. Solids 10, 204 (1959).
- Koh et al. (2009) Y. K. Koh, S. L. Singer, W. Kim, J. M. O. Zide, H. Lu, D. G. Cahill, A. Majumdar, and A. C. Gossard, J. Appl. Phys. 105, 054303 (2009).
- Mei and Knezevic (2015) S. Mei and I. Knezevic, J. Appl. Phys. 118, 175101 (2015).
- Abeles (1963) B. Abeles, Phys. Rev. 131, 1906 (1963).
- Adachi (1983) S. Adachi, J. Appl. Phys. 54, 1844 (1983).
- Sood et al. (2014) A. Sood, J. A. Rowlette, C. G. Caneau, E. Bozorg-Grayeli, M. Asheghi, and K. E. Goodson, Appl. Phys. Lett. 105, 051909 (2014), http://dx.doi.org/10.1063/1.4892575.
- Shahid et al. (1987) M. A. Shahid, S. Mahajan, D. E. Laughlin, and H. M. Cox, Phys. Rev. Lett. 58, 2567 (1987).
- Shin et al. (2006) K. Shin, J. Yoo, S. Joo, T. Mori, D. Shindo, T. Hanada, H. Makino, M. Cho, T. Yao, and Y.-G. Park, MATER. TRANS. 47, 1115 (2006).
- Kuan, Wang, and Wilkie (1987) T. S. Kuan, W. I. Wang, and E. L. Wilkie, Appl. Phys. Lett. 51, 51 (1987).
- Mori et al. (2004) T. Mori, T. Hanada, T. Morimura, K. Shin, H. Makino, and T. Yao, Appl. Surf. Sci. 237, 230 (2004).
- Kulik et al. (1999) J. Kulik, R. Forrest, J. Li, T. Golding, S. C. Moss, and J. Bai, MRS Proceedings 583 (1999), 10.1557/PROC-583-179.
- Forrest et al. (2000) R. L. Forrest, J. Kulik, T. D. Golding, and S. C. Moss, J. Mater. Res. 15, 45–55 (2000).
- Suzuki (2002) T. Suzuki, in Spontaneous Ordering in Semiconductor Alloys, edited by A. Mascarenhas (Springer US, New York, 2002).
- Suzuki, Ichihashi, and Nakayama (1998) T. Suzuki, T. Ichihashi, and T. Nakayama, Appl. Phys. Lett. 73, 2588 (1998).
- Gomyo et al. (1994) A. Gomyo, K. Makita, I. Hino, and T. Suzuki, Phys. Rev. Lett. 72, 673 (1994).
- Ohkouchi et al. (2005) S. Ohkouchi, T. Furuhashi, A. Gomyo, K. Makita, and T. Suzuki, Appl. Surf. Sci. 241, 9 (2005).
- Kuan et al. (1985) T. S. Kuan, T. F. Kuech, W. I. Wang, and E. L. Wilkie, Phys. Rev. Lett. 54, 201 (1985).
- Bernard et al. (1990) J. E. Bernard, R. G. Dandrea, L. G. Ferreira, S. Froyen, S. Wei, and A. Zunger, Appl. Phys. Lett. 56, 731 (1990).
- Tersoff (1988) J. Tersoff, Phys. Rev. B 37, 6991 (1988).
- Tersoff (1989) J. Tersoff, Phys. Rev. B 39, 5566 (1989).
- Sayed et al. (1995) M. Sayed, J. Jefferson, A. Walker, and A. Cullis, Nucl. Instrum. Methods Phys. Res. B 102, 218 (1995).
- Powell, Migliorato, and Cullis (2007) D. Powell, M. A. Migliorato, and A. G. Cullis, Phys. Rev. B 75, 115202 (2007).
- Hammerschmidt, Kratzer, and Scheffler (2008) T. Hammerschmidt, P. Kratzer, and M. Scheffler, Phys. Rev. B 77, 235303 (2008).
- Lindsay and Broido (2010) L. Lindsay and D. A. Broido, Phys. Rev. B 81, 205441 (2010).
- Plimpton (1995) S. Plimpton, J. Comput. Phys. 117, 1 (1995).
- Frenkel and Smit (2001) D. Frenkel and B. Smit, Understanding Molecular Simulation: From Algorithms to Applications, Computational Science Series (Elsevier Science, 2001).
- Nosé (1984) S. Nosé, The Journal of Chemical Physics 81, 511 (1984).
- Hoover (1985) W. G. Hoover, Phys. Rev. A 31, 1695 (1985).
- Wang, Chan, and Ho (1990) C. Z. Wang, C. T. Chan, and K. M. Ho, Phys. Rev. B 42, 11276 (1990).
- Lukes and Zhong (2007) J. R. Lukes and H. Zhong, Int. J. Heat Transfer 129, 705 (2007).
- Nordlund et al. (2000) K. Nordlund, J. Nord, J. Frantz, and J. Keinonen, Comput. Mater. Sci. 18, 283 (2000).
- Albe et al. (2002) K. Albe, K. Nordlund, J. Nord, and A. Kuronen, Phys. Rev. B 66, 035205 (2002).
- Srivastava (1990) G. Srivastava, The Physics of Phonons (Taylor & Francis, London, 1990).
- Inyushkin et al. (2003) A. V. Inyushkin, A. N. Taldenkov, A. Y. Yakubovsky, A. V. Markov, L. Moreno-Garsia, and B. N. Sharonov, Semicond. Sci. Technol. 18, 685 (2003).
- Amith, Kudman, and Steigmeier (1965) A. Amith, I. Kudman, and E. F. Steigmeier, Phys. Rev. 138, A1270 (1965).
- Evans et al. (2008) C. A. Evans, D. Indjin, Z. Ikonic, P. Harrison, M. S. Vitiello, V. Spagnolo, and G. Scamarcio, IEEE J. Quantum Electron. 44, 680 (2008).
- Tamarin and Shalyt (1971) P. V. Tamarin and S. S. Shalyt, Sov. Phys. Semicond. 5, 1097 (1971).
- Le Guillou and Albany (1972) G. Le Guillou and H. J. Albany, Phys. Rev. B 5, 2301 (1972).
- Bowers et al. (1959) R. Bowers, R. W. Ure, J. E. Bauerle, and A. J. Cornish, J. Appl. Phys. 30, 930 (1959).
- Lindsay, Broido, and Reinecke (2013) L. Lindsay, D. A. Broido, and T. L. Reinecke, Phys. Rev. B 87, 165201 (2013).
- Dorner and Strauch (1990) B. Dorner and D. Strauch, J. Phys. Condens. Matter 2, 1475 (1990).
- Orlova (1983) N. S. Orlova, Phys. Status Solidi B Basic Solid State Phys. 119, 541 (1983).
- Carles et al. (1980) R. Carles, N. Saint-Cricq, J. B. Renucci, M. A. Renucci, and A. Zwick, Phys. Rev. B 22, 4804 (1980).
- Suzuki, Ichihasfh, and Tsuji (1999) T. Suzuki, T. Ichihasfh, and M. Tsuji, MRS Proceedings 583 (1999), 10.1557/PROC-583-267.
- Ziman (1960) J. M. Ziman, Electrons and Phonons: The Theory of Transport Phenomena in Solids (Oxford University Press, London, 1960).
- Duda et al. (2011a) J. Duda, T. English, D. Jordan, P. Norris, and W. Soffa, J. Heat Transfer 134, 014501 (2011a).
- Duda et al. (2011b) J. C. Duda, T. S. English, D. A. Jordan, P. M. Norris, and W. A. Soffa, J. of Phys. Condens. Matter 23, 205401 (2011b).
- Baker and Norris (2015) C. H. Baker and P. M. Norris, Phys. Rev. B 91, 180302 (2015).