The -axis dimer and its electronic break-up: the insulator-to-metal transition in Ti2O3
Abstract
We report on our investigation of the electronic structure of Ti2O3 using (hard) x-ray photoelectron and soft x-ray absorption spectroscopy. From the distinct satellite structures in the spectra we have been able to establish unambiguously that the Ti-Ti -axis dimer in the corundum crystal structure is electronically present and forms an molecular singlet in the low temperature insulating phase. Upon heating we observed a considerable spectral weight transfer to lower energies with orbital reconstruction. The insulator-metal transition may be viewed as a transition from a solid of isolated Ti-Ti molecules into a solid of electronically partially broken dimers where the Ti ions acquire additional hopping in the - plane via the channel, the opening of which requires the consideration of the multiplet structure of the on-site Coulomb interaction.
The role of ion pair formation for the metal-insulator transition (MIT) in early transition metal oxides with the octahedra sharing either a common face or a common edge has been a matter of debate in the past several decades Goodenough (1960); Zeiger (1975); Van Zandt et al. (1968); Castellani et al. (1978); Rice (1995); Mattheiss (1996); Mila et al. (2000); Park et al. (2000); Shiina et al. (2001); Elfimov et al. (2003); Tanaka (2004); Poteryaev et al. (2004); Eyert et al. (2005); Biermann et al. (2005); Haverkort et al. (2005); Koethe et al. (2006); Sato et al. (2006); Uchida et al. (2008). Based on the presence of the -axis V–V dimers in the corundum crystal structure of V2O3, C. Castellani et al. Castellani et al. (1978) proposed a molecular singlet model for the orbitals, projecting the system effectively onto a solid with entities which then should carry the essential physics for the MIT and the magnetic structure in the antiferromagnetic insulating phase. However, soft x-ray absorption spectroscopy (XAS) experiments Park et al. (2000) showed that the two electrons on each V are in the high-spin state, implying that the atomic Hund’s rule coupling is much stronger than the intra-dimer hopping integrals. Furthermore, using band structure calculations Elfimov et al. Elfimov et al. (2003) found that the intra-dimer hopping integral is not the most important one, rather that the hopping integrals between second, third and fourth nearest V neighbors are at least equally important: in other words, the -axis dimers need not to be present electronically although structurally they are there.
Ti2O3 shares much of the fascination as V2O3. It has also the corundum crystal structure (see the inset in Fig. 1) and exhibits upon lowering the temperature a MIT F. J. Morin (1959). The earliest models explained the low temperature insulating phase of Ti2O3 by assuming a band splitting caused by an antiferromagnetic long-range order F. J. Morin (1959). However, different from V2O3, the transition is gradual and is not accompanied by a structural transition nor magnetic ordering Keys and Mulay (1967); Moon et al. (1969); Rice and Robinson (1977). It was also proposed by Goodenough and van-Zandt et al. that the short -axis pair bond length, which is with 2.578 Å at 300 K Abrahams (1963) much shorter than in V2O3 with 2.697 Å at 300 K Dernier (1970), increases the trigonal crystal field splitting so that the conductivity gap is opened Goodenough (1960); Van Zandt et al. (1968). This model is, however, contradicted by band structure calculations which showed that the overlap of the and orbitals can only be suppressed for an unrealistically short bond length Mattheiss (1996), i.e. Ti2O3 is a metal at all temperatures with mixed - states for the -axis dimer from the point of view of band theory Zeiger (1975); Mattheiss (1996); Eyert et al. (2005). Correlation effects have to be included in one way or another to explain the insulating ground state in Ti2O3 Tanaka (2004); Poteryaev et al. (2004); Iori et al. (2012); Guo et al. (2012); Singh and Pulikkotil (2016).
Here we report on our spectroscopic study of the electronic structure of Ti2O3 with the goal to determine whether and how correlation effects and the -axis dimer play a role for the formation of the low-temperature insulating phase. Moreover, we would like to identify the key factors in the electronic structure that can transform the compound from an insulator into a metal. We found in our spectra direct evidence that Ti2O3 is a strongly correlated system in which the -axis Ti-Ti dimers form isolated molecular singlets at low temperatures, and that at high temperatures the dimers partially break-up electronically with the Ti ions gaining hopping in the - plane via the channel. Crucial is that the orbital switching from towards is possible only if the multiplet aspect of the on-site Coulomb interaction is another decisive element in the electronic structure of Ti2O3.
X-ray photoelectron spectroscopy (XPS) measurements with eV were performed in Cologne using a Vacuum Generators twin crystal monochromatized Al- source and a Scienta SES-100 electron energy analyzer. The overall energy resolution was set to 0.4 eV. Hard x-ray photoelectron spectroscopy (HAXPES) experiments were carried out at the ID16 beamline of the ESRF using the VOLPE spectrometer with eV and an overall resolution of 0.4 eV, as well as at the Taiwan beamline BL12XU at SPring-8 using the Max-Planck-NSRRC end-station equipped with a MB Scientific A-1 HE hemispherical analyzer employing keV and an overall resolution of 0.2 eV. Soft-x-ray absorption spectra (XAS) were collected at the Dragon beam line at the NSRRC in Taiwan in the total electron yield mode with a photon energy resolution of 0.25 eV and degree of linear polarization of 98%. All spectra were collected from freshly in vacuo cleaved Ti2O3 single crystals. Ti2O3 single crystals were grown by using the floating zone method. The purity and structure of crystals were verified as a single phase crystal by using EDX, powder diffraction measurements, Laue and polarization microscopy. The stoichiometry of the crystals has been characterized by thermogravimetric analysis.
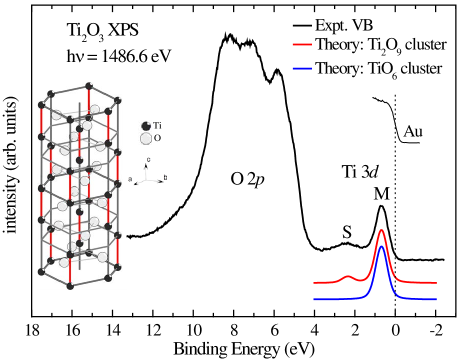
Figure 1 shows the valence band XPS spectrum of Ti2O3 taken at 300 K, i.e. in the insulating phase. The group of peaks at 4–11 eV binding energies is mainly the contribution of O states. The lower binding energy region from the Fermi level up to 4 eV consists of mainly the Ti . This part of the spectrum is characterized by two distinct spectral features. The main line (M) is a quite symmetric peak centered at about 0.68 eV with a width of eV (FWHM). The semiconducting or insulating nature of Ti2O3 at room temperature Van Zandt et al. (1968); Honig and Reed (1968); Honig (1968) is reflected by the fact that the spectral weight vanishes at the Fermi level, in agreement with earlier photoemission reports Kurtz and Henrich (1982); McKay et al. (1987); Smith and Henrich (1988, 1988); Uozumi, Okada, and Kotani (1993); Uozumi et al. (1996) and the observation of a 0.2 eV gap in the optical conductivity Lucovsky et al. (1979); Uchida et al. (2008).
The second feature is a somewhat broader but clearly noticeable satellite (S) at around 2.43 eV binding energy. The origin of this peak has so far been disputed. Ultraviolet photoelectron spectroscopy (UPS) studies had speculated that it was a surface state with a considerable band character Kurtz and Henrich (1982); McKay et al. (1987). However, an angle-resolved UPS study was not able to confirm this speculation Smith and Henrich (1988). We claim here that our spectrum is representative for the bulk material, i.e. that both features M and S belong to the photoemission spectrum of bulk Ti2O3. This relies on the fact that our spectrum was taken on a cleaved single crystal at normal emission with a photon energy of 1486.6 eV, thereby obtaining larger probing depths Weschke et al. (1991); Sekiyama et al. (2000, 2004). Below we will also provide more spectroscopic evidence that all our spectra are representative for the bulk.
The absence of any spectral weight at the Fermi level in the low temperature phase of Ti2O3 invalidates the predictions of band structure calculations Zeiger (1975); Mattheiss (1996); Eyert et al. (2005) which always display a finite density of states at the Fermi level. This is a strong sign that correlation effects play a crucial role. Indeed, using hybrid functionals, non-local exchange, or dynamical mean field approaches (DMFT), one can recover a band gap in the calculations Poteryaev et al. (2004); Iori et al. (2012); Guo et al. (2012); Singh and Pulikkotil (2016). Interestingly, all calculations except the two-site cluster DMFT Poteryaev et al. (2004) did not produce a satellite structure like the feature S we observe at 2.43 eV binding energy. Somewhat puzzling is yet that the two-site cluster DMFT calculation did produce a satellite structure, but with a much too low intensity.
In order to unveil the origin of the satellite structure S, we now resort to configuration interaction cluster calculations with full atomic multiplet theory, an approach which is very successful to explain quantitatively the basic features in many photoelectron and x-ray absorption spectra of transition metal oxides Fujimori and Minami (1984); Tanaka and Jo (1994); de Groot (1994); Theo Thole Memorial Issue (1997). We start with the standard single transition metal site cluster, i.e. a TiO6 octahedral cluster with the Ti ion in the center Uozumi et al. (1996), and use model parameters typical for titanium oxides Tanaka and Jo (1994); Bocquet et al. (1991); Poteryaev et al. (2004); CIpara (2017). We find that the Ti one-electron removal spectrum near the Fermi level consists of a single peak, see the blue curve in Fig. 1. Satellite S is not reproduced in a single-site cluster. Next, motivated by the presence of the Ti-Ti -axis dimer in the crystal structure, we calculate the spectrum of a Ti2O9 cluster consisting of two face-shared TiO6 octahedral units along the c-axis, using the same parameters as for the TiO6 cluster, but with the addition of a parameter describing the inter-Ti hopping CIpara (2017). The result is given by the red curve in Fig. 1 and we can observe that both the satellite structure S and the main peak M can be reproduced very well.
To interpret this result, we can use the following schematic model. The relevant orbital in this Ti-Ti dimer is the one pointing along the bond, namely the . With each Ti ion having the 3+ valence, we then consider the following singlet configurations forming the ground state: , , and , where and denotes the two Ti sites. The configurations with the double occupation on one site have the extra energy Hubbard , and the hopping integral between the and orbitals is denoted by Ashcroft (1981). The photoemission final states, in which one electron has been removed, are given by the following two configurations, namely and , which are degenerate in energy and form bonding and anti-bonding states with energies - and +. Their energy separation, , can then be read directly from the energy separation between feature M and S, i.e. eV ( eV). The intensity ratio between M and S is determined by . For , the intensity of the satellite S vanishes and we are back in a one-electron approximation. In the limit of , M and S will have equal intensities. From the experimental intensity ratios, we estimate that is about , i.e. eV. The essential outcome of the Ti2O9 cluster calculation is thus that the inter-site Ti hopping together with the on-site Coulomb interaction produces a main line M with a satellite structure S, and that the presence of M and S shows that there is a strong electronic bond between the two Ti ions of the dimer.
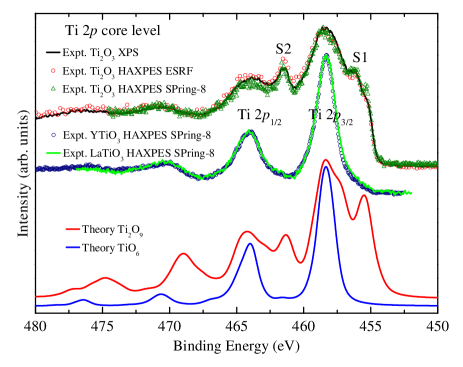
In order to collect more evidence for the presence of the strong electronic bond within the Ti-Ti -axis dimer we now investigate the Ti core level spectrum. Fig. 2 shows the Ti core level spectrum of Ti2O3 taken at 300 K with eV (black line, XPS), with eV (red circle, HAXPES ESRF), and with eV (dark green triangle symbol, HAXPES SPring-8) together with the Ti spectra from YTiO3 (navy circle) and LaTiO3 (green line) with eV (HAXPES SPring-8). The first aspect we would like to mention is that the Ti2O3 XPS spectrum is identical to the bulk-sensitive Ti2O3 HAXPES spectra taken at ESRF and SPring-8. This demonstrates that our XPS spectra, i.e. also the one displayed in Fig. 1, are representative for the bulk material. The Ti core level XPS spectra reported so far in the literature Uozumi et al. (1996); Kurtz and Henrich (1998) have a lineshape different from ours. We have therefore carried out the Ti experiment multiple times, using different batches of Ti2O3 samples, and using the XPS in our home laboratory as well as the more bulk sensitive HAXPES at two different experimental stations (ESRF and SPring8), all to verify that the spectra we were collecting are indeed reproducible. The second aspect to notice, is that the Ti2O3 spectra are very different from those of YTiO3 and LaTiO3, despite the fact that all are Ti3+ compounds. The satellites marked as S1 and S2 have truly massive intensities, indicative of essential differences in the local electronic structure between Ti2O3 and YTiO3/LaTiO3.
To quantify the observations, we calculate the Ti electron removal spectrum using the single-site Ti cluster, i.e. TiO6, and the two-site Ti cluster, i.e. Ti2O9, as described above. The result for the TiO6 cluster is shown by the blue line in Fig. 2: the calculated spectrum is essentially similar to the one reported in Ref. [Uozumi et al., 1996], and it reproduces excellently the YTiO3 and LaTiO3 spectra. The result for the Ti2O9 cluster is quite different from that of the TiO6 cluster, and matches very well the experimental Ti2O3 spectra including the high intensity satellite features S1 and S2. These findings show that the Ti ions in YTiO3 and LaTiO3 are relatively isolated, while in Ti2O3 they form electronically very strongly bonded pairs, fully consistent with the analysis for the valence band spectrum discussed above.
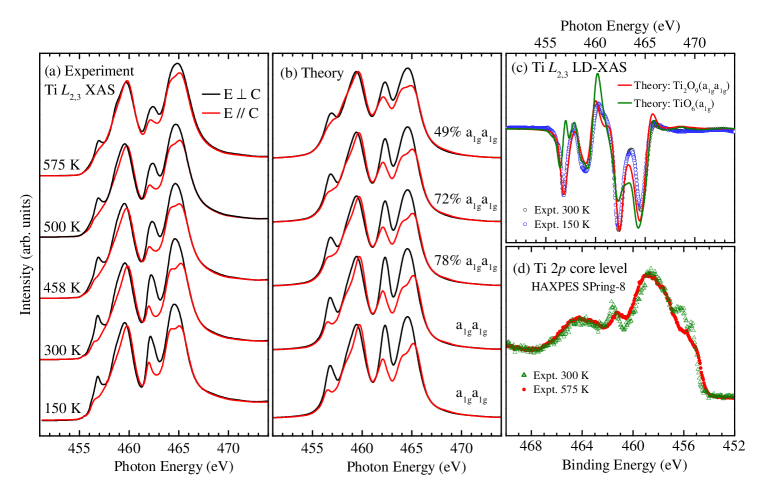
Having established the electronic presence of the -axis dimers, we need to determine or to verify that the relevant orbitals which form the bond are the Ti . We need also to investigate how this orbital occupation may evolve as a function of temperature across the insulator-metal transition. The panel (a) of Fig. 3 shows the polarization-dependent Ti XAS spectra of Ti2O3 taken at 150 K, 300 K, 458 K, 500 K and 575 K, i.e. from deep in the insulating low temperature phase, across the gradual insulator-metal transition, and well into the metallic high temperature phase. We can observe a strong polarization dependence indicative of a distinct orbital occupation of the Ti shell. We can also notice that the polarization dependence decreases across the transition. In order to quantitatively extract the orbital occupation of the Ti states from these Ti L2,3 XAS spectra, we simulated the spectra using the Ti2O9 cluster. The results are shown in the panel (b) of Fig. 3. We can clearly observe the excellent overall match between experiment and theory for all temperatures.
Focusing first on the low temperature phase, we find that the 150 K and 300 K spectra can be very well described by a Ti-Ti -axis dimer in an essentially pure singlet ground state. Also a close-up look at the dichroic spectrum, i.e. the difference between the spectrum taken with c and the spectrum with c spectra, where denotes the electric field vector of the incoming light, shows that the ground state reproduces the experiment to a great detail, see panel (c) of Fig. 3 (experiment: blue and black dots; simulation: red line). By contrast, a single-site TiO6 cluster with a initial state produces a significantly poorer fit (green line). The low temperature XAS spectra thus not only confirm fully the findings from the photoemission experiments shown above about the strong intra-dimer electronic bond but also that this bond is formed by the singlet.
With this finding we in fact restore the presumptions of the early model by Goodenough and van-Zandt et al. Goodenough (1960); Van Zandt et al. (1968) for the insulating state, namely that the ground state is given by the dimer in the singlet. This model has been rejected for decades by band structure calculations Zeiger (1975); Mattheiss (1996); Eyert et al. (2005) on the basis that these calculations found a heavily mixed orbital occupation. We also validate completely the starting point of the Mott-Hubbard model by Tanaka Tanaka (2004), thereby correcting the numbers found in an earlier polarization dependent Ti L2,3 XAS experiment Sato et al. (2006): by extending our experiment to lower temperatures, we ensure that our low temperature spectrum is taken from deep inside the insulating phase, and by including the O 2p ligands in our analysis, we were able to obtain a better match between the simulation and experiment as shown in panel (c) of Fig. 3.
Concerning the temperature evolution, the decrease in the polarization dependence of the XAS spectra across the gradual insulator-metal transition can be ascribed to a re-population of the Ti orbitals Sato et al. (2006). Our simulations find that the occupation of the singlet state is reduced to 78%, 72%, and 49% for = 458 K, 500 K and 575 K, respectively. The orbitals of the Ti shell get more and more occupied. The Ti ion thus becomes electronically less anisotropic, thereby also weakening and eventually, breaking-up the electronic bond of the -axis dimer. This is mirrored by the strong changes in the Ti core-level spectrum and in particular in the reduction of the satellites S1 and S2 intensities, see panel (d) of Fig. 3. Also the lengthening of the -axis dimer bond distance Hwang et al. (2016) across the gradual insulator-metal transition can be viewed as a weakening of the bond.
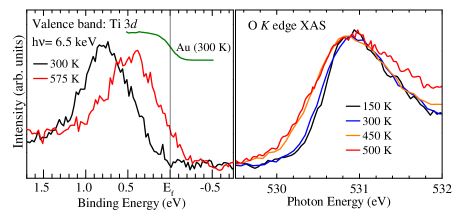
The partial break-up of the dimer and the orbital reconstruction with temperature have consequences for the states closest to the chemical potential. In the left panel of Fig. 4 we display a close-up of the valence band collected with the bulk-sensitive HAXPES method and in the right panel we show the threshold region of the O K edge XAS as an indicator for the unoccupied states. We can clearly observe the gradual closing of the band gap. Perhaps more striking is the fact that spectral weight is transferred over an energy range of 0.3 eV on both sides of the chemical potential. Similar effects can also be seen in the optical conductivity Uchida et al. (2008). One may try to explain these changes in terms of large shifts in the energies of the relevant orbitals Van Zandt et al. (1968); Uchida et al. (2008), or perhaps also in terms of large changes in the strength of the intra-dimer hopping integrals, but the density of states from band structure calculations Zeiger (1975); Mattheiss (1996); Iori et al. (2012); Singh and Pulikkotil (2016) show only modest changes with temperature.
We therefore have to take strong electron correlation effects explicitly into account in the explanation, so that small changes in the one-electron band width and in the strength of the effective Coulomb interaction can lead to large changes in the electronic structure, e.g. a MIT with a large transfer of spectral weight. The key issue for Ti2O3 is the orbital reoccupation away from a pure dimer singlet state at low temperatures. Those dimers are electronically isolated from each other in the solid: the hopping in the - plane for electrons in the orbital (oriented along the -axis) is small ( 1 eV Eyert et al. (2005); Singh and Pulikkotil (2016)) compared to the Coulomb energy =, where ( 3 eV, see above) is the energy repulsion between two electrons doubly occupying the same orbital of one particular Ti site after such a hopping process in the plane.
If on the other hand, the electrons are also allowed to occupy the orbitals, then the hopping in the - plane will be greatly enhanced, simply because the orbitals are much more directed in this plane. Moreover, after such a hopping the doubly occupied state can be a triplet (high spin) . The effective Coulomb energy will then be given by -, where denotes the gain in Hund’s rule exchange energy for pairs of spin-parallel electrons, and where is the energy repulsion between electrons in different orbitals, to be distinguished from which is for electrons in the same orbital. is smaller than by about 2, so that for the situation is smaller by an amount of 3 than the for the . Considering that is typically 0.7 eV Tanaka and Jo (1994), for the can be 2.1 eV smaller than that for the . So for the situation the band width in the - plane ( 1.5 eV Eyert et al. (2005); Singh and Pulikkotil (2016)) can overcome ( 0.9 eV) as to stabilize a metallic state.
To justify that converting a dimer in the singlet situation into a dimer with the triplet requires only a modest amount of energy, we need to estimate the dimer’s total energy in each situation. For the , the hopping between the state with one electron on each Ti and the state with one of the Ti doubly occupied and the other empty is given by (there are two ways to make the latter state, thus the factor). The is given by , see above. For the , the hopping between the state with one electron on each Ti and the state with one of the Ti doubly occupied and the other empty is given by (here we neglect the hopping of the along the -axis completely). The is -, see above. Thus, whereas for the both the hopping and are large, for the both the hopping and are small. One can therefore argue that together with lattice effects one can find physically reasonable parameters as to keep the total energy difference between the two situations within 0.1 eV. These findings provide strong experimental support for the theoretical model proposed by Tanaka Tanaka (2004) to explain the MIT in Ti2O3.
To summarize, using a combination of photoelectron and polarized x-ray absorption spectroscopy we were able to establish that the low temperature phase of Ti2O3 can be viewed as a collection of isolated -axis Ti-Ti dimers in the singlet configuration. Upon heating and crossing the gradual insulator-metal transition, the dimers start to break-up with a reoccupation of the orbitals. The availability of the channel increases the hopping within the - plane. The smaller effective Coulomb interaction for the triplet configuration facilitates the orbital reconstruction and the stabilization of the metallic state at high temperatures.
We thank Lucie Hamdan for her skillful technical assistance. The research in Cologne is supported by the Deutsche Forschungsgemeinschaft through SFB608 and in Dresden through FOR1346.
∗ Current address: Department of Physics, University of Trento, Via Sommarive, 14 - 38123 Povo, Italy
References
- Goodenough (1960) J. B. Goodenough, Direct Cation–Cation Interactions in several oxides, Phys. Rev. 117, 1442 (1960).
- Van Zandt et al. (1968) L. L. Van Zandt, J. M. Honig, and J. B. Goodenough, Resistivity and Magnetic Order in Ti2O3, J. Appl. Phys. 39, 594 (1968).
- Zeiger (1975) H. J. Zeiger, Phys. Rev. B 11, 5132 (1975).
- Castellani et al. (1978) C. Castellani, C. R. Natoli, and J. Ranninger, Unified model of the insulator-metal transition in Ti2O3 and the high-temperature transition in V2O3, Phys. Rev. B 18, 4945 (1978).
- Rice (1995) T. M. Rice, in Spectroscopy of Mott Insulators and Correlated Metals, edited by A. Fujimore and Y. Tokura (Springer, Berlin, 1995), Springer Series in Solid-State Science Vol. 119.
- Mattheiss (1996) L. F. Mattheiss, Electronic structure of rhombohedral Ti2O3, Journal of Physics: Condensed Matter 8, 5987 (1996).
- Mila et al. (2000) F. Mila, R. Shiina, F.-C. Zhang, A. Joshi, M. Ma, V. Anisimov, and T. M. Rice, Orbitally Degenerate Spin-1 Model for Insulating V2O3, Phys. Rev. Lett. 85, 1714 (2000).
- Park et al. (2000) J.-H. Park, L. H. Tjeng, A. Tanaka, J. W. Allen, C. T. Chen, P. Metcalf, J. M. Honig, F. M. F. de Groot, and G. A. Sawatzky, Spin and orbital occupation and phase transition in V2O3, Phys. Rev. B 61, 11506 (2000).
- Shiina et al. (2001) R. Shiina, F. Mila, F.-C. Zhang, and T. M. Rice, Atomic spin, molecular orbitals, and anomalous antiferromagnetism in insulating V2O3, Phys. Rev. B 63, 144422 (2001).
- Elfimov et al. (2003) I. S. Elfimov, T. Saha-Dasgupta, and M. A. Korotin, Role of c-axis pairs in V2O3 from the band-structure point of view, Phys. Rev. B 68, 113105 (2003).
- Tanaka (2004) A. Tanaka, On the Metal-Insulator Transitions in VO2 and Ti2O3 from a Unified Viewpoint, J. Phys. Soc. Jpn. 73, 152 (2004).
- Poteryaev et al. (2004) A. I. Poteryaev, A. I. Lichtenstein, and G. Kotliar, Nonlocal Coulomb Interactions and Metal-Insulator Transition in Ti2O3: A Cluster LDA + DMFT Approach, Phys. Rev. Lett. 93, 086401 (2004).
- Eyert et al. (2005) V. Eyert, U. Schwingenschlögl, and U. Eckern, Covalent bonding and hybridization effects in the corundum-type transition-metal oxides V2O3 and Ti2O3, Europhys. Lett. 70, 782 (2005).
- Biermann et al. (2005) S. Biermann, A. Poteryaev, A. I. Lichtenstein, and A. Georges, Dynamical Singlets and Correlation-Assisted Peierls Transition in VO2, Phys. Rev. Lett. 94, 026404 (2005).
- Haverkort et al. (2005) M. W. Haverkort, Z. Hu, A. Tanaka, W. Reichelt, S. V. Streltsov, M. A. Korotin, V. I. Anisimov, H. H. Hsieh, H.-J. Lin, C. T. Chen, D. I. Khomskii, and L. H. Tjeng, Orbital-Assisted Metal-Insulator Transition in VO2, Phys. Rev. Lett. 95, 196404 (2005).
- Koethe et al. (2006) T. C. Koethe, Z. Hu, M.W. Haverkort, C. Schüßler-Langeheine, F. Venturini, N. B. Brookes, O. Tjernberg, W. Reichelt, H. H. Hsieh, H.-J. Lin, C. T. Chen, and L. H. Tjeng, Transfer of Spectral Weight and Symmetry across the Metal-Insulator Transition in VO2, Phys. Rev. Lett. 97, 116402 (2006).
- Sato et al. (2006) H. Sato, A. Tanaka, M. Sawada, F. Iga, K. Tsuji, M. Tsubota, M. Takemura, K. Yaji, M. Nagira, A. Kimura, T. Takabatake, H. Namatame, and M. Taniguchi, Ti 3d Orbital Change Across Metal-Insulator Transition in Ti2O3: Polarization-Dependent Soft X-ray Absorption Spectroscopy at Ti 2p Edge, J. Phys. Soc. Jpn. 75, 053702 (2006).
- Uchida et al. (2008) M. Uchida, J. Fujioka, Y. Onose, and Y. Tokura, Charge Dynamics in Thermally and Doping Induced Insulator-Metal Transitions of (Ti1-xVx)2O3, Phys. Rev. Lett. 101, 066406 (2008).
- F. J. Morin (1959) F. J. Morin, Oxides Which Show a Metal-to-Insulator Transition at the Neel Temperature, Phys. Rev. Lett. 3, 34 (1959).
- Rice and Robinson (1977) C. E. Rice and W. R. Robinson, High-Temperature Crystal Chemistry of Ti2O3: Structural Changes Accompanying the Semiconductor-Metal Tranisiton, Acta Cryst. B33, 1342 (1977).
- Keys and Mulay (1967) L. K. Keys and L. N. Mulay, Magnetic Susceptibility Measurements of Rutile and the Magnéli Phases of the Ti-O System, Phys. Rev. 154, 453 (1967).
- Moon et al. (1969) R. M. Moon, T. Riste, W. C. Koehler, and S. C. Abrahams, Absence of Antiferromagnetism in Ti2O3, J. Appl. Phys. 40, 1445 (1969).
- Abrahams (1963) S. C. Abrahams, Magnetic and Crystal Structure of Titanium Sesquioxide, Phys. Rev. 130, 2230 (1963).
- Dernier (1970) P. D. Dernier, The Crystal Structure of V2O3 and (V0.962Cr0.038)2O3 near the Metal-Insulator Transition, J. Phys. Chem. Solids 31, 2569 (1970).
- Iori et al. (2012) Federico Iori, Matteo Gatti, and Angel Rubio, Role of nonlocal exchange in the electronic structure of correlated oxides, Phys. Rev. B 85, 115129 (2012).
- Guo et al. (2012) Yuzheng Guo, Stewart J Clark, and John Robertson, Electronic and magnetic properties of Ti2O3, Cr2O3, and Fe2O3 calculated by the screened exchange hybrid density functional, Journal of Physics: Condensed Matter 24, 325504 (2012).
- Singh and Pulikkotil (2016) Vijeta Singh, and J. J. Pulikkotil, Electronic phase transition and transport properties of Ti2O3, Journal of Alloys and Compounds 658, 430 (2016).
- Honig and Reed (1968) J. M. Honig, and T. B. Reed, Electrical Properties of Ti2O3 Single Crystal, Phys. Rev. 174, 1020 (1968).
- Honig (1968) J. M. Honig, Nature of the Electrical Transition in Ti2O3, Rev. Mod. Phys. 40, 748 (1968).
- Kurtz and Henrich (1982) R. L. Kurtz and V. E. Henrich, Surface electronic structure of corundum transition-metal oxides: Ti2O3, Phys. Rev. B 25, 3563 (1982).
- McKay et al. (1987) J. M. McKay, M. H. Mohamed, and V. E. Henrich, Localized 3p excitations in 3d transition-metal-series spectroscopy, Phys. Rev. B 35, 4304 (1987).
- Smith and Henrich (1988) K. E. Smith and V. E. Henrich, Bulk band dispersion in Ti2O3 and V2O3, Phys. Rev. B 38, 5965 (1988).
- Smith and Henrich (1988) K. E. Smith and V. E. Henrich, Resonant photoemission in Ti2O3 and V2O3: Hybridization and localization of cation 3d orbitals, Phys. Rev. B 38, 9571 (1988).
- Uozumi, Okada, and Kotani (1993) T. Uozumi, K. Okada, and A. Kotani, Electronic Structures of Ti and V Oxides: Calculation of Valence Photoemission and Bremsstrahlung Isochromat Spectra, J. Phys. Soc. Jpn. 62, 2595 (1993).
- Uozumi et al. (1996) T. Uozumi, K. Okada, A. Kotani, Y. Tezuka, and S. Shin, Ti 2p and Resonant 3d Photoemission Spectra of Ti2O3, J. Phys. Soc. Jpn. 65, 1150 (1996).
- Lucovsky et al. (1979) C. Lucovsky, J. W. Allen, and R. Allen, in Physics of Semiconductors, Conference Series No. 43, edited by B. L. H. Wilson, 465, (Institute of Physics, London, 1979).
- Weschke et al. (1991) E. Weschke, C. Laubschat, T. Simmons, M. Domke, O. Strebel, and G. Kaindl, Surface and bulk electronic structure of Ce metal studied by high-resolution resonant photoemission, Phys. Rev. B 44, 8304 (1991).
- Sekiyama et al. (2000) A. Sekiyama, T. Iwasaki, K. Matsuda, Y. Saitoh, Y. Onuki, and S. Suga, Probing bulk states of correlated electron systems by high-resolution resonance photoemission, Nature 403, 396 (2000).
- Sekiyama et al. (2004) A. Sekiyama, H. Fujiwara, S. Imada, S. Suga, H. Eisaki, S. I. Uchida, K. Takegahara, H. Harima, Y. Saitoh, I. A. Nekrasov, G. Keller, D. E. Kondakov, A. V. Kozhevnikov, Th. Pruschke, K. Held, D. Vollhardt, and V. I. Anisimov, Mutual Experimental and Theoretical Validation of Bulk Photoemission Spectra of Sr1-xCaxVO3, Physical Review Letters 93, 156402 (2004).
- Fujimori and Minami (1984) Atsushi Fujimori and Fujio Minami, Valence-band photoemission and optical absorption in nickel compounds, Phys. Rev. B 30, 957 (1984).
- Tanaka and Jo (1994) A. Tanaka and T. Jo, Resonant 3d,3p and 3s Photoemission in Transition Metal Oxides Predicted at 2p Threshold, J. Phys. Soc. Jpn. 63, 2788 (1994).
- de Groot (1994) F. M. F. de Groot, X-ray absorption and dichroism of transition metals and their compounds, J. Electron Spectrosc. Relate. Phenom. 67, 529 (1994).
- Theo Thole Memorial Issue (1997) Theo Thole Memorial Issue, J. Electron Spectrosc. Relate. Phenom. 86, 1 (1997).
- Bocquet et al. (1991) A. E. Bocquet, T. Mizokawa, T. Saitoh, H. Namatame,and A. Fujimori, Electronic structure of 3d-transition-metal compounds by analysis of the 2p core-level photoemission spectra, Phys. Rev. B 46, 3771 (1992).
- CIpara (2017) TiO6 cluster [eV]: = 4.0, = 5.5, = 6.5, 10=0.85, = -0.16 for an initial state and 0.16 for an initial state, hybridization = 3.5, = 1.2, = 0.9. Ti2O9 cluster [eV]: The hopping integral between two Ti atoms is simplified as a = 0.9, which is a half of the energy difference between the 3 main peak (M) and the satellite (S) of the valence-band spectrum according to the Hubbard model. Otherwise, all parameters are the same as those used for the TiO6 cluster. For calculating the 2 core-level photoemission spectrum, due to the presence of the core hole, - is 5.5 eV for the Ti2O9 cluster.
- Ashcroft (1981) This is fully analogous to the Hubbard model for the hydrogen molecule discussed by N. W. Ashcroft and N. D. Mermin, Solid State Physics, Ch. 32, Problem 5 (Holt-Saunders, Tokyo, 1981)
- Kurtz and Henrich (1998) Richard L. Kurtz and V. E. Henrich, Comparison of Ti 2p Core-Level Peaks from TiO2, Ti2O3, and Ti metal, by XPS, Surface Science Spectra 5, 179 (1998).
- Hwang et al. (2016) In-Hui Hwang, Bingzhi Jiang, Zhenlan Jin, Chang-In Park, and Sang-Wook Han, Anomalous structural disorder and distortion in metal-to-insulator-transition Ti2O3, J. Appl. Phys. 119, 014905 (2016).