Electronic structure of Pr2MnNiO6 from x-ray photoemission, absorption and density functional theory
Abstract
The electronic structure of double perovskite Pr2MnNiO6 is studied using core x-ray photoelectron spectroscopy and x-ray absorption spectroscopy. The x-ray absorption spectra show that Mn and Ni are in 2+ and 4+ states respectively. Using charge transfer multiplet analysis of Ni and Mn XPS spectra, we find charge transfer energies of 3.5 and 2.5 eV for Ni and Mn respectively. The ground state of Ni2+ and Mn4+ reveal a higher electron count of 8.21 and 3.38 respectively as compared to the atomic values of 8.00 and 3.00 respectively thereby indicating the covalent nature of the system. The O edge absorption spectra reveal a band gap of 0.9 eV which is comparable to the value obtained from first principle calculations for 2 eV. The density of states clearly reveal a strong - type charge transfer character of the system, with band gap proportional to average charge transfer energy of Ni2+ and Mn4+ ions.
I Introduction
Transition metal compounds have always been of great interest since they show diverse physical properties like metal-insulator transition, high temperature superconductivity, multiferroicity and various interesting phenomena like charge/orbital ordering and complex magnetic structuresMott ; Urushibara ; Cava ; Bednorz ; Cheong ; Taniguchi ; Khomskii ; Pavarini ; Tokura ; Lautenschlager ; Tomioka ; Li . These systems include simpler oxides like NiO, MnO or more complex materials like KNiF3, rare-earth manganites, cuprates and nickelatesFujimoriMnO ; ShenNiO ; RicartKNiF3 ; Tokura ; Cava ; Neidmayer1992 . In most cases, the parent compound is usually insulating, which becomes metallic under influence of doping or pressureUrushibara ; Obradors . In a unified scenario, insulating behaviour of the various oxides (or sulphides, dihalides) can be described by the Zannen-Sawatzky-Allen(ZSA) phase diagram, which classifies the materials into Mott-Hubbard and charge-transfer insulatorsSawatzky1985 . The electronic behaviour is governed mainly by three parameters namely Coulomb repulsion in the orbital of the transition metal ion, ligand to metal charge transfer energy and and metal-ligand hybridization strength Sawatzky1985 . In the early transition metal (Ti, V and Cr) compounds, and the bandgap . These materials are known as Mott-Hubbard insulators. The late transition metal based compounds (eg: hole doped cuprates, NiCl2, NiBr2), show greater ligand-metal charge transfer effect and for which Ohta1991 ; Sawatzky1986 . Their band gap , due to which these materials are known as charge transfer insulators. In a charge transfer insulator, the ground state involves a strong fluctuation between and states where is the ligand hole. However in compounds involving Mn and Fe, the scenario is much more complicated and the band gap can be considered of an intermediate character. In addition to ratios, / and /, additional parameters like bandwidth and anion bandwidth play an important role in determining whether the given compound is a metal or insulator.
x-ray photoemision(XPS) and x-ray absorption spectroscopy(XAS) are probes of , and . Appearance of satellite peaks in the XPS spectra help in determining the three parameters using cluster analysis or single impurity Anderson modelBocquet1995 . The position and intensity of the satellite peaks systematically depend on the surrounding ligand. This is also an indicator of strength of covalency and is related directly to the Slater-Koster transfer integrals and . The XPS spectra of the late transition metal compounds is particularly sensitive to and electronegativity of the anion Sawatzky1986 . However the XPS spectra is severely broadened by multiplet and core hole effects. Complementary to XPS is the XAS, which has certain advantages over XPS. Depending on the valency of the metal, the XAS spectra has a distinct shape. Also unlike XPS, which accesses the full multiplet, the no of transitions are restricted by the dipole transition rules.
Core level XPS and XAS studies have been carried out on the rare-earth nickelates(NiO3; = La, Nd, Pr..) and manganites (MnO3) in detail. In the nickelates, studies have shown the variation of covalency and reduced hopping as we vary from La to Nd, causing changes in conducting behaviourMedarde1992 . The Ni ion due to its high valence state of 3+ has a very small charge transfer energy (1 eV) leading to metallicity or an insulator with a very small band gap. In MnO3 compounds, a larger band gap(1 eV) arises due to the Jahn-Teller effect at the Mn3+ site, In CaMnO3 which is an Mn4+ system though belonging to family of manganites, there occurs a large band gap due to the large crystal field splitting in Mn4+ ion SinghLCMO1996 . In MnO3, the ground state shows a larger of and a smaller of states with 4-5 eV. However in (Ca/Sr)MnO3, with a smaller 3 eV as seen from valence band and core level photoemission is considered as a charge transfer insulator Saitoh1995 .
However, the homovalent substitution of Mn and Ni as in LaMn1-xNixO3 leads to totally different ground state, especially for x = 0.5. The half doped compound, LaMn0.5Ni0.5O3 also crystallizes as La2MnNiO6, depending on synthesis techniqueJoly2002 . The former is orthorhombic() while the latter belongs to the class of double perovskite compounds with monoclinic symmetry. In the orthorhombic structure, Mn and Ni ions are randomly arranged, since they occupy the same Wycoff positon . However charge disproportionation results in formation of Mn4+ and Ni2+ by the following reaction, Ni3++Mn3+ Ni2++Mn4+Joly2002 ; Goodenough2003 . This favours a rocksalt like arrangement of Mn and Ni resulting in monoclinic double perovskite compound La2MnNiO6. Our studies are based on the double perovskite material Pr2MnNiO6, which is relatively less explored. The parent compounds, PrMnO3 and PrNiO3 are A-type and G-type antiferromagnetic insulators respectively, while Pr2MnNiO6 is a ferromagnetic insulatorSinghPr2MnNiO62011 . The Mn4+-Ni2+ super-exchange interactions are ferromagnetic in nature, yield a transition temperature, as high as 280 K in La2MnNiO6 RJBooth2009 . With decreasing cationic radii due to increasing , the decrease in Mn-O-Ni bond angle affects the exchange interaction and decreases the magnetic transition temperature. However even in perfectly ordered monoclinic structure, there occurs small percentage of randomness in distribution of Mn and Ni which are known as anti-site disorders. This result in Mn4+-Mn4+ and Ni2+-Ni2+ super-exchange interactions which are anti-ferromagnetic in nature. In the extreme limit of anti-site disorders and random occupancies, there occurs formation of Mn3+ and Ni3+ regions, which can result in Mn3+-Ni3+-ferromagnetic super-exchange interactions. This results in second transition at lower temperature, sometimes leading to a glassy state at low temperaturesJoly2002 ; Shi2011 . Using XPS, one can probe the valence state of Mn with greater precision, since the splitting is proportional to the local spin of the Mn ionGalakhov2002 .
Irrespective of presence of anti-site disorders, even in the perfectly ordered Pr2MnNiO6, the resultant local electronic structure is different from both parent compounds. The combined overlap of Mn-O and Ni-O orbitals would affect the values of , and . Thus it would be interesting to obtain an estimate of these parameters which lead to the ferromagnetic super-exchange interaction and also probe the conducting behaviour(if metallic) or nature of the band gap as per the classification in the ZSA phase diagram. In the present paper we have used XPS and XAS accompanied by cluster-model calculations and density functional theory methods, to investigate the electronic structure of double perovskite Pr2MnNiO6. In addition, the O edge XAS spectra was also obtained and compared with unoccupied density of states along with estimation of the band gap.
II Methodology
II.1 Experimental
The polycrystalline samples of Pr2NiMnO6 a were synthesized by conventional solid-state reaction. Resistivity studies were carried out in temperature range of 4 to 300 K using four probe method. Magnetic properties were measured using a superconducting quantum interference device (SQUID) in the temperature range 10 - 300 K. AC susceptibility measurements were carried out in a commercial CYROBIND set-up in the temperature range 4.2 - 280 K. XPS studies were carried out using Al K source with a hemisphere analyzer with a resolution of 0.5 eV. The binding energies were calibrated w.r.t C photoelectron line with binding energy of 284.6 eV. The spectra was collected at the Mn and Ni edges, Mn edge along with O edge. The XAS studies were carried out at BL-01 beamline in INDUS synchrotron centre, India at room temperature. The XAS spectra was obtained at O edge, Mn and Ni edges using the total electron yield method. The resolution of spectra was 0.1 eV.
II.2 Computational Studies
Computational studies were performed using the projector augmented wavefunction (PAW) method within the density functional theory. The ab-initio simuation package (VASP) was used for this purposekresse1996 . The Pr , Mn , Ni , O O are considered as valence orbitals while the Pr orbitals are considered as core levels. The calculations were performed within the generalized gradient approximation(GGA) formalism. Both GGA and GGA+U formalism was used to see the effect of Coulomb correlationsAnisimov1993 . The plane wave basis was used with a cutoff of 600 eV. Initially the crystal structure was relaxed until the forces on the atoms are less than 0.05 eV/Å . The structural optimisation was carried out assuming a ferromagnetic ordering between the Mn and Ni spins in accordance with experiments. Then the selfconsistent electronic calculations were performed till the energy difference between successsive cycles were less than 10-5 eV. The band structure was obtained along specific directions along the Brillouin zone, while the partial spin polarized density of states were obtained by performing integrations using a 7 x7 x5 Monkhorst pack.
III Results and discussion
The x-ray powder diffraction data of Pr2MnNiO6 was refined to monoclinic space group . The structural parameters obtained from our refinement are = 5.4672Å = 5.5362Å and = 7.7336Å with = 89.88∘. The average Mn-O and Ni-O bondlengths are 1.93 and 2.04Å respectively. The parameters are well in agreement with the reported valuesRJBooth2009 . The three distinct Mn-O and Ni-O bond lengths in the octahedra are almost equal indicating absence of any disortions. The bond valence sums of 3.13 and 2.2 are nearly equal to the valencies expected from Mn4+ and Ni2+ system.
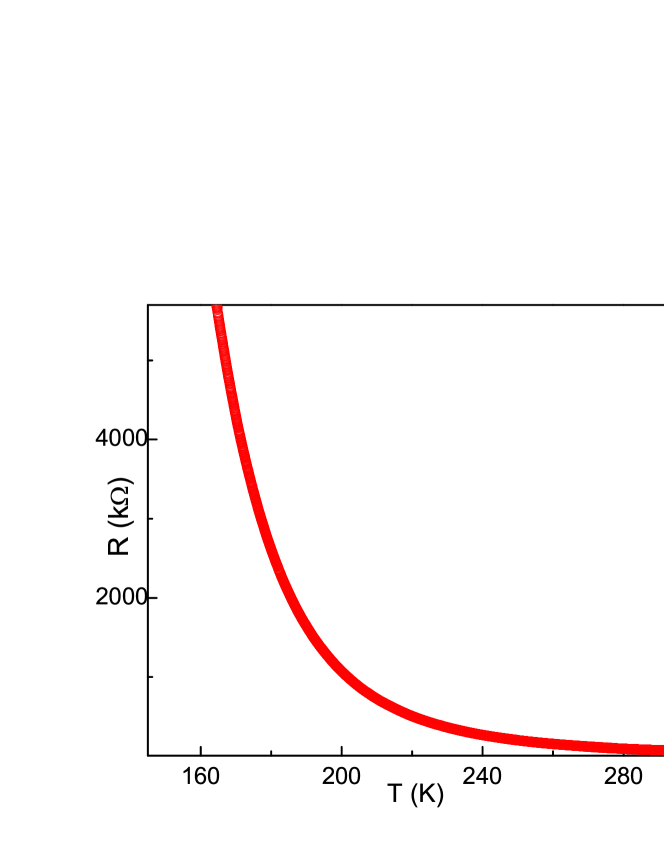
Fig.1 shows plot of resistivity vs. temperature of Pr2MnNiO6. The plot is shown only till 160 K, since the value of resisitivity becomes several mega-ohms below this temperature. Our material is insulating with an activation energy of 0.3 eV. The smaller value of activation energy is in agreement with the predicted band gap as obtained from GGA-based calculations as we would discuss below.
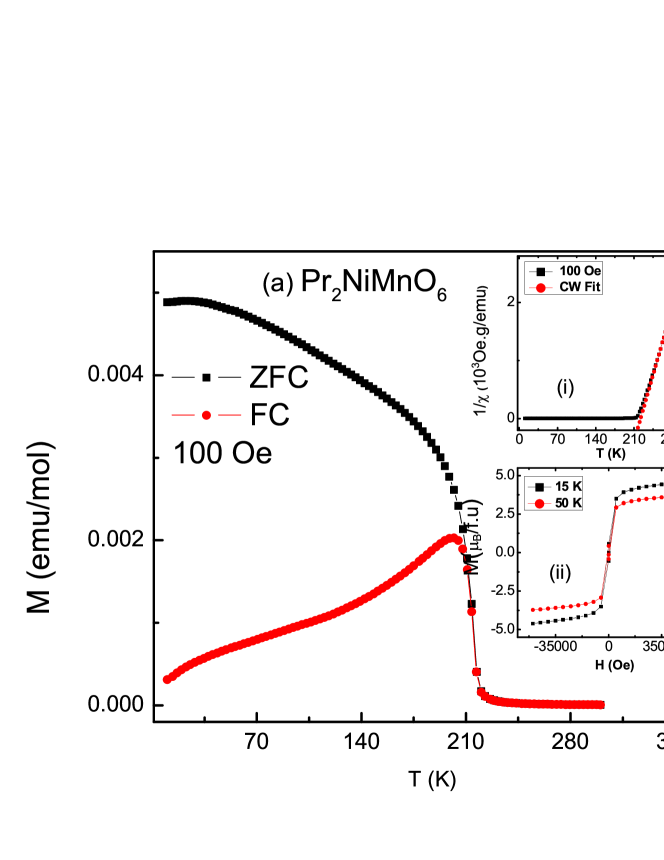
Fig.2 shows magnetization plots of Pr2MnNiO6 for ZFC and FC cooling. The paramagnetic-ferromagnetic transition occurs at 210 K which arises due to O2- mediated Mn4+-Ni2+ super-exchange interactions. Absence of second transition in our system indicates a very low concentration of anti-site disorders.The magnetic moment of Pr2MnNiO6 at 15 K and 5 T is around 4.8 which is close to the expected value of 5 due to perfectly ordered system. However the slightly reduced value and absence of complete saturation in magnetization suggest presence of small amount of anti-site disorders, in addition to role of Pr3+ spins.
III.1 XPS and XAS spectra
III.1.1 Mn spectra
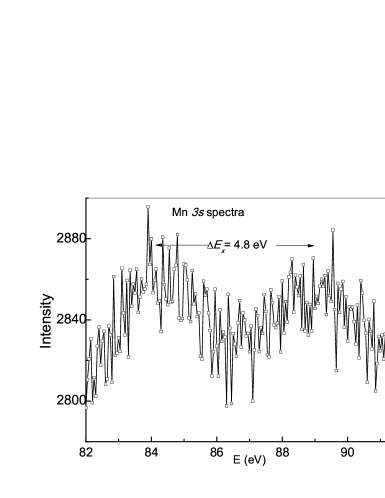
The role of anti-site disorders in affecting the total magnetic moment is obtained more precisely from Mn XPS spectra. The spectra arises due to transition from the initial 2, 3 to 1, 3 states. The Mn spectra shown in fig.3 exhibits a characteristic doublet due to the exchange splitting. The difference between interaction of electron with the parallel and anti-parallel spin states of the shell gives rise to the exchange splitting. This scenario is valid only in the case of early transition metal ions. In the case of Ni , the effect of charge transfer reduces the observed exchange splitting. The magnitude of splitting is proportional the Slater exchange integral (,) which is given by Van-Vleck theorem asVanVleck1934 ,
| (1) |
where =2. The magnitude of increases with decreasing valencyGalakhov2002 . Our experimental spectra reveals an exchange splitting of nearly 4.8 eV. Assuming that = 1.1 eV, the above equation yields a net spin of =1.68Manella2008 . For a complete Mn4+ system like CaMnO3, the value of is nearly 4.5 eVGalakhov2002 , which yields a spin of = 3/2. Thus in our material the value of is very close to the expected spin value of in an Mn4+ system.
The slightly higher value of , indicates presence of Mn3+ ions which arises due to anti-site disorders and mixed occupancy of the Ni(Mn) sites. However the signature of Mn3+ is not so evident from our Mn XPS and XAS spectra.
III.1.2 Simulation of Ni and Mn XPS and XAS spectra
In this section,we briefly discuss the theoretical simulation of the XPS and XAS spectra. The simulations were done in the configuration interaction cluster model, using charge transfer multiplet program CTM4XASdeGroot2005 . The simulations were performed for a single ion of Ni2+ and Mn4+ surrounded by oxygen ligand octahedra in symmetry. The ground state electron configuration of Ni2+ is , which in symmetry can be written as (). We consider two charge transfer configurations, and , where corresponds to a ligand hole in the O state. The Mn4+ ion has configuration in ground state, which can be written as () in symmetry. The calculation of Mn spectra involving two charge transfer configurations is computationally difficult. Hence we consider only the configuration. Also, effects of the configuration is not so prominent in the XPS spectra. The ground state wavefunctions for Ni2+ and Mn4+ ions are given as,
| (2) |
| (3) |
The ligand-metal charge transfer energy is defined as, =E()-E()(H-H), where is the model Hamiltionian describing the ground and excited states as mentioned by Okada et al. Okada1992 . The state occurs at a much higher energy, given by E()-E()=2+, where = E()+E()-2E() is the - Coulomb interactionOkada1992 . The off-diagonal matrix elements, = H = H which are the one-electron transfer integrals correspond to the metal-ligand hybridization. The anisotropy in due to splitting between the and states in Ni2+ and Mn4+ are denoted as and respectively. In our calculations, is fixed at 1 eV, thus is the single adjustable parameter. The hybridizations strengths are related to Slater-Koster transfer integrals, through the expressions = - and =-2Bocquet1992 . The final state involves effect of core hole which reduce final state energies by a constant term. This term, corresponds to the attractive potential between the core hole and the electron. In the case of XPS spectra the final states are,
| (4) |
| (5) |
In the case of XAS, the final states which are of the type are given by,
| (6) |
| (7) |
In the above equations denotes the core-hole wavefunction. The calculations were performed for the entire multiplet spectrumOkada1992 . The and Slater integrals were reduced to 80% of the Hartree-Fock values. The effect of bare crystal field splitting between the and states were also included in the calculation by varying the separation 10 between 0 to 2.5 eV. The intensity of XPS and XAS spectra are calculated using sudden approximationSawatzky1986 ; Okada1992 . For matching the calculated spectra with experiments, the values , and were systematically varied. Similarly, the ratio / was varied between 0.8 and 0.9 for optimum matching between experimental and calculated spectra. The defenition of and are based on the centre of gravity of multiplet of each charge transfer configuration. However, their actual values are defined based on the difference between the lowest multiplet energy of each configuration. These values are appropriately labelled as and . Both the parameters, play a major role in determining the ground state electronic properties of the system.
III.1.3 Ni XPS spectra
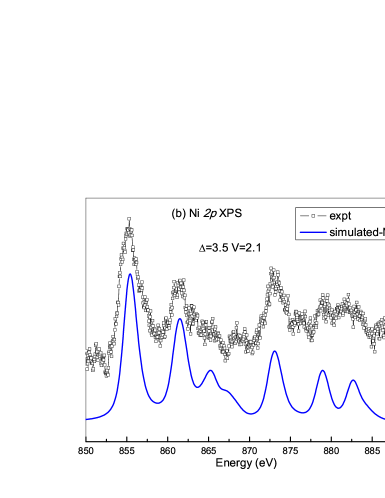
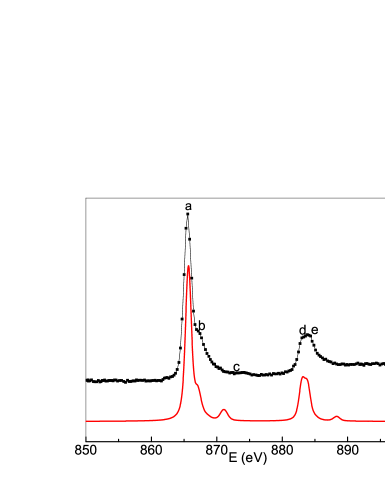
In Fig. 4, we show the Ni XPS spectra of Pr2MnNiO6. The spectra shows spin-orbit split and regions with the peaks located at 855 and 875 eV, respectively. Both the regions contains two additional satellite features in addition to the main peak. The second satellite of the is less prominent and has a lower intensity as compared to both the satellite peaks of . The second satellite of is considerably broadened. The Ni2+ ion in Pr2MnNiO6 is surrounded by oxygen octahedra, similar to that in NiO. However the XPS spectra of NiO shows only a single satellite peak at each edge, which is seen in the bulk as well as thin films of NiO Bocquet1995 ; Sawatzky1986 ; SawatzkyfilmsNiO1996 . The second satellite feature is prominently seen nickel dihalides, NiCl2 and NiBr2 while NiF2 shows only a single satellite peakSawatzky1986 ; Okada1991 . Among the Ni dihalides, NiF2 has the largest value of due to the high electronegativity of fluorine, while is smallest in the case of NiI2. The prominent appearance of the second satellite clearly indicates a lower charge transfer energy and a greater covalency in our material as compared to the highly ionic character of NiO and NiF2.
The simulated Ni XPS spectra for an NiO6 cluster is shown in fig. 4. The spectra is optimised for = 3.5 eV and hybridization ratio / = 2.1 eV to match with the experimental spectrum. The values of and are 7.5 and 9.0 eV respectively. The higher values of are in agreement with the greater charge transfer character of the late transition metal ion compounds. From the relative values of , and , the ground states and final states of the XPS spectra can be classified in four regimes Sawatzky1986 . In our material since, 0, the ground state has the following energy level sequence, E() E() E(). As the three parameters satisfy the following inequalities, 2+ and /2, in the final state, the level energy level sequence becomes E(c) E(c) E(c). Thus in fig. 4, the main peak has a majority character while the first and second satellite peaks have majority and characters. The position and intensity of the satellites are dependent on the ratio of /. The weights of the , and components in the ground state are 0.78701, 0.20697 and 0.00603 respectively, which yields the average electron number = 8.21 in the ground state. Using the relation mentioned by Fujimori et al. Fujimori1993 , we have determined and , which are mentioned in table I. We find that and as seen in the late transition metal ions. Thus analysis of Ni XPS spectra suggests that the Ni-O bond in Pr2MnNiO6 has an intermediate covalent character.
III.1.4 Ni XAS
The Ni absorption spectra shown in Fig. 5, is split due to spin-orbit coupling into and peaks. The spectra displays characteristic feature of an Ni2+ systemSawatzkyb1986 . Compared to the XPS spectra, the satellite intensities are weaker. The absorption spectra contains distinct features marked to as shown in fig. 5. The separation between the main peak and the shoulder peaks and and also the shape of the peaks are affected by and . The XAS spectra qualitatively resembles the spectra of NiBr2 and NiCl2Sawatzkyb1986 . In fig. 5, we also show the simulated Ni2+ XAS spectra, which was obtained for = 3.5 eV and = 2.1 eV. Unlike the XPS spectra, we have assumed only a single charge transfer configuration in the ground state since the states becomes filled for configuration. The spectra was broadened by convoluting the line spectra with a Lorentzian function (0.3 eV) and Gaussian function (0.4 eV). The spectra also shows an additional broadening, especially for features and compared to that observed in the Ni dihalides. This can be attributed to the effect of presence of Ni3+ ions in the system due to random occupancies by Mn/Ni.
III.1.5 Mn XPS spectra
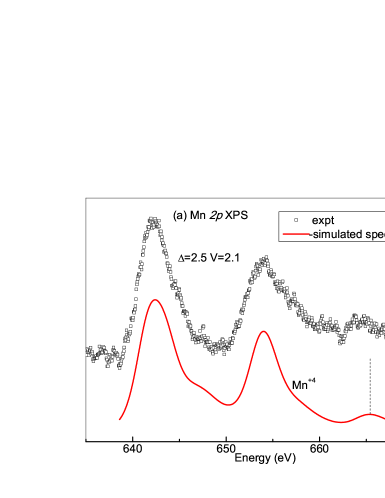
In Fig. 6, we show the Mn XPS spectra of Pr2MnNiO6. The spectra shows and spin-obit doublet peaks located at 642 and 654 eV, respectively. In addition we observe the satellite peak of , at a binding energy of 666 eV. The satellite peak of is not visible since it overlaps with the peak. The position of the satellite peak w.r.t the main peak is sensitive to the -electron countAbbate2002 . In fig.6 we also show the calculated Mn spectra for an MnO6 cluster. The calculated spectra is broadend with a energy dependent Lorentzian and Gaussian function of 0.5 eV each. The Mn spectra is broader compared to Ni due to greater multiplet splitting. The experimental spectra is well reproduced for =2.5 eV and =2.1 eV along with = 6.5 and and = 8.5 eV. Moroever the intensity of the satellite indicates that the system can be described by a pure Mn4+ configuration. Based on the values of the above four parameters, the main peak can be attributed to majority character, while the satellite peak can be attributed to characters. Additional features indicating existence of Mn3+ ions is not so clearly seen in our XPS spectra. This is unlike the case of doped rare earth manganite systems where the satellite feature of the Mn spectra can be expressed as a linear combination of Mn in 3+ and 4+ valence statesAbbate2002 . The weights of the , configurations in the ground state are 0.625 0.375 respectively, which yields the total electron number = 3.38 in the ground state. Thus the higher electron count than the ionic value of 3, arises due to the greater charge transfer character and hybridization in the Mn-O bonds. The relatively smaller value of the charge transfer energy is comparable to the values obtained in isostructural Mn4+ systems viz. CaMnO3 and SrMnO3 Park1996 . Thus the MnO6 octahedra possesses a greater covalency character as compared to NiO6 in Pr2MnNiO6.
III.1.6 Mn XAS spectra
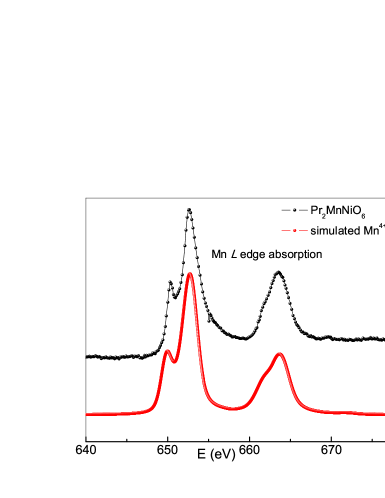
The Mn absorption spectra of Pr2MnNiO6 is shown in fig. 7. The spectra comprises of two main features corresponding to and . Unlike the XPS spectra, the absorption spectra does not show any satellite features. The spectral feature is similar to that observed in CaMnO3, without any distinct sign of Mn3+ featuresdeGroot1992 . The spectra does not show any distinct satellite features due to charge transfer effect. The Mn XAS spectrum is also theoretically simulated for and configurations in the ground state, similar to the XPS spectra. The Mn absorption spectra is highly sensitive to the crystal field splitting , unlike the XPS spectra. The feature at 650 eV becomes prominent with increase in the bare crystal field term 10. The experimental spectra is successfully reproduced for = 2.4 eV. This value is similar to that used for simulation in the case of La0.9Ca0.1MnO3, which is predominantly an Mn4+ systemdeGroot1992 .
| Compound | Ni | Mn | |
|---|---|---|---|
| 3.5 | 2.5 | ||
| 4.5 | 1.5 | ||
| 7.5 | 6.5 | ||
| 5.5 | 6 | ||
| 8.21 | 3.38 | ||
| / | 2.1 | 2.0 | |
| 1.21 | 1.2 |
III.2 O spectra and density of states
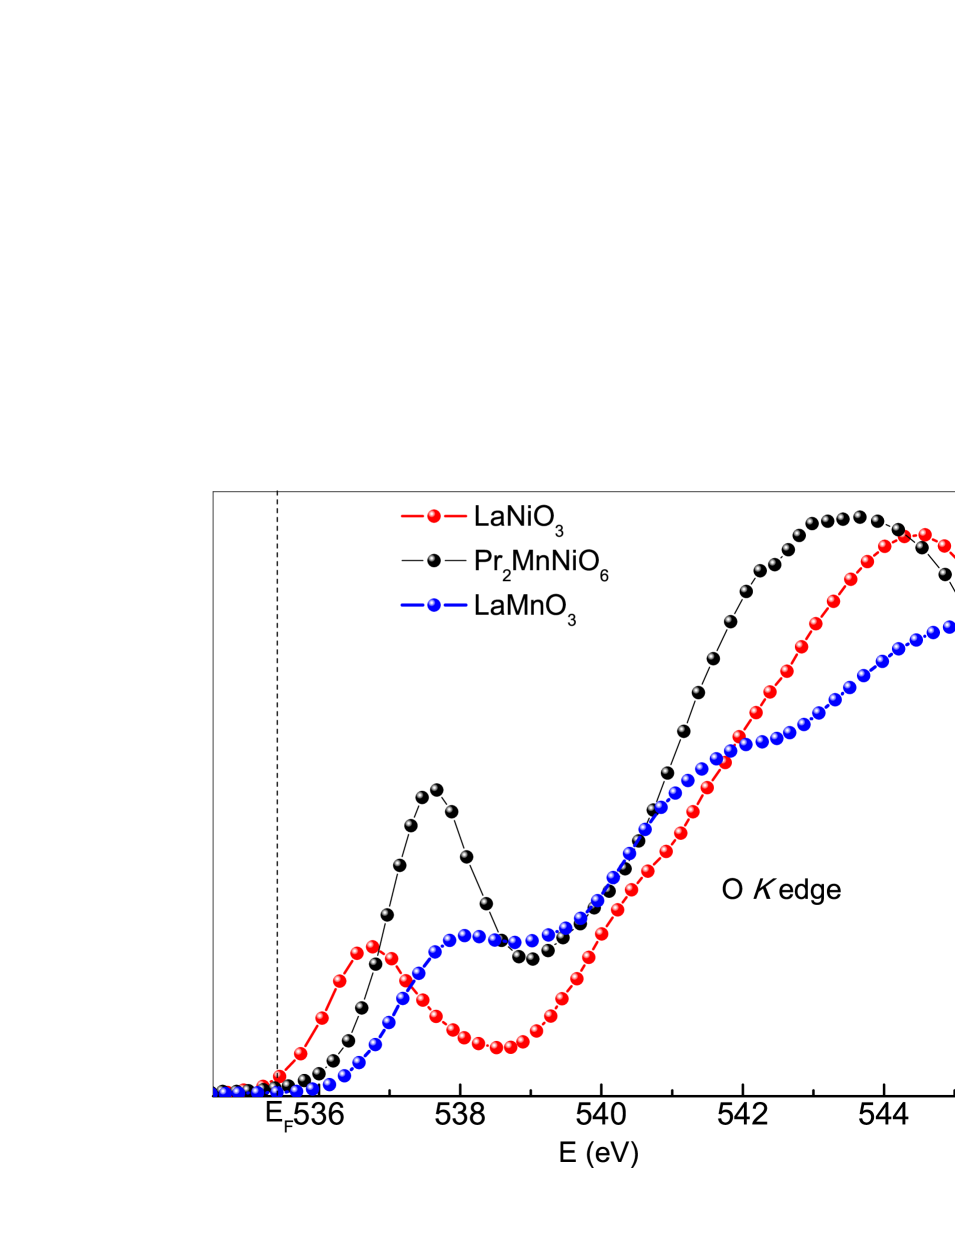
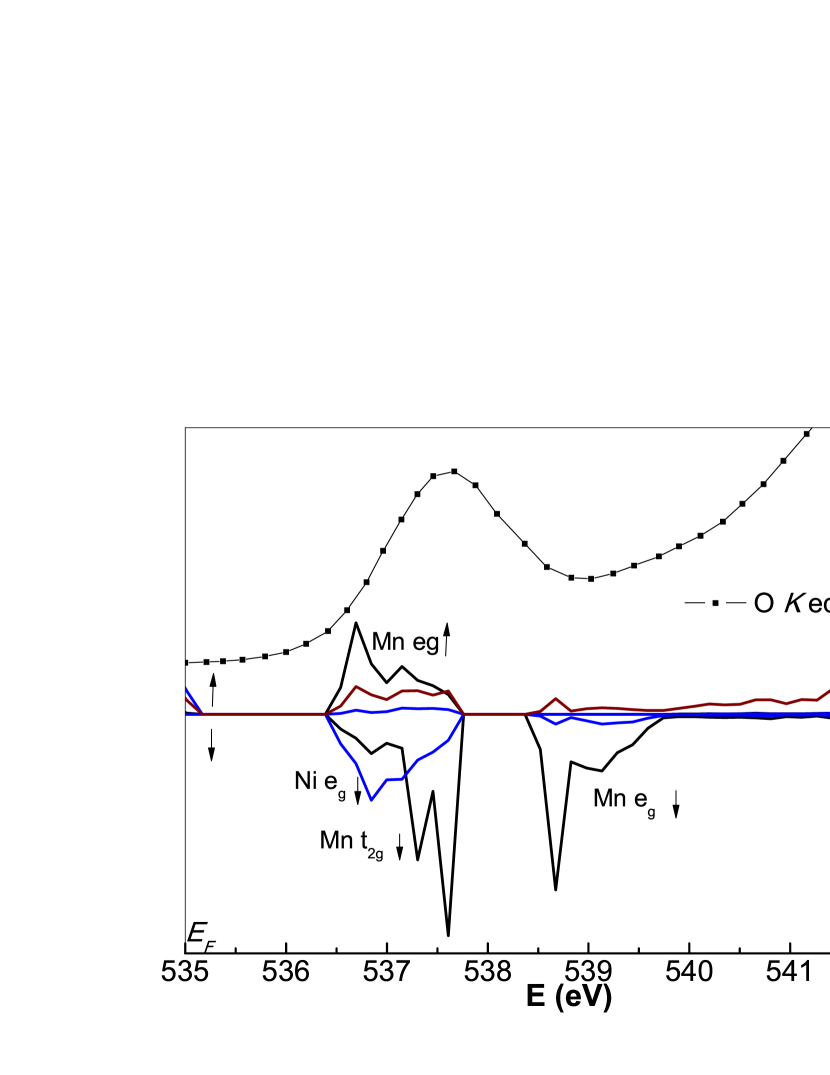
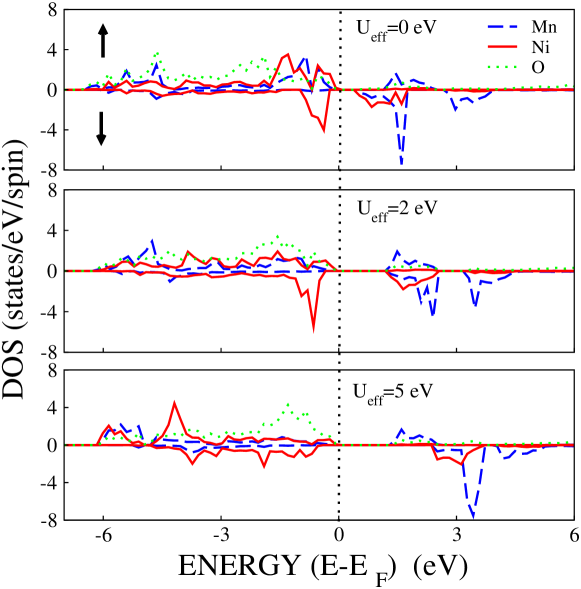
Fig. 8a shows the normalized O edge spectra of Pr2MnNiO6 collected in the total electron yield mode. The first prominent peak of the (536-539 eV) spectra arises due to the transition from O state to unoccupied O states that are hybridized with states of Mn and Ni above the Fermi energy(). For determination of , we present normalized spectra of LaNiO3, which is metallic compound. We also show the spectra of LaMnO3, which has a known band gap. The position of was fixed at the rising edge of LaNiO3 as shown in fig. 8a. The rise in spectra of LaMnO3 occurs around 1.1 eV above , which can thereby be considered as its bandgap, which is close to the bandgap of 1.2 eV obtained from optical conductivity measurementsJung1997 . For comparision of the spectra of three compounds, normalization was done at the post edge above 570 eV, which corresponds to a continuum. Based on the rising edge of spectra, (10 of peak intensity) the estimated bandgap of Pr2MnNiO6 is nearly 0.9 eV which is around 0.6 eV greater than the value obtained from resistivity measurements. However the band gap is much lower than the reported value of 1.4 eV in the case of La2MnNiO6 thin filmsChungfeng2015 . The experimental band gap is also affected by presence of anti-site disorders, which are insulating regions.
The first main peak in Pr2MnNiO6 occurs around 2.5 eV above as seen in fig. 8a. The peak intensity is almost twice that of LaNiO3 and LaMnO3. Along with lower electron count in the Mn4+ ion, the intensity is also affected by the larger covalency between the Mn-O and Ni-O bonds. The intensity of the pre-edge peak is roughly proportional to , which is an indirect measure of the covalency of the ground stateMedarde1992 . Thus large intensity of the O pre-peak edge indicates a greater covalent character of our system as compared to LaMnO3. This is also valid in the case of O edge of PrMnO3Toulemonde1999 , since in MnO3 variation in does not drastically affect the covalency character and the bandgap. The major contribution to the spectral intensity arises from the unoccupied Mn ( and ) and states while a smaller contribution arises from the Ni states. Thus the large enhancement of the unoccupied states above indicating large overlap between the Mn and Ni bands in Pr2MnNiO6.
Fig. 9 shows the spin resolved partial density of states of Pr2MnNiO6 comprising of the states of Mn and Ni along with O states for three values of viz. 0, 2 and 5 eV. The density of states show sufficient mixing between the Mn and Ni states near . The Ni and Mn states split into t2g and eg states due to crystal field splitting. Below , the spin up channel is occupied by the Mn along with Ni and partially filled states. We observe that below -2 eV the O states contribute significantly to the density of states. The Ni eg states occur close to in the range 0 to -1 eV with a peak at -0.8 eV. On the other hand the Ni t2g shows a prominent peak at -1.2 eV. The spin down channel below EF is dominated by the Ni states. Above , the Mn eg states dominate the spin-up channel occuring at around 1.5 eV above . However the the Mn states from the spin-down channel are closer to (+0.5 eV). This shows a strong overlap with the Ni states. The Ni states show a greater delocalization as compared to the Mn states, which affects the magnetic moment. From our first principles calculations, the the Mn moments show a value of 2.8 which is close to its ionic value +3. However the Ni moments show a lesser value of 1.4 compared to its ionic value of 2.0 .
Even for = 0 eV, Pr2MnNiO6 shows a band gap of 0.5 eV which is similar to the values obtained in La2MnNiO6HenaDas2008 . This is unlike the parent manganites which show a ferromagnetic metallic ground state in the absence of correlations. However the band gap is much smaller than the isovalent CaMnO3 or NiO due to the overlap of Ni and Mn states. In addition, the effect of Coulomb correlations is more complex due to the inequivalent nature of the two transition metal ions. To probe its effect, the calculations were also performed for different values of - ie 2, 5 and 8 eV. With increase in ,the spectral weight of O states increase below . In addition, there occurs a shift in Ni and Mn states which become highly localized. Also for = 2 eV and above, our calculations show a higher band gap of 1 eV, which remains constant even at 8 eV(not shown). The constant band-gap indicates absence of any effect on the Mn states above . This is unlike the parent manganites, in which show a greater increase in band gap with increase in in a systematic manner. Since the O pre-edge is a direct representation of the unoccupied DOS, we compare the Mn , Ni and O DOS in fig. 8b for = 2 eV. The nature of spectra qualitatively for = 2 eV since for this value we obtain a band gap of approximately 0.9 eV which is comparable to the rising edge of O edge spectra. Based on the DOS the O pre-peak can be divided into two portions. The first part comprises of the strongly overlapping Mn and Ni states. The large rise in the central portion can be attributed entirely to the Mn states while the subsequent edge arises due to the Mn states. However unlike in parent manganite compounds, there is no effect of on Mn states.
III.3 Role of charge transfer, covalency in band gap
In Pr2MnNiO6, the Ni2+ ion unlike in NiO has smaller charge transfer energy due to which the state has significent occupancy. Similarly, the states are strongly hybridized to the states in the Mn4+ ion. The band gap of the material is determined by interplay of , and , the later two reflecting the degree of covalency between the Ni-O and Mn-O bonds. An estimate of the hybridization strength is obtained from the Slater-Koster method, from the Ni(Mn) -O transfer integral 1/, where corresponds to the average Ni-O and Mn-O bond lengths. The average Ni-O and Mn-O bond-lengths in Pr2MnNiO6 which are 2.04 and 1.9Å respectively, yield = 1.13 eV for Ni-O and a much higher value of 1.8 eV for Mn-O bonds respectively. However the cluster analysis of XPS spectra yield nearly equal values, ie = 1.21 eV for both the ions. In case of Ni2+-O bond, is comparable to its bare Slater-Koster integral, and also close to the value obtained for NiO from cluster analysisBocquet1992 . However the Mn4+-O bond in our system shows considerable reduction in , when compared to values obtained for isovalent SrMnO3 and CaMnO3. For the Mn4+-O bond in both these compounds, is in the range between 1.5 and 1.6 eV, as obtained from XPS and XAS spectraSaitoh1995 ; Abbate2002 .
Thus CaMnO3 and SrMnO3 with a much smaller show a strongly hybridized ground state due to which they are considered as charge transfer insulators, though with a much larger bandgap. In the case of parent LaMnO3, a large value of 2.2 eV is obtained for , but due to relatively higher value of the MnO3 compounds have a mixed character, ie between that of a Mott-Hubbard and charge transfer insulator in the ground stateDDSarma1993 .
In the case of NiO3, the scenario is entirely different. Based on the average Ni-O bondlength of 1.94Å, bare hybridization strength of 0.9 eV is obtained in the case of PrNiO3. However the cluster calculation yields a ground state with large value of 0.55 and = 1.5 eV, which is much greater than the bare Slater-Koster transfer integrals. The large covalency due to a small transfer energy ( 1 eV) and Ni-O-Ni inter-cluster hopping are more sensitive to structural variation in nickelatesNeidmayer1992 . Increase in Ni-O bond length and reduction in Ni-O-Ni bond angles from La to Nd drastically affect the hopping integrals and the bandwidthDDSarma1994 ; DDSarmaJPCM1994 . Thus with varying from La to Nd, this results in a transition from metallic to insulating state with a very small band gap in PrNiO3 and NdNiO3. Due to this, PrNiO3 and NdNiO3 are considered as “covalent insulators” which are intermediate between charge transfer insulator and metal in the ZSA diagram DDSarmaJPCM1994 .
However in the case of 2MnNiO6, the changes in Mn(Ni)-O bond lengths and Mn-O-Ni bond angles do not affect the Mn-O-Ni hopping integrals and the band width of the orbitals, even though there occurs changes in super-exchange strength, which reduces the magnetic transition temperatures. This is also seen indirectly from high pressure studies on La2MnNiO6 which retains its ferromagnetic character even under 30 GPa pressure, with a small variation in and reduction in magnetic momentsHaskel2011 . Thus in the 2MnNiO6 based double perovskites, the charge transfer from oxygen to Mn4+ and Ni2+ ions have a more robust character due to which the bandgap remains largely unaffected.
Based on the scheme of ZSA model, in many of the Ni2+-based compounds(except NiO), the band gap in terms of the simple charge transfer model can be expressed as, = +-/2; where corresponds to the ligand band-width, and =2--, corresponds to lowering of energy of configuration due to hybridizationSawatzky1985 . In a simplified approximation, the band gap is given by -, where ()/2, is the average of the transition metal and ligand bandwidthsFujimori1993 . From the single impurity Anderson model, we can assume that = 4 eV and = 0.5 eV (for Ni and Mn bandwidths). Thus if we consider of Ni2+ ion alone in Pr2MnNiO6, we would obtain a band gap of 2.25 eV, which though smaller than NiO by half still is much greater than the experimental value of 0.9 eV. Due to the highly reduced of Mn4+ ion, we can consider a net charge transfer energy of the system which is average of Mn and Ni. Thus for a net average charge transfer energy, = 3 eV, we obtain a band band gap of 0.75 eV, which is much closer to the experimentally obtained values, thereby suggesting a Ni2+-O-Mn4+ charge transfer effect. The effect of charge transfer nature is also seen from the DOS in fig. 9. At 0 eV, since the highest spectral weight is of , the gap is of type. With increase in , there is a large shift in spectral weight from to O states. Thus from first princples along with XPS studies we can establish that the double perovskite Pr2MnNiO6 is an intermediate covalent compound according to the ZSA diagram, with a band gap which is of “” type.
III.4 Conclusions
To summarize, the electronic structure of double perovskite compound Pr2MnNiO6 is studied using core XPS and XAS along with O edge absorption. The Ni XPS shows a three peak structure indicating a greater charge transfer effect. Using the charge transfer multiplet theory it is found that Ni2+ has a lower charge transfer energy of 3.5 eV as compared to NiO compound resulting in a ground state of Ni is 78 , 21 and 0.6 . Similar analysis of Mn XPS reveal that Mn4+ has a charge transfer energy of 2.5 eV, which is close to that of CaMnO3 and SrMnO3. The ground state of Mn is 62 and 38 . The ground state of Ni2+ and Mn4+ reveal a much higher electron count of 8.21 and 3.38 respectively. Based on our cluster analysis, we estimate a band gap of 0.75 eV which is close to the value obtained from the O edge spectra. Since for Mn4+ and Ni2+, and conditions are satisfied, Pr2MnNiO6 can be considered as a charge transfer insulator, with an intermediate covalent character. The density of states reveal a band gap of nearly 1 eV for 2 eV, and remains constant even for =8 eV. Similarly our density functional theory calculations show that the band gap is of - type confirming the more robust charge transfer nature.
References
References
- (1) Mott N F 1974 Metal Insulator Transitions (Taylor and Francis, London)
- (2) Urushibara A, Moritomo Y, Arima T, Asamitsu M, Kido G and Tokura Y 1995 Phys. Rev. B. 51 14104
- (3) Cava R J, Batlogg B, Krajewski J J, Farrow R and Rupp L W 1988 Nature 332 814
- (4) Bednorz J G and Muller K A 1986 Z. Phys. B 64 189
- (5) Cheong S W and Mostovoy M 2007 Nat. Mater. 6 13
- (6) Taniguchi K, Abe T, Takenobu Y Iwasa Y and Arima T 2006 Phys. Rev. Lett. 97 097203
- (7) Mizokawa T, Khomskii D I and Sawatzky G A 1999 Phys. Rev. B. 60 7309
- (8) Pavarini E and Koch E 2010 Phys. Rev. Lett. 104 086402
- (9) Tokura Y 2000 Colossal Magnetoresistive Oxides (Gordon and Breach, New York)
- (10) Lautenschlager G, Weitzel H, Vogt T, Hock R, Bohm A, Bonnet M and Fuess H 1993 Phys. Rev. B. 48 6087
- (11) Tomioka Y, Asamitsu A, Kuwahara H, Moritomo Y and Tokura Y 1996 Phys. Rev. B. 53 R1689
- (12) Li J Q, Matsui Y, Kimura T and Tokura Y 1998 Phys. Rev. B. 57 R3205
- (13) Fujimori A, Kimizuka N, Akahane T, Chiba T, Kimura S, Minami F, Siratori K, Taniguchi M, Ogawa S and Suga S 1990 Phys. Rev. B. 42 7580
- (14) Shen Z X, List R S, Dessau D S, Wells B Q, Jepsen O, Arko A J, Barttlet R, Shih C K and Parmigiani F 1991 Phys. Rev. B. 42 7580
- (15) Ricart J M, Dovesi R, Roetti C and Saunders V R 1995 Phys. Rev. B. 52 2381
- (16) Torrance J, Lacorre P, Nazzal A, Ansaldo E and Neidmayer C 1992 Phys. Rev. B. (Rapid) 42 8209
- (17) Obradors X, Paulius L M, Maple M B, Torrance J B, Nazzal A I, Fontcuberta J and Granados x 1993 Phys. Rev. B. 47 R12353
- (18) Zannen J, Sawatzky G and Allen J 1985 Phys. Rev. Lett. 55 418
- (19) Ohta Y, Tohyama T and Maekawa S 1991 Phys. Rev. Lett. 66 1228
- (20) Zannen J, Westra C and Sawatzky G 1986 Phys. Rev. B. 33 8060
- (21) Bocquet A, Mizokawa T, Matoba M and S A 1995 Phys. Rev. B. 52 13838
- (22) Medarde M, Fontaine A, Garcia-Munoz J L, Rodriguez-Carvajal J, Santis M, Sacchi M, Rossi G and Lacorre P 1992 Phys. Rev. B. 46 14975
- (23) Pickett W E and Singh D J 1996 Phys. Rev. B. 53 1146
- (24) Saitoh T, Bocquet A E, Mizokawa T, Namatame H, Fujimori A, Abbate M, Takeda Y and Takeda Y 1995 Phys. Rev. B. 51 13942
- (25) Joly V, Joy P, Date S and Gopinath C 2002 Phys. Rev. B 65 184416
- (26) Dass R, Yan J Q and Goodenough J 2003 Phys. Rev. B. 68 064415
- (27) Singh M P, Troung K D, Jandl S and Fournier P 2011 Appl. Phys. Lett. 98 162506
- (28) Booth R, Fillman R, Whitaker H, Nag A, Tiwari R, Ramanujachary K, Gopalakrishnan J and Lofland S 2009 Mater. Res. Bull. 44 1559–1564
- (29) Shi C, Hao Y and Hu Z 2011 J. Phys. D. Appl. Phys. 44 245405
- (30) Galakhov V R, Demeter M, Bartkowski S, Neumann M, Ovechkina N A, Kurmaev E Z, Lobachevskaya N I, Mukovskii Y M, Mitchell J and Ederer D L 2002 Phys. Rev. B. 65 113102
- (31) Kresse G and Furthmuller J 1996 Phys. Rev. B. 54 11169
- (32) Anisimov V I, Solovyev I V, Korotin M A and Czyzyk M T 1993 Phys. Rev. B. 48 16929
- (33) Van Vleck J 1934 Phys. Rev. 45 405
- (34) Mannella N, Booth C, Rosenhahn A, Sell B, Nambu A, Marchesini S, Mun B S, Yang S H, Watanabe M, Ibrahim K, Arenholz E, Young A, Guo J, Tomioka Y and Fadley C 2008 Phys. Rev. B. 77 125134
- (35) deGroot F 2005 Coordination Chemistry Reviews 249 31
- (36) Okada K and Kotani A 1992 J. Phys. Soc. Japan. 61 4619
- (37) Bocquet A, Mizokawa T, Saitoh T, H N and A F 1992 Phys. Rev. B. 46 3771
- (38) Alders D, Voogt F, Hibma T and Sawatzky G 1996 Phys. Rev. B 54 7716
- (39) Okada K and Kotani A 1991 J. Phys. Soc. Japan. 60 772
- (40) Fujimori A, Bocquet A, Saitoh T and Mizokawa T 1993 J. Elec. Spect. Rel. Phen. 62 141
- (41) van der Laan G, Zannen J, Sawatzky G, Karnatak R and Esteva J M 1986 Phys. Rev. B. 33 4253
- (42) Zampieria G, Pradoa F and Caneiroa A 2002 Sol. Stat. Comm. 123 81
- (43) Park J H, Chen C, Cheong S W, Bao W, Meigs G, Chakarian V and Idzerda Y 1996 Phys. Rev. Lett. 76 4215
- (44) Abbate M, de Groot F, Fuggle J, Fujimori A, Strebel O, Lopez F, Domke M, Kaindl G, Sawatzky G, Takano M, Takeda Y, Eisaki H and Uchida S 1992 Phys. Rev. B 46 4511
- (45) Jung J H, Kim K H, Eom D J, Fujimori A, Noh T W, Choi E J, Jaejun Y, Kwon Y S, Kwon Y S and Chung Y 1997 Phys. Rev. B 55 15489
- (46) Lan C, Zhao S, Xu T, Ma J, Hayase S and Ma T 2015 J. Alloys. Compounds. 655 208
- (47) Toulemonde O, Millange F, Studer F, Raveau B and Park J H 1999 J. Phys. Cond. Mat. 11 109
- (48) Das H, Waghmare U V, Saha-Dasgupta T and Sarma D D 2008 Phys. Rev. Lett. 100 186402
- (49) Chainani A, Mathew M and Sarma D 1993 Phys. Rev. B. 47 15397
- (50) Barman S, Chainani A and Sarma D 1994 Phys. Rev. B. 49 8475
- (51) Sarma D D, Shanti N and Mahadevan P 1994 J. Phys. Cond. Mat. 6 10467
- (52) Haskel D, Fabbris G, Souza-Neto N M, Veenendaal v M, Shen G, Smith A E and Subramanian M A 2011 Phys. Rev. B. 84 100403