Resolved star formation and molecular gas properties of green valley galaxies: a first look with ALMA and MaNGA
Abstract
We study the role of cold gas in quenching star formation in the green valley by analysing ALMA 12CO (1-0) observations of three galaxies with resolved optical spectroscopy from the MaNGA survey. We present resolution-matched maps of the star formation rate and molecular gas mass. These data are used to calculate the star formation efficiency (SFE) and gas fraction () for these galaxies separately in the central ‘bulge’ regions and outer disks. We find that, for the two galaxies whose global specific star formation rate (sSFR) deviates most from the star formation main sequence, the gas fraction in the bulges is significantly lower than that in their disks, supporting an ‘inside-out’ model of galaxy quenching. For the two galaxies where SFE can be reliably determined in the central regions, the bulges and disks share similar SFEs. This suggests that a decline in is the main driver of lowered sSFR in bulges compared to disks in green valley galaxies. Within the disks, there exist common correlations between the sSFR and SFE and between sSFR and on kpc scales – the local SFE or in the disks declines with local sSFR. Our results support a picture in which the sSFR in bulges is primarily controlled by , whereas both SFE and play a role in lowering the sSFR in disks. A larger sample is required to confirm if the trend established in this work is representative of green valley as a whole.
Subject headings:
galaxies:evolution galaxies: low-redshift1. INTRODUCTION
It has been known for more than a decade that the distributions of galaxy properties are bimodal in either the color-magnitude diagram (CMD) or the relation between the star formation rate (SFR) and stellar mass (Blanton et al., 2003; Kauffmann et al., 2003; Baldry et al., 2004). Galaxies in between the blue cloud and the red sequence, the so-called ‘green valley’ galaxies (see Salim, 2014, for a review on this topic), are often thought to be in transition from the star-forming phase to the quiescent phase (Bell et al., 2004; Faber et al., 2007; Martin et al., 2007). Under this framework, the scarce density of green valley galaxies implies that either the fraction of star-forming galaxies undergoing star formation quenching is low or the quenching process is fast enough so that the lifetime in the green valley phase is short. Properties of these green valley galaxies thus carry important information on how the star formation is quenched.
A study carried out by Schawinski et al. (2014) has shown that the color-selected transitional galaxies are dominated by galaxies with late-type (disk) morphology with a slowly-declining star formation history, rather than morphologically early-type (elliptical) galaxies of which the star formation is shut down abruptly (also see Smethurst et al., 2015). However, it remains unclear what physical mechanism plays the dominant role in suppressing the star formation of galaxies and produces these two types of green valley galaxies. Furthermore, the underlying star formation history of green valley galaxies can be even more complicated if galaxies are rejuvenated by accreting fresh gas through minor mergers (Haines et al., 2015; Lacerna et al., 2016).
A variety of scenarios have been proposed to explain the shutdown of star formation in galaxies, usually split into so-called ‘nature’ processes - referring to the consequences of internal evolution of galaxies, and ‘nurture’, or the impact of the environment a galaxy lives in. If ‘nature’ processes dominate, galaxies would be expected to grow, evolve, and die inside-out (White & Frenk, 1991; Mo et al., 1998). Recent IFU observations demonstrate that many nearby spiral galaxies show negative gradients in stellar ages and metallicities, supporting this inside-out picture (Sánchez-Blázquez et al., 2014; González Delgado et al., 2014; Li et al., 2015; Goddard et al., 2017; Belfiore et al., 2017). On the other hand, if ‘nurture’ dominates galaxy evolution, external processes such as ram-pressure stripping (Gunn & Gott, 1972), high speed galaxy encounters (Moore et al., 1996), galaxy mergers (Mihos & Hernquist, 1994), and ‘strangulation (Larson et al., 1980; Balogh et al., 2000; Peng et al., 2015), are responsible for quenching. In this picture, star formation quenching is likely to occur globally or in the outer regions of galaxies first due to the lack of continuous supply for the cold gas reservoir.
Previous works in the area of green valley galaxies faced two main limitations. Firstly, earlier optical studies on transitional galaxies largely rely on the single-fiber SDSS spectroscopy, which lacks spatial information and covers only the central part of nearby galaxies. Secondly, although the star formation histories (including recent and on-going SFR) of galaxies can be inferred from UV, optical to infrared data based on the broadband SEDs (spectral energy distributions) and spectral lines, a complete picture of the galaxy evolution processes requires understanding of the cold molecular gas, which serves as the fuel of star formation. In this work, we present the ALMA CO observations of three green valley galaxies selected from the SDSS-IV Mapping Nearby Galaxies at Apache Point Observatory (MaNGA; Bundy et al., 2015; Law et al., 2016; Yan et al., 2016a, b). The focuses of this work are to characterize the role of cold molecular gas in the star formation quenching and to probe the sequence of quenching among substructures of galaxies (e.g., bulge vs. disk) by combining spatially resolved observations of the stellar population and molecular gas. Specifically, we will address whether the declining star formation activity is caused by a depletion of gas or by a suppression of star-forming efficiency in different galactic regions.
Throughout this paper we adopt the following cosmology: H0 = 100 Mpc-1, and . We use a Salpeter IMF and adopt the Hubble constant = 0.7. All magnitudes are given in the AB system.
2. DATA
2.1. MaNGA Targets
| ID | MaNGA ID | RA | Dec | Redshift | (M⋆/) | () | sSFR | (MH2/) | (MHI/) | ()(b) |
|---|---|---|---|---|---|---|---|---|---|---|
| (D) | ||||||||||
| 1 | 1-596678 | 332.89284 | 11.79593 | 0.02695 | 10.88 | 0.46 | 0.24 | 9.47(c) | 10.21 | -9.0 |
| (114.7 Mpc) | ||||||||||
| 2 | 1-114956 | 332.79873 | 11.80073 | 0.02702 | 10.36 | 0.3 | 0.48 | 8.98(d) | 9.87 | -9.2 |
| (115.0 Mpc) | ||||||||||
| 3 | 1-596598 | 331.12290 | 12.44263 | 0.02659 | 10.98 | 0.075 | 0.73 | 9.7(e) | ||
| (113.2 Mpc) |
Note. — (a)Comoving radial distance; (b)The global SFE estimated based in the single-dish CO measurements; (c)Data taken with JCMT by Ting Xiao et al.; (d)Data taken from Saintonge et al. (2012); (e)Galaxy 1 is in the edge of the GBT beam (5.5′away) of Galaxy 3 and both galaxies are at very similar redshifts, so the HI can be attenuated flux from the HI linked to that in the edges of the beam. If there is no HI detected linked to Galaxy 3, the upper limit (assuming a width of 400 km s-1) would be (MHI/) = 9.22 instead.
MaNGA is an on-going integral field unit (IFU) survey on the SDSS 2.5m telescope (Gunn et al. 2006), as part of the SDSS-IV survey (Albareti et al., 2017; Blanton et al., 2017). MaNGA makes use of a modification of the BOSS spectrographs (Smee et al. 2013) to bundle fibres into hexagons (Drory et al. 2015). Each spectra has a wavelength coverage of 3500-10,000Å, and instrumental resolution 60 kms-1 . After dithering, MaNGA data have an effective spatial resolution of 2.5″(FWHM; Law et al. 2015), and data cubes are gridded with 0.5″spaxels.
We make use of the Pipe3D pipeline (Sánchez et al., 2016a) to model the stellar continuum with 156 templates with 39 ages and 4 stellar populations that were extracted from a combination of the synthetic stellar spectra from the GRANADA library (Martins et al., 2005) and the MILES project (Sánchez-Blázquez et al., 2006; Vazdekis et al., 2010; Falcón-Barroso et al., 2011). Details of the fitting procedures are described in Sánchez et al. (2016b). In short, a spatial binning is first performed in order to reach a S/N of 50 accross the entire field of view (FoV) for each datacube. A stellar population fit of the coadded spectra within each spatial bin is then computed. The stellar population model for spaxels with continuum S/N 3 is then estimated by re-scaling the best fitted model within each spatial bin to the continuum flux intensity in the corresponding spaxel, following Cid Fernandes et al. (2013) and Sánchez et al. (2016a). The stellar mass surface density () is then obtained using the stellar mass derived for each spaxel and then normalized to the physical area of one spaxel. We derive the emission line fluxes following the same procedure described in Belfiore et al. (2016). Briefly speaking, the fitting are performed on continuum subtracted spectra using sets of Gaussians (one per line) with a common velocity. The dust attenuation is corrected by using the Balmer decrement, adopting the Calzetti (2001) attenuation curve with and a theoretical value for the Balmer line ratio (H/H= 2.86) taken from Osterbrock & Ferland (2006), assuming case B recombination. SFR is then estimated based on this extinction corrected H flux using the conversion given by Kennicutt (1998) with the Salpeter IMF. Similarly, we convert the spaxel-based SFR into the SFR surface density () by normalizing it to the spaxel area. At at fixed extinction curve and IMF, the uncertainty in the SFR estimate is proportional to that of the H flux and is less than 33% given that we only limit to our analysis to spaxels with S/N (H) ¿ 3.
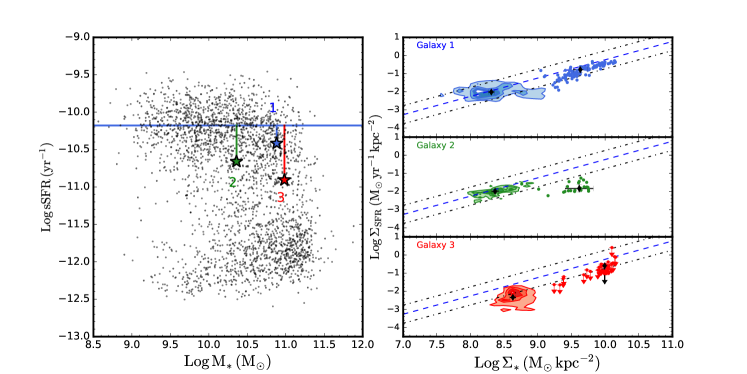
We show in the left panel of Figure 1, the locations of the sSFR, defined as the SFR divided by the stellar mass (), versus for 2730 MaNGA galaxies (black dots), from an internal release (labeled MPL5), very closely equivalent to Data release 13 (Albareti et al 2017), by integrating the Pipe3D results from individual MaNGA spaxels. The three green valley targets (MaNGA 1-596678, 1-114956, and 1-596598) for the ALMA follow-up, highlighted by the color-coded stars, were drawn from the first 118 galaxies observed by MaNGA at the time when the ALMA proposal was prepared. They are randomly selected to be massive galaxies that lie below the star-forming main sequence relation with different separations from the main sequence, sSFR, defined as the offset in log(sSFR) relative to the main sequence value (i.e., log(sSFR) - log(sSFRMS)). Previous studies have revealed significant differences in the slope and normalization of the main sequence (e.g., see Speagle et al., 2014). The selection of the star-forming population, the method determining the star formation rate and stellar mass, as well as the IMF, have a strong effect in determining the properties of the main sequence. In light of this complexity, we compute our own value of sSFRMS based on the Pipe3D results to be self-consistent. The sSFR of the main sequence is determined to be 10-10.18 yr-1, as shown in the blue solid line, by taking the the median sSFR of galaxies with log(sSFR/yr-1) ¿ -10.6. Our derived sSFRMS is close to the value (sSFR 10-10.09 yr-1) derived using the empirical sSFR vs. redshift relation given in Equation (13) of Elbaz et al. (2011). We also require the targets to be accessible by ALMA and we do not impose the constraint on the predicted CO abundance when selecting the targets. We number them 1 to 3 (hereafter Galaxy 1, Galaxy 2, and Galaxy 3) according to their sSFR(see Table 1). Although Galaxy 1 lies close to the lower edge of the star-forming main sequence on the global sSFR – plane, all three galaxies are referred to as ‘green valley galaxies’ loosely in this work.
These three objects were recently observed as part of the HI-MaNGA programme at the Robert C. Byrd Green Bank Telescope (GBT), which is obtaining HI 21cm observations of a large sample of MaNGA galaxies (AGBT17A_012, PI: K. Masters). Galaxies 1 and 2 have HI gas fractions comparable to that of the normal HI galaxies while Galaxy 3 is below the ALFALFA scaling relation (see Figure 2(c) of Huang et al., 2012). In addition, Galaxy 1 and Galaxy 2 were also observed in CO (2-1) with JCMT (PI: Ting Xiao) and CO (1-0) with IRAM (Saintonge et al., 2012), respectively, from which the total H2 mass can be derived. The beam size of JCMT is 22 and is 32.5 for IRAM. The general properties of the three green valley galaxies are summarized in Table 1. We assume the CO(2-1) to CO(1-0) ratio to be 0.7 when calculating the total H2 mass of Galaxy 1.
2.2. ALMA Observations
Molecular gas observations in 12CO(1-0) were carried out with ALMA in Cycle 3 on January 2016 using Band 3 receiver (project code: 2015.1.01225.S; PI: Lihwai Lin). The baseline ranges from 15 to 310 meters. The largest structure that we expect to be sensitive to is about 36 ( 20 kpc). Thus, the missing flux should be negligible. Uranus was observed as flux calibrator for Galaxy 2, and Neptune was used for Galaxy 1 and Galaxy 3. The phase and bandpass of the observations of Galaxy 1 and Galaxy 2 were calibrated with J2232+1143 and J2222+1213 , respectively, and J2200+1030 and J2148+0657 for Galaxy 3. The on-source time is 1 hr for each galaxy.
Our spectral setup includes one line targeting 12CO (1-0). The window has a bandwidth of 0.937 GHz (2500 km s-1), with a channel width of 3906.250 kHz (10.1 km s-1). The data were processed by pipeline (version r35932 and r36660) in the Common Astronomy Software Applications package (CASA, version 4.5.1 r35996 and 4.5.3 r36115).
The task CLEAN was employed for deconvolution with a robust = 0.5 weighting (Briggs). We adopted a user-specified image center, pixel size, and restoring beamsize to match the image grid and the spatial resolution of the MaNGA images during the CLEAN process. The user-specified image center is 0.1 away from the original center in the ALMA observations. We adopt a geometric mean beamsize of the user-specified beam, 2.5 2.5 ( 1.4 1.4 kpc), similar to that of the native beamsize reported by the CLEAN (2.6 2.2). We have confirmed that all results remain unchanged if we instead use the original image center and restoring beamsize. Sensitivity of the three observations are almost identical. The final cubes have channel width of 10.1 km s-1 and rms noise () of 0.5 mJy beam-1. Integrated intensity maps were created from the cubes with a clip in noise of 1.5-. Varying the clipping threshold from 2- to 1.3- results in a change of the CO flux from -15% to +10% with respect to the case using 1.5-. Since the ALMA observations have larger field of view than MaNGA, the edge of ALMA maps were cut off to match the image size of MaNGA. The H2 mass surface density () is computed from the CO surface density by adopting a conversion factor () of 4.3 (K km s-1 pc2)-1 (e.g., Bolatto et al., 2013).
We can compare the total CO flux and/or H2 mass obtained by integrating the ALMA results with those based on single-dish observations for two of our targets. We find that the total ALMA CO(1-0) flux for Galaxy 1 is in good agreement with that derived from the JCMT CO(2-1) observation if adopting a conventional CO(2-1)/CO(1-0) ratio = 0.7. For Galaxy 2, which is part of the COLD GASS sample, its ALMA-integrated H2 mass is factor of 1.9 lower than the value listed in the COLD GASS catalog when applying the same . We suspect that this discrepancy may be related to the method of aperture correction used in the COLD GASS estimation for this object.
3. Results
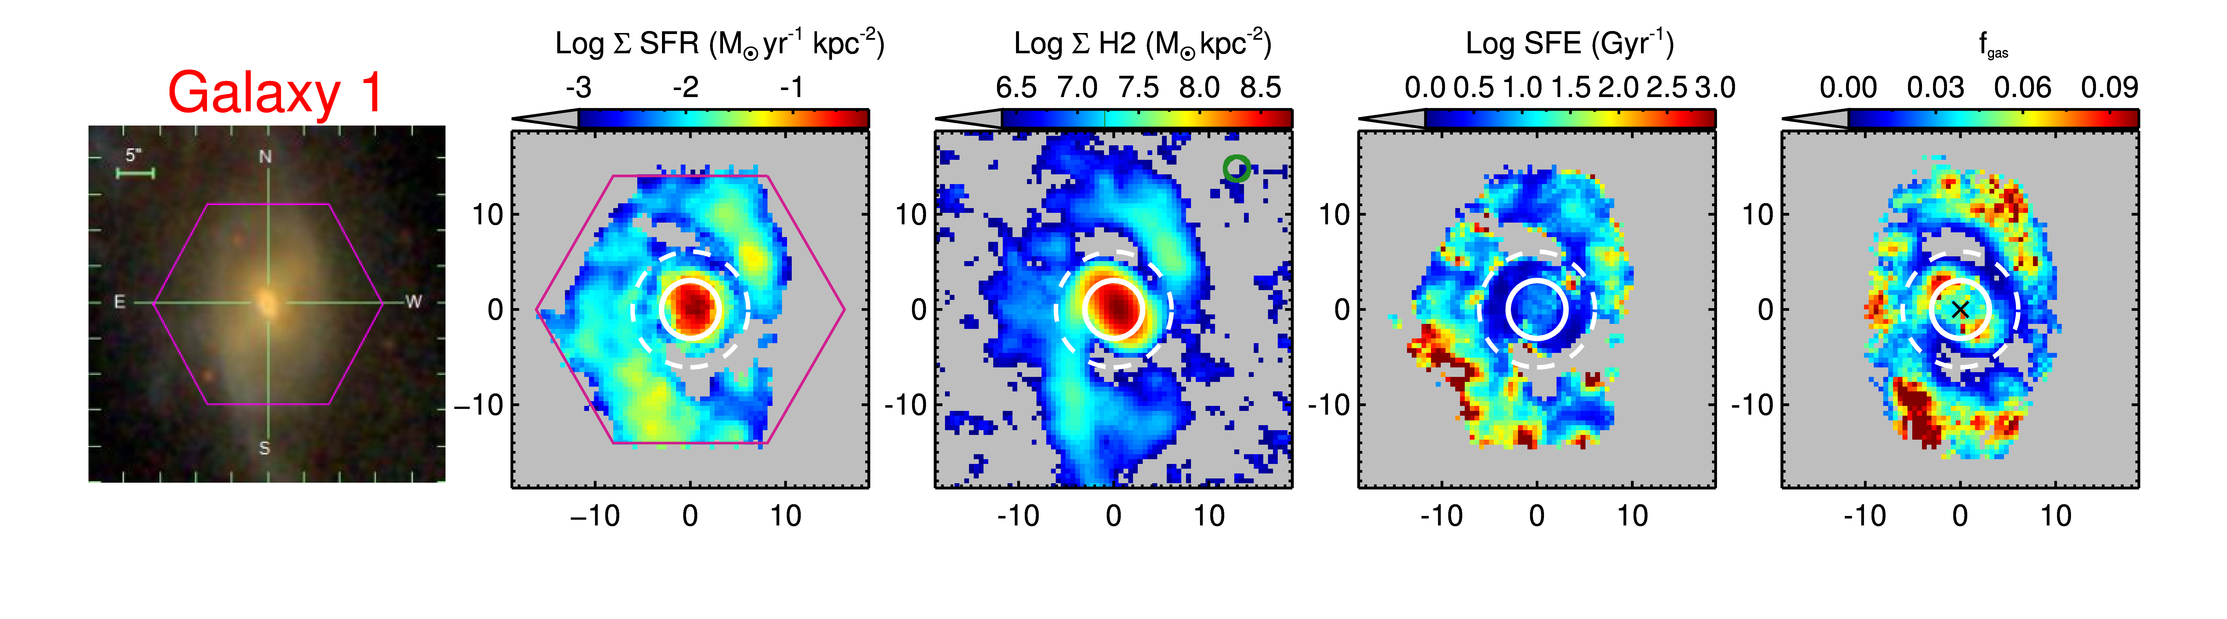
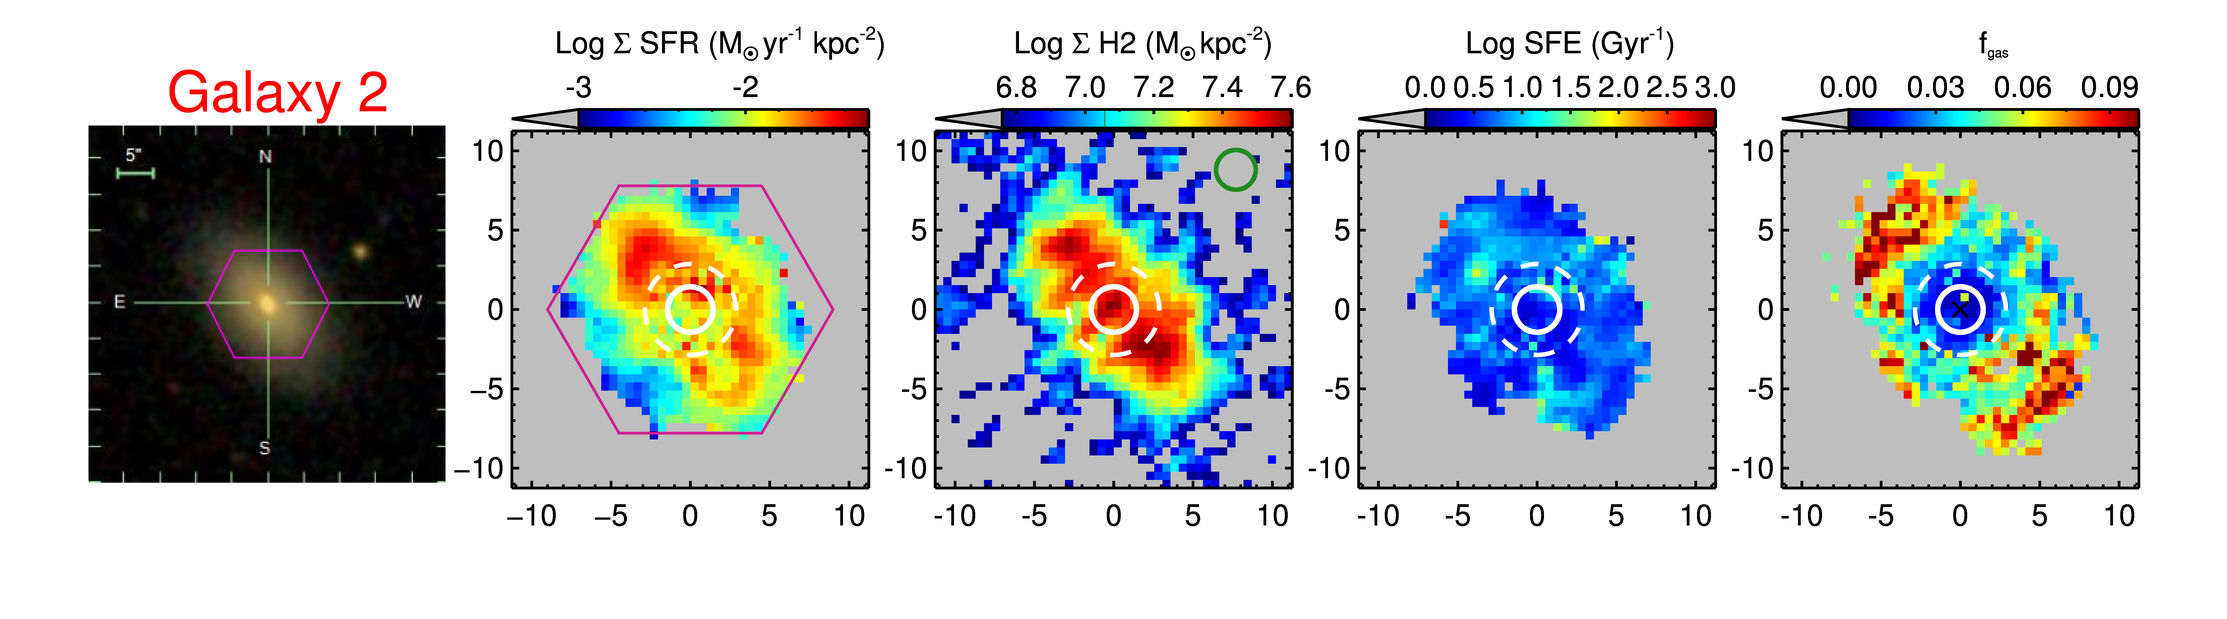
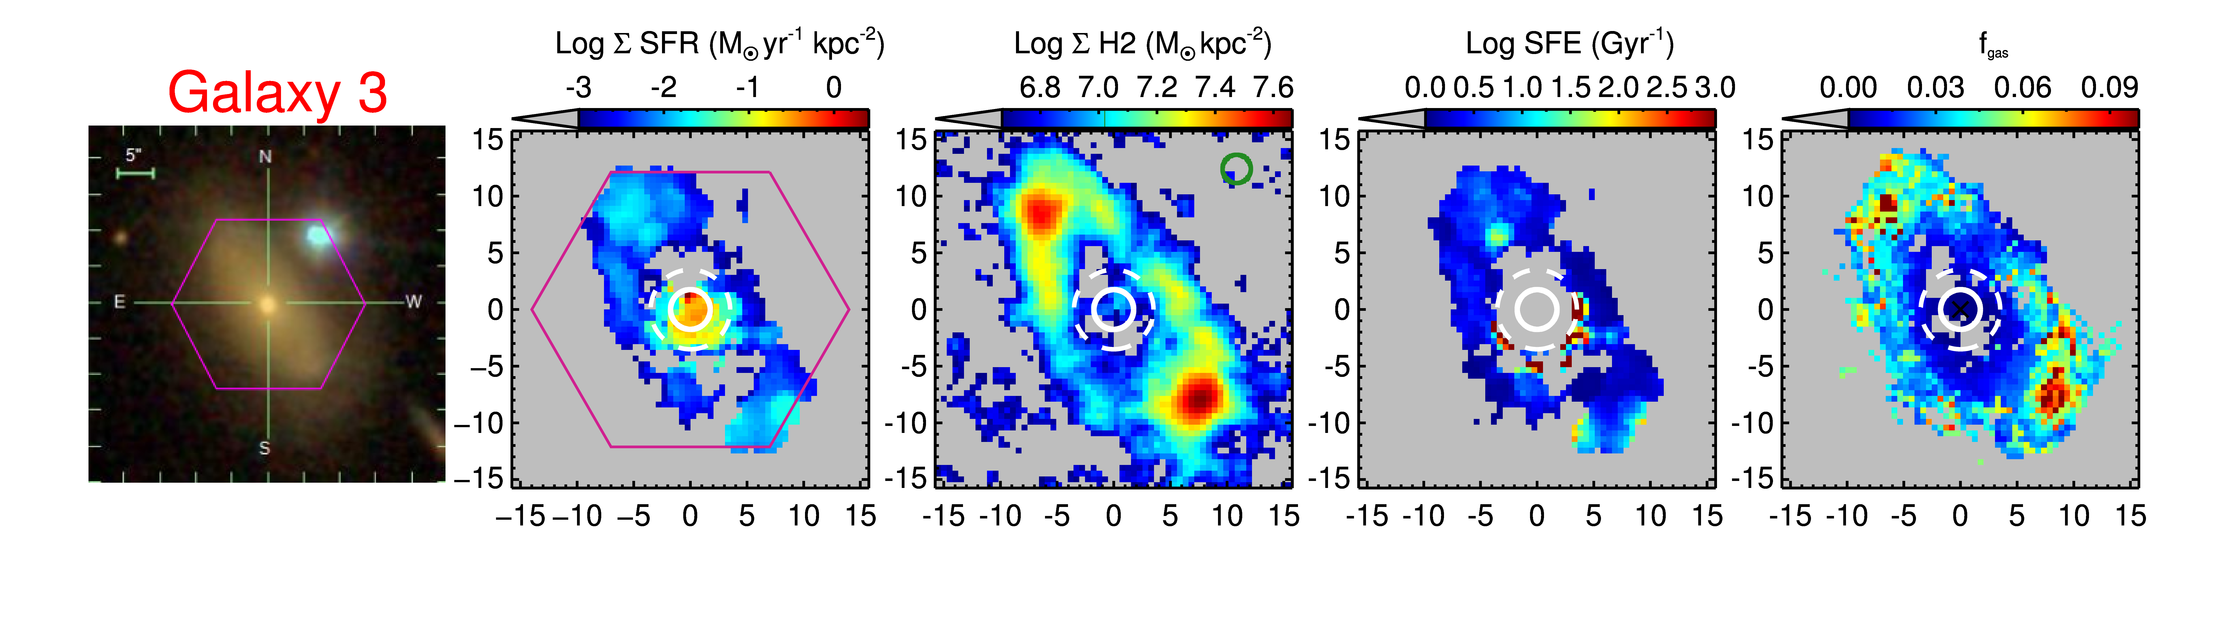
To separate the bulge and disk regions in our data, we perform the two-component fitting using GALFIT Peng et al. (2002, 2010) in the SDSS band images. For the bulge and disk components, we fix the Sersic index to be and , respectively, when fitting other parameters. The effective radii () are determined to be 2.77″, 0.7″, and 1.23″for Galaxies 1, 2, and 3, respectively. Once we obtain of the bulge, we compute the observed effective radius () by convolving it with the PSF size of both MaNGA and ALMA beams ( 2.5”). We define the ”bulge” region to be , and in order to mitigate contamination from any overlap region we define the ”disk” region to be 2. These regions are indicated by white circles in Figure 2.
3.1. Resolved vs. relation
Recently, it has been found that kpc-scale traces well with the underlying for star-forming galaxies (Sánchez et al., 2013; Cano-Díaz et al., 2016; Hsieh et al., 2017). This relation may be responsible for the observed tight correlation between the global SFR and . In the right panel of Figure 1, we show the kpc-scale vs. relation for the 3 green valley galaxies. The data points from the bulge and disk regions are shown in solid circles and contours, respectively. The dotted line represents the best-fit of the resolved main sequence relation obtained for the MaNGA star-forming population (Hsieh et al., 2017): log() = 10.33 + log(. For Galaxy 1, the disk almost lies on the resolved main sequence while the bulge is only slightly below the line. On the other hand, the bulge of Galaxy 2 shows significant departure from the resolved main sequence. We note that the central H emission of Galaxy 3 is dominated by a broad emission lines associated with an AGN, and therefore the from H is an upper limit in the central part of this galaxy. In spite of this, it is clear that both the bulge and disk regions of Galaxy 3 are systematically below the resolved main-sequence relation. There is also a trend that the disk sSFR declines from Galaxy 1 to Galaxy 3, following a similar behavior of the global sSFR. Assuming galaxies evolve with declining sSFR, our results would indicate that the sSFR in bulge departs from the resolved main sequence first, followed by the disk as the global sSFR decreases 111It is not necessarily true that these three galaxies form an evolutionary sequence, in particular because Galaxy 2 is less massive than the other two. In addition, the sSFR of galaxies may not monotonically declines with time as the SFR can be re-ignited by various processes during the life time of galaxies..
3.2. Gas fraction, star formation efficieny, and specific star formation rate
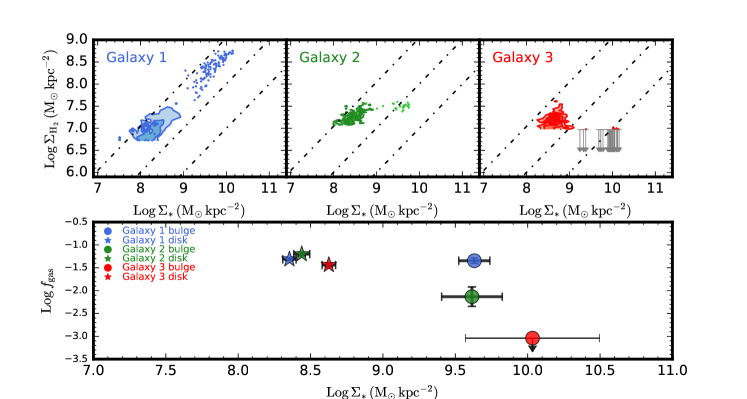
Figure 2 shows the optical image, , , star formation efficiency (SFE; defined as SFR/), and the gas fraction (; defined as /(+)) for the three green valley galaxies. We can see that the spatial distributions of these quantities are diverse among the three galaxies. For example, both and peak in the central part of Galaxy 1, whereas is more evenly distributed in Galaxy 2 and greater in the outskirts in Galaxy 3. Interestingly, all 3 galaxies show increasing with radius. We note that MaNGA achieves nearly uniform sensitivity across its IFU bundles, which is sufficient to detect the continuum at high S/N in the outskirts of these objects. The observed increases in gas fraction is, therefore, not driven by low S/N in the outskirts of galaxies. To quantify these differences, we next compare the relations among various quantities. The upper panels of Figure 3 shows the versus relation. For Galaxy 1, scales with for both bulge and disk regions. On the other hand, for Galaxies 2 and 3, is quite uniform across the bulges, despite the fact that the correlates with in disks. The lower panel shows the median gas fraction as a function of in bulges (circles) and disks (stars). The gas fraction in the bulges varies significantly among the 3 galaxies by 1.6 dex, being lower toward the Galaxy 3. On the other hand, the gas fractions in disks are comparable in the three cases, although slightly lower in Galaxy 3. Except for Galaxy 1, in the bulges is significantly lower than in the disks for the other two galaxies.
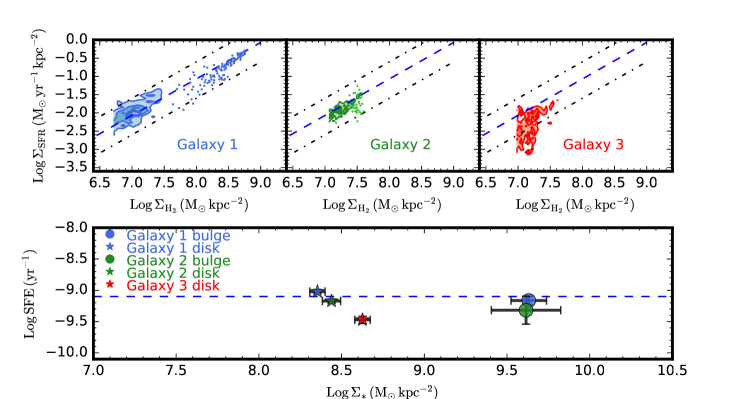
Next, we explore the relation between the SFR surface density and the gas surface density, the so-called ‘Kennicutt-Schmidt’ relation (Kennicutt, 1998), shown in the upper panels of Figure 4. Only spaxels with S/N (CO) ¿ 2 are displayed. The SFE versus is shown in the lower panel222Here we only consider the molecular gas, not the HI gas mass. Except for the Galaxy 3 whose central H emission is contaminated by the Broad Line Region associated with the AGN, the SFEs of other two bulges are at a similar level and are moderately lower compared to their corresponding disks. Similarly, the disk regions show a wider spread in the resolved SFE. Even though the SFEs are similar in some regions among the three galaxies, their median values systematically decline from Galaxies 1 to 3 by a factor of 3. Since two of our targets also have single-dish CO observations, we can compare the resolved SFE with the global SFE measurements as listed in Table 1. The global SFE is in good agreement with the resolved SFE for Galaxy 1. On the other hand, the global SFE is close to the lower end of the resolved SFE distribution for Galaxy 2. We note that the later is caused by the factor of 1.9 excess in the total CO (1-0) flux estimated by the COLD GASS single dish measurement compared to the integrated ALMA flux (see Sec.2.2).
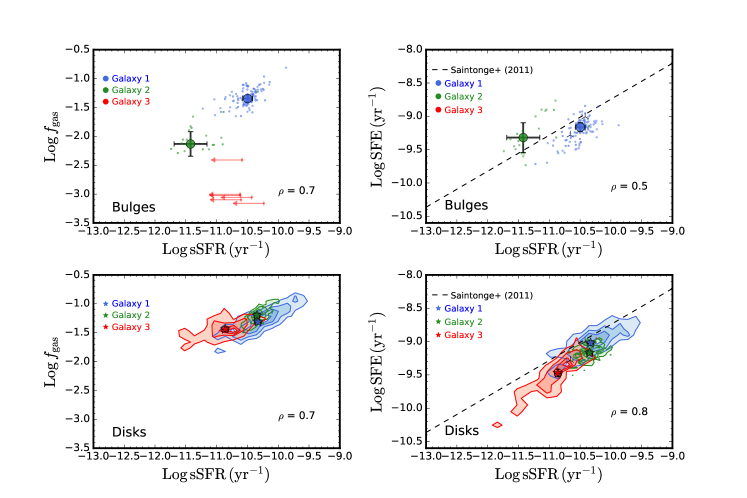
To address the relative importance in controlling the sSFR between gas fraction and SFE, we plot and SFE against sSFR and compute the Spearman’s correlation coefficient as shown in Figure 5. The data points associated with the bulge regions in Galaxy 3 are excluded in this analysis given that we cannot measure the SFR directly due to the AGN contamination. For bulges, the relation between an sSFR is stronger than that between SFE and sSFR as indicated by the values, suggesting that the sSFR of bulges is mainly controlled by . On the other hand, it is observed that both local and SFE correlate with local sSFR in disks, and the local relations are common among the 3 disks. For comparison, we also plot the global SFE vs. sSFR relations of the COLD GASS sample for galaxies with secure CO detections (Saintonge et al., 2011) in Figure 5 after correcting for the differences in the adopted IMF and . Our data points in the disk regions are systematically below the best-fit lines of the COLD GASS sample. This discrepancy may come from the fact that these two samples are averaged over different physical scales. The spatially resolved observations tend to sample CO bright regions, resulting in lower SFE than the global averages. An alternative explanation is that green valley galaxies may form a different correlation from the main sequence. Observations covering a wider range of galaxy populations are needed to conclude whether the observed SFE vs. sSFR relation is universal.
4. Discussion
The above analyses suggest that in bulges declines dramatically from Galaxy 1 to Galaxy 3, while keeping a similar level of SFE compared to the disks. On the other hand, there is a significant decrease in the disk SFE when the global sSFR of galaxies drops. To first order, the sSFR SFE. If we assume that green valley galaxies evolve with a declining global sSFR, a plausible scenario is that the bulge first quenched due to the reduction on the cold gas available, followed by a subsequent quenching in the disk because of the decrease in both the SFE and . This is consistent with the inside-out quenching scenario in which the star formation is ceases in bulges first.
The physical cause of the inside-out quenching, however, remains unanswered. Using the sample drawn from the HERA CO-Line Extragalactic Survey (HERACLES; Leroy et al. 2008), Huang & Kauffmann (2015) found that the gas depletion time is shorter for the bulge than for the disk. Although the galaxies used in their works is part of an HI-selected sample, which is mainly composed of normal star-forming galaxies on the main sequence, their result indicates that the greater SFE of the bulge may be responsible in reducing the amount of cold gas for the bulge, leading to the quenching of star formation if there is no further gas supply for the bulge. The observation of our three green valley galaxies does not seem to share the same trend, in particular that the bulge SFEs of green valley galaxies are similar or even lower than what is observed in their disks, similar to the findings by (Fisher et al., 2013) based on a combined sample of the BIMA SONG (Helfer et al., 2003) , CARMA STING (Rahman et al., 2012), and PdBI NUGA (García-Burillo et al., 2003) surveys. Our Galaxy 1, which is closest to the main sequence, shows comparable SFE and between its bulge and disk, suggesting that star formation alone cannot explain the faster reduction of the cold molecular gas in the bulges; some other processes are required to efficiently reduce or remove the cold molecular gas in the central parts of galaxies when galaxies migrate to the quiescent population.
One of the commonly accepted pictures refers to the so-called AGN feedback which heats up or expels the surrounding gases, preventing galaxies from subsequent star formation, particularly for massive galaxies. This scenario is supported by the observation of low gas fraction in AGN host galaxies (e.g., Brusa et al., 2015; Kakkad et al., 2017), as well as the AGN-driven molecular gas outflow (Cicone et al., 2014; Feruglio et al., 2015). In addition, it has been reported that AGN hosts preferentially lie in the green valley or below the main sequence (Nandra et al., 2007; Silverman et al., 2008; Salim et al., 2007; Ellison et al., 2016; Smith et al., 2016), suggesting that AGN could drive the transition from the star-forming to the quiescent phases. Recently, a spatially-resolved star formation rate study using MaNGA galaxies also finds that the resolved sSFR of unbarred AGN hosts is below the resolved main-sequence (L. Bing et al. in prep.) across the entire galaxies, similar to the three cases presented in this work. As noted earlier, one of our three green valley galaxies, Galaxy 3, shows broad-line features and hence potentially hosts an AGN. It is consistent with the AGN feedback framework that the presence of AGN diminishes the available cold gas in the bulge and even in the disks. On the other hand, although the morphological quenching (Martig et al., 2009) also predicts low SFE in the disks that are stabilized against gas fragmentation due to the presence of massive bulges, it may not be relevant to the three systems discussed in this work since morphological quenching is only effective in bulge dominated systems, unlike our green valley galaxies.
5. CONCLUSIONS
We have observed three MaNGA-selected green valley galaxies with ALMA CO (1-0) to study the role of gas in star formation quenching. The three galaxies are referred to as Galaxies 1, 2, and 3 according to their separation from the main sequence on the global sSFR and relation (1: closest; 3: farthest). Specifically, we study the relations among sSFR, SFE, and on kpc scales. Our results can be summarized below:
1. The resolved MaNGA data show that the disk sSFR declines with the decreasing global sSFR. There is an indication that the bulge departs from the resolved main sequence first, followed by the disk as the global sSFR declines.
2. For Galaxies 2 and 3, which are clearly below the star-forming main sequence, the gas fraction in the bulges is lower compared to that in the disks. The gas fraction in the bulges drops by 1.6 dex from Galaxy 1 to Galaxy 3.
3. The SFE in the bulge is moderately lower than that in the disk for Galaxy 1 and Galaxy 2. In addition, the SFE of disks decreases from Galaxy 1 to Galaxy 3.
4. The resolved sSFR is found to correlate with both and SFE. However, the sSFR of bulges have stronger dependence on . On the other hand, the resolved sSFR in disks are sensitive to both and SFE.
Our results suggest that the is the dominant factor determining the sSFR of bulges, while the sSFR of disks declines because of the drop in both SFE and when the global sSFR declines. Assuming the three galaxies represent a sequence of transitional stages, our results would favour an inside-out quenching – the SF is ceased in the bulge first because of the lack of available cold gas, followed by the quenching in the disk due to subsequent decline in SFE as well as in . Our results fit into the AGN feedback scenario in which the AGN activity may heat up or eject the cold gas out, resulting a reduction of available cold gas to fuel the star formation in the bulges (and possible in the disks), although it remains unclear what drives the declination of SFE in the disks when galaxies move away from the main sequence. However, such a evolution sequence may be oversimplified as it has been shown that green valley galaxies can have diversity in terms of their quenching time scales, suggesting different pathways of star formation quenching (Schawinski et al., 2014; Smethurst et al., 2015). Moreover, galaxies may be rejuvenated if there is fresh gas accreted when experiencing minor mergers or galaxy interactions (Thomas et al., 2010; Haines et al., 2015; Lacerna et al., 2016) and hence may not evolve monotonically with a decreasing global sSFR. Detailed stellar population analyses regarding the star formation and stellar mass assembling histories (e.g., Ibarra-Medel et al., 2016) together with resolved gas observations for a larger sample of green valley galaxies is required to confirm the picture presented in this work.
References
- Albareti et al. (2017) Albareti, F. D., Allende Prieto, C., et al. 2017, ApJS accepted, (arXiv:1608.02013)
- Baldry et al. (2004) Baldry, I. K., Glazebrook, K., Brinkmann, J., et al. 2004, ApJ, 600, 681
- Balogh et al. (2000) Balogh, M. L., Navarro, J. F., & Morris, S. L. 2000, ApJ, 540, 113
- Belfiore et al. (2017) Belfiore, F., Maiolino, R., Tremonti, C., et al. 2017, accepted by MNRAS (arXiv:1703.03813)
- Belfiore et al. (2016) Belfiore, F., Maiolino, R., Maraston, C., et al. 2016, MNRAS, 461, 3111
- Bell et al. (2004) Bell, E. F., Wolf, C., Meisenheimer, K., et al. 2004, ApJ, 608, 752
- Blanton et al. (2003) Blanton, M. R., Hogg, D. W., Bahcall, N. A., et al. 2003, ApJ, 594, 186
- Blanton et al. (2017) Blanton, M. R., Bershady, M. A., Abolfathi, B., et al. 2017, AJsubmitted (arXiv:1703.00052)
- Bolatto et al. (2013) Bolatto, A. D., Wolfire, M., & Leroy, A. K. 2013, ARA&A, 51, 207
- Brinchmann et al. (2004) Brinchmann, J., Charlot, S., White, S. D. M., et al. 2004, MNRAS, 351, 1151
- Brusa et al. (2015) Brusa, M., Feruglio, C., Cresci, G., et al. 2015, A&A, 578, A11
- Bundy et al. (2015) Bundy, K., Bershady, M. A., Law, D. R., et al. 2015, ApJ, 798, 7
- Cano-Díaz et al. (2016) Cano-Díaz, M., Sánchez, S. F., Zibetti, S., et al. 2016, ApJ, 821, L26
- Cicone et al. (2014) Cicone, C., Maiolino, R., Sturm, E., et al. 2014, A&A, 562, A21
- Cid Fernandes et al. (2013) Cid Fernandes, R., Pérez, E., García Benito, R., et al. 2013, A&A, 557, A86
- Drory et al. (2015) Drory, N., MacDonald, N., Bershady, M. A., et al. 2015, AJ, 149, 77
- Elbaz et al. (2011) Elbaz, D., Dickinson, M., Hwang, H. S., et al. 2011, A&A, 533, A119
- Ellison et al. (2016) Ellison, S. L., Teimoorinia, H., Rosario, D. J., & Mendel, J. T. 2016, MNRAS, 458, L34
- Faber et al. (2007) Faber, S. M., Willmer, C. N. A., Wolf, C., et al. 2007, ApJ, 665, 265
- Falcón-Barroso et al. (2011) Falcón-Barroso, J., Sánchez-Blázquez, P., Vazdekis, A., et al. 2011, A&A, 532, A95
- Feruglio et al. (2015) Feruglio, C., Fiore, F., Carniani, S., et al. 2015, A&A, 583, A99
- Fischera & Dopita (2005) Fischera, J., & Dopita, M. 2005, ApJ, 619, 340
- Fisher et al. (2013) Fisher, D. B., Bolatto, A., Drory, N., et al. 2013, ApJ, 764, 174
- García-Burillo et al. (2003) García-Burillo, S., Combes, F., Eckart, A., et al. 2003, Active Galactic Nuclei: From Central Engine to Host Galaxy, 290, 423
- Goddard et al. (2017) Goddard, D., Thomas, D., Maraston, C., et al. 2017, MNRAS, in press, arXiv: 1612.01546
- González Delgado et al. (2014) González Delgado, R. M., Pérez, E., Cid Fernandes, R., et al. 2014, A&A, 562, A47
- Gunn & Gott (1972) Gunn, J. E., & Gott, J. R. I. 1972, ApJ, 176, 1
- Gunn et al. (2006) Gunn, J. E., Siegmund, W. A., Mannery, E. J., et al. 2006, AJ, 131, 2332
- Haines et al. (2015) Haines, T., McIntosh, D. H., Sánchez, S. F., Tremonti, C., & Rudnick, G. 2015, MNRAS, 451, 433
- Helfer et al. (2003) Helfer, T. T., Thornley, M. D., Regan, M. W., et al. 2003, ApJS, 145, 259
- Hsieh et al. (2017) Hsieh, B.-C. et al. 2017, in prep.
- Huang et al. (2012) Huang, S., Haynes, M. P., Giovanelli, R., & Brinchmann, J. 2012, ApJ, 756, 113
- Huang & Kauffmann (2015) Huang, M.-L., & Kauffmann, G. 2015, MNRAS, 450, 1375
- Ibarra-Medel et al. (2016) Ibarra-Medel, H. J., Sánchez, S. F., Avila-Reese, V., et al. 2016, MNRAS, 463, 2799
- Kakkad et al. (2017) Kakkad, D., Mainieri, V., Brusa, M., et al. 2017, MNRAS, 468, 4205
- Kauffmann et al. (2003) Kauffmann, G., Heckman, T. M., White, S. D. M., et al. 2003, MNRAS, 341, 33
- Kennicutt (1998) Kennicutt, R. C., Jr. 1998a, ARA&A, 36, 189
- Kennicutt (1998) Kennicutt, R. C., Jr. 1998, ApJ, 498, 54
- Lacerna et al. (2016) Lacerna, I., Hernández-Toledo, H. M., Avila-Reese, V., Abonza-Sane, J., & del Olmo, A. 2016, A&A, 588, A79
- Larson et al. (1980) Larson, R. B., Tinsley, B. M., & Caldwell, C. N. 1980, ApJ, 237, 692
- Law et al. (2015) Law, D. R., Yan, R., Bershady, M. A., et al. 2015, AJ, 150, 19
- Law et al. (2016) Law, D. R., Cherinka, B., Yan, R., et al. 2016, AJ, 152, 83
- Leroy et al. (2008) Leroy, A. K., Walter, F., Brinks, E., et al. 2008, AJ, 136, 2782
- Li et al. (2015) Li, C., Wang, E., Lin, L., et al. 2015, ApJ, 804, 125
- Martig et al. (2009) Martig, M., Bournaud, F., Teyssier, R., & Dekel, A. 2009, ApJ, 707, 250
- Martin et al. (2007) Martin, D. C., Wyder, T. K., Schiminovich, D., et al. 2007, ApJS, 173, 342
- Martins et al. (2005) Martins, L. P., González Delgado, R. M., Leitherer, C., Cerviño, M., & Hauschildt, P. 2005, MNRAS, 358, 49
- Mihos & Hernquist (1994) Mihos, J. C., & Hernquist, L. 1994, ApJ, 431, L9
- Moore et al. (1996) Moore, B., Katz, N., Lake, G., Dressler, A., & Oemler, A, 2006, Nature, 379, 613
- Mo et al. (1998) Mo, H. J., Mao, S., & White, S. D. M. 1998, MNRAS, 295, 319
- Nandra et al. (2007) Nandra, K., Georgakakis, A., Willmer, C. N. A., et al. 2007, ApJ, 660, L11
- Osterbrock & Ferland (2006) Osterbrock, D.E., & Ferland, G. J. 2006, Astrophysics of gaseous nebulae and active galactic nuclei, 2nd. ed. by D.E. Osterbrock and G.J. Ferland. Sausalito, CA: University Science Books, 2006
- Calzetti (2001) Calzetti, D. 2001, PASP, 113, 1449
- Peng et al. (2002) Peng, C. Y., Ho, L. C., Impey, C. D., & Rix, H. W. 2002, AJ, 124, 266
- Peng et al. (2010) Peng, C. Y., Ho, L. C., Impey, C. D., & Rix, H.-W. 2010, AJ, 139, 2097
- Peng et al. (2015) Peng, Y., Maiolino, R., & Cochrane, R. 2015, Nature, 521, 192
- Rahman et al. (2012) Rahman, N., Bolatto, A. D., Xue, R., et al. 2012, ApJ, 745, 183
- Saintonge et al. (2011) Saintonge, A., Kauffmann, G., Wang, J., et al. 2011, MNRAS, 415, 61
- Saintonge et al. (2012) Saintonge, A., Tacconi, L. J., Fabello, S., et al. 2012, ApJ, 758, 73
- Salim et al. (2007) Salim, S., Rich, R. M., Charlot, S., et al. 2007, ApJS, 173, 267
- Salim (2014) Salim, S. 2014, Serbian Astronomical Journal, 189, 1
- Sánchez-Blázquez et al. (2006) Sánchez-Blázquez, P., Peletier, R. F., Jiménez-Vicente, J., et al. 2006, MNRAS, 371, 703
- Sánchez et al. (2013) Sánchez, S. F., Rosales-Ortega, F. F., Jungwiert, B., et al. 2013, A&A, 554, A58
- Sánchez et al. (2016a) Sánchez, S. F., Pérez, E., Sánchez-Blázquez, P., et al. 2016a, RMxAA, 52, 21
- Sánchez et al. (2016b) Sánchez, S. F., Pérez, E., Sánchez-Blázquez, P., et al. 2016b, RMxAA, 52, 171
- Sánchez-Blázquez et al. (2014) Sánchez-Blázquez, P., Rosales-Ortega, F. F., Méndez-Abreu, J., et al. 2014, A&A, 570, A6
- Schawinski et al. (2014) Schawinski, K., Urry, C. M., Simmons, B. D., et al. 2014, MNRAS, 440, 889
- Schmidt (1959) Schmidt, M. 1959, ApJ, 129, 243
- Silverman et al. (2008) Silverman, J. D., Mainieri, V., Lehmer, B. D., et al. 2008, ApJ, 675, 1025-1040
- Simard et al. (2011) Simard, L., Mendel, J. T., Patton, D. R., Ellison, S. L., & McConnachie, A. W. 2011, ApJS, 196, 11
- Smee et al. (2013) Smee, S. A., Gunn, J. E., Uomoto, A., et al. 2013, AJ, 146, 32
- Smethurst et al. (2015) Smethurst, R. J., Lintott, C. J., Simmons, B. D., et al. 2015, MNRAS, 450, 435
- Smith et al. (2016) Smith, K. L., Mushotzky, R. F., Vogel, S., Shimizu, T. T., & Miller, N. 2016, ApJ, 832, 163
- Speagle et al. (2014) Speagle, J. S., Steinhardt, C. L., Capak, P. L., & Silverman, J. D. 2014, ApJS, 214, 15
- Thomas et al. (2010) Thomas, D., Maraston, C., Schawinski, K., Sarzi, M., & Silk, J. 2010, MNRAS, 404, 1775
- Vazdekis et al. (2010) Vazdekis, A., Sánchez-Blázquez, P., Falcón-Barroso, J., et al. 2010, MNRAS, 404, 1639
- White & Frenk (1991) White, S. D. M., & Frenk, C. S. 1991, ApJ, 379, 52
- Yan et al. (2016a) Yan, R., Tremonti, C., Bershady, M. A., et al. 2016, AJ, 151, 8
- Yan et al. (2016b) Yan, R., Bundy, K., Law, D. R., et al. 2016, AJ, 152, 197