HST/COS Far Ultraviolet Spectroscopic Analysis of U Geminorum Following a Wide Outburst 111Based on observations made with the NASA/ESA Hubble Space Telescope, obtained at the Space Telescope Science Institute, which is operated by AURA, Inc., under NASA contract NAS 5-26555.
Abstract
We have used the Cosmic Origins Spectrograph (COS) on the Hubble Space Telescope (HST) to obtain a series of 4 far ultraviolet (FUV, 915-2148 Å) spectroscopic observations of the prototypical dwarf nova U Geminorum during its cooling following a two-week outburst. Our FUV spectral analysis of the data indicates that the white dwarf (WD) cools from a temperature of K, 15 days after the peak of the outburst, to K, 56 days after the peak of the outburst, assuming a massive WD () and a distance of pc. These results are self-consistent with a WD with a km radius. The spectra show absorption lines of H i, He ii, C ii iii iv, N iii iv, O vi, S iv, Si ii iii iv, Al iii, Ar iii, and Fe ii, but no emission features. We find supra-solar abundances of nitrogen confirming the anomalous high N/C ratio. The FUV lightcurve reveals a 5% modulation with the orbital phase, showing dips near phase 0.25 and 0.75, where the spectra exhibit an increase in the depth of some absorption lines and in particular strong absorption lines from Si ii, Al iii, and Ar iii. The phase dependence we observe is consistent with material overflowing the disk rim at the hot spot, reaching a maximum elevation near phase 0.75, falling back at smaller radii near phase 0.5 where it bounces off the disk surface and again rising above the disk near phase 0.25. There is a large scatter in the absorption lines’ velocities, especially for the silicon lines, while the carbon lines seem to match more closely the orbital velocity of the WD. This indicates that many absorption lines are affected by- or form in- the overflowing stream material veiling the WD, making the analysis of the WD spectra more difficult.
ArXiv/Astroph Version \setwatermarkfontsize1.0in
1 Introduction: U Gem - The Prototypical Dwarf Nova
Cataclysmic Variables (CVs) are semi-detached interacting binaries in which a white dwarf (WD) accretes matter from a Roche lobe-filling late type companion. When the WD has a weak or negligible magnetic field, the matter is accreted by means of a disk in which it dissipates its gravitational potential energy. The most common class of CVs are the dwarf novae (DNe), found mostly in a state of low accretion, when the disk is dim and the WD dominates in the ultraviolet (UV) band. Every few weeks to months, DNe undergo semi-regular outbursts (lasting days to weeks) in which the system brightens by 3-5 visual magnitudes, as the mass transfer rate increases due to a thermal instability in the disk. During outbursts, the accretion disk totally dominates the systems in the UV and optical bands.
In December 1855 the dwarf novae U Gem became the first CV to be discovered (Hind, 1856), and as such it also became the prototypical “UG” sub-type of dwarf novae (i.e. DNe with period hrs). For that reason, it has been extensively studied, observed numerous time in the X-ray (e.g. Mason et al., 1988; Szkody et al., 1996), extreme ultraviolet (e.g. Long et al., 1996), ultraviolet (e.g. Long et al., 1993), optical (e.g. Zhang and Robinson, 1987; Unda-Sanzana et al., 2006; Echevarría et al., 2007), and infrared (e.g. Panek & Eaton, 1982), and it has even been modeled using three-dimensional hydrodynamics (e.g. Kunze et al., 2001) as well as within the context of the restricted three-body problem (e.g. Smak, 2001). Consequently, we restrict ourselves here below to summarizing only the characteristics of the system that are directly relevant to the present work with a limited number of references (as the complete list is extensive).
| Parameter | U Gem | References |
|---|---|---|
| 1.1-1.2 | Sion et al. (1998); Long & Gilliland (1999) | |
| 0.41-0.42 | Long & Gilliland (1999); Smak (2001); Echevarría et al. (2007) | |
| 0.35-0.362 | Long & Gilliland (1999); Smak (2001); Echevarría et al. (2007) | |
| deg | 67-72 | Zhang and Robinson (1987); Long & Gilliland (1999); Unda-Sanzana et al. (2006) |
| hr | 4.24574858 | Marsh et al. (1990); Echevarría et al. (2007); Dai & Qian (2009) |
| 8.2-13.9 | Szkody and Mattei (1984); Ritter & Kolb (2003) | |
| E(B-V) | Verbunt (1987); la Dous (1991); Bruch & Engel (1994) | |
| pc | Harrison et al. (2004) |
U Gem has a period of 0.1769061911 day ( hr 15 min, Marsh et al., 1990; Echevarría et al., 2007; Dai & Qian, 2009)), and a mass ratio (Long & Gilliland, 1999; Echevarría et al., 2007) with a WD mass (Sion et al., 1998; Long & Gilliland, 1999). It has distance of pc, that has been determined astrometrically by Harrison et al. (2004), based on a re-analysis of the Hubble Space Telescope Fine Guidance sensor parallaxes. The system is a partially eclipsing binary (Kraft, 1962; Krzeminski, 1965) in which the disk undergoes partial eclipses (around phase ) by the donor, the hot spot undergoes full eclipses (just after phase 0.0) by the donor, while the WD is never eclipsed (Smak, 1971; Warner and Nather, 1971; Marsh et al., 1990; Echevarría et al., 2007). For this to happen with a mass ratio , the inclination has to be in the range (Long & Gilliland, 1999; Long et al., 2006), and the value derived in the litterature is between and (Long & Gilliland, 1999; Long et al., 2006; Smak, 2001; Unda-Sanzana et al., 2006), confirming the early estimate by Zhang and Robinson (1987) of . The system parameters are listed in Table 1 together with their references.
U Gem goes into outburst every 118 days, brightening from to for an average outburst time of days (Szkody and Mattei, 1984; Ritter & Kolb, 2003). However, the system actually exhibits two kinds of outbursts: narrow outbursts lasting about a week ( days), and wide outbursts lasting about two weeks ( days, Sion et al., 1998). Ultraviolet spectroscopic observations obtained during a wide outburst are consistent with a steady state disk with a mass accretion rate ranging from /yr (Sion et al., 1997) to /yr (Panek & Holm, 1984; Froning et al., 2001). During the decline from outburst the mass accretion rates decreases (/yr, see Sion et al., 1997), and eventually the metal-enriched hot WD dominates the spectrum. A second component appears on the WD, possibly an optically thick hot boundary layer or an “accretion belt” (Long et al., 1993), improving the model fit in the shorter wavelengths of Far Ultraviolet Spectroscopic Explorer (FUSE) spectra of U Gem (Å , Froning et al., 2001).
In quiescence, shortly after outburst, the WD has a temperature still above 40,000 K (Long et al., 2006), and cools to K within several months (Kiplinger et al., 1991; Long et al., 1994, 1995). The length of the quiescence dictates the post-outburst temperature reached, which has occasionally been observed to be anomalously low (Sion et al., 1998) following a very long quiescence period. The exact WD temperature derived from the data depends also on the WD effective surface gravity assumed in the modeling.
Nonsolar metal abundances attributed to the WD photosphere have been found in the studies of U Gem (Sion et al., 1998; Long & Gilliland, 1999; Froning et al., 2001), revealing evidence of CNO processing, namely sub-solar carbon and silicon abundances and supra-solar nitrogen abundance. Sub-solar aluminum has also been recorded (Long & Gilliland, 1999). However, phase-dependent absorption has been shown to be responsible for the time-variable absorption seen in the FUV, which complicates the analysis of the WD spectra (Long et al., 2006).
While U Gem was observed previously with HST in the UV band with the HST/Goddard High-Resolution Spectrograph (GHRS, Sion et al., 1998; Long & Gilliland, 1999), we obtained HST/COS FUV observations of U Gem extending down the Lyman limit (915-2148 Å). The only previous observations covering the Lyman region were made with the Hopkins Ultraviolet Telescope (HUT) (Long et al., 1993) and FUSE (Froning et al., 2001; Long et al., 2006).
We present here the FUV spectral analysis of 4 HST COS spectra obtained following a two-week outburst. The data obtained at the first epoch were purposedly collected to span a complete binary orbit ( hours), while the data obtained at the remaining three epochs were each collected for only a quarter of an orbit. In this manner we were able to analyze the data to detect any variation as a function of the orbital phase as well as a function of the time passed since outburst. In the next section we describe the observations and data, in section 3 we present and discuss the results from our spectral analysis, we then conclude in section 4 with a summary.
2 The HST/COS Spectra
2.1 Observations
U Gem went into an outburst on November 29, 2013, for about 15 days, increasing its brightness from to . The outburst, shown in Fig.1, was fairly normal for a “wide” outburst, however, it followed a quiescence period of only 69 days (the previous outburst was a short 7-day outburst that started on September 14). The HST/COS observations of U Gem were taken on December 20 & 26, 2012, and on January 7 & 30, 2013, following the wide November outburst.
| Epoch | DATAID | Obs. date | Obs. time (UT) | Exp.time | days1 |
|---|---|---|---|---|---|
| Number | yyyy-mm-dd | hh:mm:ss | sec | ||
| 1 | LC1U01010 | 2012-12-20 | 11:54:12 | 5761.6 | 15 |
| 2 | LC1U02010 | 2012-12-26 | 04:59:28 | 960.0 | 21 |
| 3 | LC1U06010 | 2013-01-07 | 23:26:05 | 960.1 | 33 |
| 4 | LC1U04010 | 2013-01-30 | 22:03:00 | 960.1 | 56 |
Note. — Note: (1) In the sixth column we indicate the days counted since the peak of the outburst that started on November 29, 2012 and lasted 15 days.
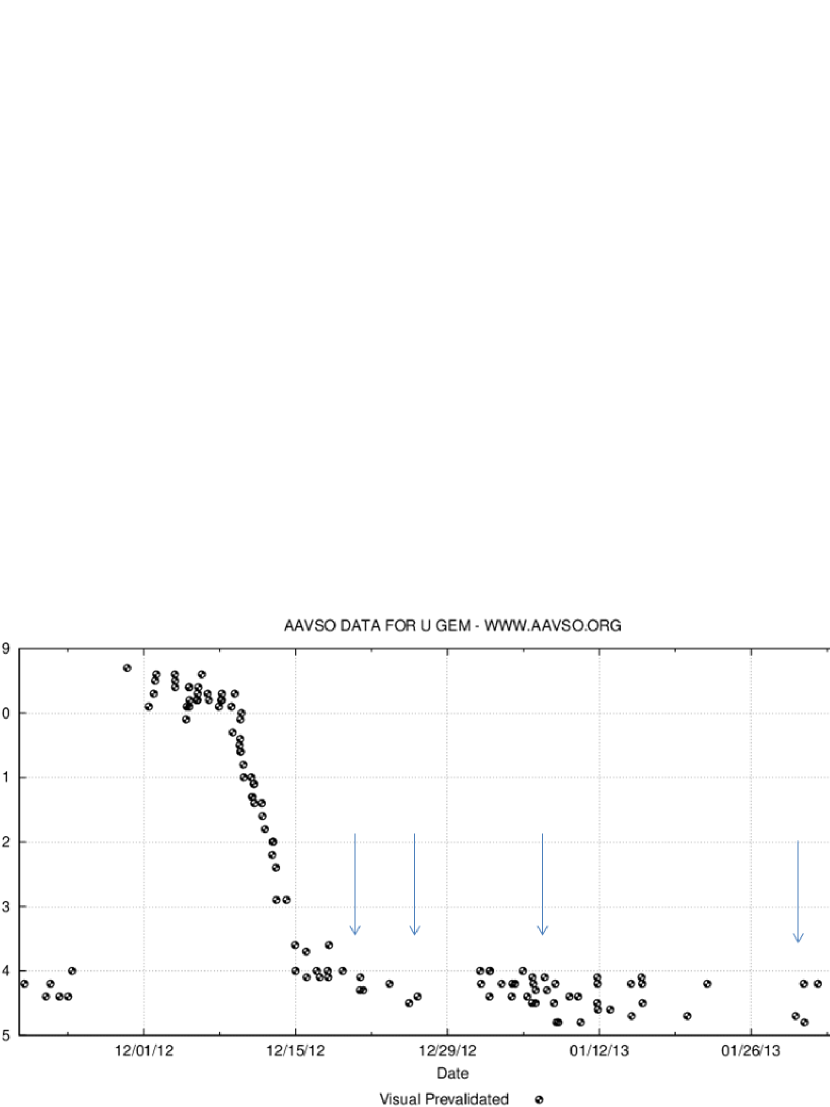
The time at which the observations were taken is marked on Fig.1 with vertical arrows pointing down. The observation log is given in Table 2.
COS was set up in the FUV configuration with the G140L grating centered at 1280 Å in time tag mode. The data were collected through the primary science aperture (PSA) of 2.5 arcsec diameter. This configuration produces two spectral segments covering 915-1193 Å and 1266-1248 Å, with a gap between 1193 Å and 1266 Å. While the resulting spectrum covers the Lyman series down to its cut-off, it does not cover the L region.
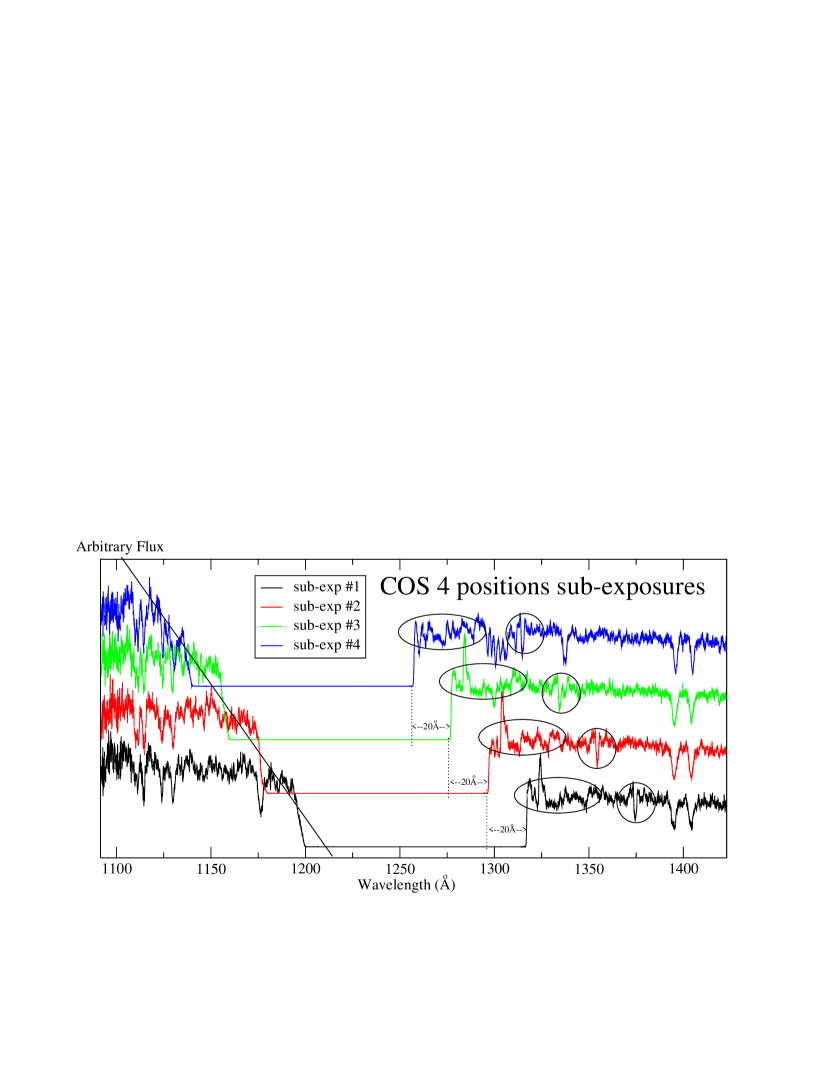
The data were processed with CALCOS version 3.1.8 through the pipeline which produces for each HST orbit 4 sub-exposures generated by shifting the position of the spectrum on the detector by 20 Å each time. This strategy is to reduce detector effects. It is left to the observer to compare the 4 sub-exposures and identify all the detector artifacts which appear on all sub-exposures but with a shift of 20 Å from sub-exposure to sub-exposure. The first epoch data are covering 3 HST orbits and consist of 12 sub-exposures, the remaining data obtained at epochs 2, 3 and 4 all consist of one HST orbit each, made of 4 sub-exposures each. The second sub-exposure of epoch #2 was lost due to the COS light path being blocked during that exposure. We therefore collected a total of 23 sub-exposures each consisting of two spectral segments with a gap in the L region. In the first sub-exposure of each exposure(/HST orbit), the gap spans the region Å, in the second sub-exposure Å, in the third sub-exposure Å, and in the fourth and last sub-exposure Å. The extracted spectra have a signal that deteriorates toward the edges of the spectrum (see Fig.2).
For the first orbit of epoch #1, and for the single orbit of epoch # 2, 3, and 4, the effective good exposure time of each sub-exposure is a little more than 200 sec. For the second and third orbits of epoch #1 the exposure time for each sub-exposure is sec. In Fig.4 we display the 23 spectra extracted from the sub-exposures in the Si iv doublet ( Å) region to show the quality of the spectra.
Due to the gap between the two segments of the detector and the 20 Å shift in the detector position for each of the 4 sub-exposures, and due to detector artifacts (especially near its edges), the spectra are not reliable beyond the C iii (1175) absorption lines, nor below 1300 Å. In Fig.4 we illustrate how the detector edges (and gain sag) affect some of the spectral regions, and we explain how we identify these artifacts that need to be discarded. For this reason the spectral lines analysis is carried out on the individual sub-exposures, which have a much lower S/N than the combined spectrum.
Because of the sub-exposure spectra having a different wavelength coverage, the C iii (1175) and N iii (1183) absorption lines are only present in 6 sub-exposures.
2.2 The FUV Absorption Lines


| Ion | (Å) |
|---|---|
| N iv | 921.46-924.91; 923.2 |
| C iii | 977.0 |
| N iii | 989.8, 991.56 |
| He ii | 992.4 |
| O vi | 1031.9 |
| O vi | 1037.6 |
| S iv | 1062.7 |
| Si iv | 1066.6 |
| S iv | 1073.0 |
| He ii | 1084.9 |
| N iii | 1085.5 |
| Si iii | 1108.4, 1109.9, 1113.2 |
| Si iv | 1122.5, 1128.3 |
| Si iii | 1140.6-1145.7; 1144.3 |
| C iii | 1174.6-1176.8; 1175.3 |
| N iii∗ | 1183.0 |
| N iii∗ | 1184.5-1185.6 |
| Si iii | 1294.4, 1296.7, 1298.9, 1301, 1303.2 |
| C ii | 1323.9-1324.0 |
| C ii∗ | 1334.5, 1335.7 |
| Si iii | 1341.5, 1342.4, 1343.4 |
| Si iv | 1392.8, 1402.8 |
| Si iii | 1417.2 |
| Si iii | 1500.2, 1501.2, 1501.9 |
| Si ii | 1526.7, 1533.4 |
| C iv | 1548.2, 1550.8 |
| He ii | 1640.3, 1640.5 |
| Ar iii | 1669.3, 1669.7 |
| Al iii | 1854.7, 1862.8 |
| Fe | 1450 - 1600 |
Note. — All the lines listed here have been marked in Figs.5 and 6. As described in the analysis section, many lines were identified by comparing them to low-metallicity synthetic stellar spectra while increasing the abundance of one species (metal) at a time. In this manner we identified the sawtooth pattern between Å and Å as a multitude of small iron absorption lines (Fe ii). Lines anotated with an asterisk (*) are contaminated with detector artifacts.
In this subsection we present the absorption lines detected in the COS spectrum of U Gem. While many lines can be easily identified, some other lines were identified during our spectral analysis and the procedure we follow for line identifications is described in the analysis section. We did not detect any emission features in the COS spectrum of U Gem.
During quiescence we expect the WD to dominate the FUV and, therefore, we expect the COS spectrum to exhibit absorption lines from a moderately hot (30,0000-40,000 K) WD, namely the hydrogen Lyman lines, helium Balmer lines, low ionization species lines, as well as possibly some higher ionization species lines. The individual sub-exposure spectra are very noisy, especially below 1000 Å, and we consequently first proceed by combining together the sub-exposures of the first epoch to clearly display the absorption lines and identify them below 1080 Å. For clarity the resulting epoch #1 spectrum is presented in two figures. The actual spectral analysis is carried out on the sub-exposures rather than on the combined spectrum.
In Fig.5 we display the short wavelength segment which has a similar spectral range to FUSE spectra. The hydrogen Ly absorption line is the main broad feature dominating the spectrum in the middle panel. The hydrogen Ly and Ly absorption features are also clearly apparent, but the higher orders of the series are not. The spectrum is marked by broad absorption features usually detected in the FUSE spectra of CV WDs (Godon et al., 2012) from carbon (C iii 977, 1175), nitrogen (N iii 990, 1085, 1184), silicon (Si iii 1110, 1144; Si iv 1167, 1122, 1128), and sulphur (S iv 1063, 1073). In addition, some higher ionization species absorption lines appearing only at higher temperature ( K) are also seen, N iv (923) and the O vi doublet (1032, 1038), an indication that a hot absorbing medium is in front of the WD. The S vi (933, 944) and P v (1118, 1128) absorption lines, previously seen in the FUSE spectra of U Gem in quiescence (Long et al., 2006), are not detected here in the spectrum. The line identifications process is explained in the analysis section where each spectrum (and its sub-exposures) are modeled with realistic photospheric WD models. We list the absorption lines in Table 3 where only the rest (laboratory) wavelength is listed for each line, since the exact position of the lines changes for each sub-exposure.
Not unsurprizingly the COS spectrum of U Gem does not show any interstellar absorption lines as it is a nearby system.
The long wavelength segment of the epoch # 1 spectrum is displayed in Fig.6, where, for clarity, the vertical scale has been stretched. The first striking feature of the long wavelength segment spectrum are the numerous absorption features seen at wavelengths below 1400 Å. An inspection of the sub-exposures reveals that most of the ‘lines’ are due to detector artifacts (gain sag in regions illuminated by airglow), as they are seen in each sub-exposure shifted by 20 Å. Below 1400 Å, we detect with confidence Si iii (1300) and C ii (1324) lines. The C ii (1335) is contaminated with a detector artifact. All the other features between 1265 Å and 1380 Å are detector artifacts. Fortunately, the longer wavelength region is not affected and we identify silicon lines (Si iv doublet 1400; Si iii 1342, 1417, 1500; Si ii 1527, 1533), the C iv (1550) line, the He ii (1640) line, as well as aluminum (Al iii 1855, 1863) and possibly argon (Ar iii 1670) lines. In the line analysis section we will show that the sawtooth pattern observed from Å to 1630 Å is likely due to iron (Fe ii).
3 Spectral Analysis Results and Discussion
We use Ivan Hubeny’s FORTRAN suite of codes TLUSTY and SYNSPEC (Hubeny, 1988; Hubeny & Lanz, 1995) to generate synthetic spectra for high-gravity stellar atmosphere models. We first generate a one-dimensional vertical stellar atmosphere structure with TLUSTY for a given surface gravity , effective surface temperature , and surface composition of the star. We treat hydrogen and helium explicitly, and treat nitrogen, carbon and oxygen implicitly (Hubeny & Lanz, 1995). We then run SYNSPEC using the output stellar atmosphere model from TLUSTY as an input, and generate a synthetic stellar spectrum over a given (input) wavelength range, here from 900 Å to 3200 Å. The code SYNSPEC derives the detailed radiation and flux distribution of continuum and lines and generates the output spectrum. For temperatures above 35,000 K the approximate NLTE treament of lines is turned on in SYNSPEC (Hubeny & Lanz, 1995). Rotational and instrumental broadening as well as limb darkening are reproduced using the routine ROTIN. For full details of the codes see Hubeny & Lanz (2017a, b, c).
Following this procedure, we generated photospheric models for U Gem in quiescence with an effective WD temperature ranging from 25,000 K to 50,000 K in increments of 1,000 K, 500 K, and 250 K, as needed for the convergence of the model fit. The effective surface gravity was set to to match the large mass of the WD . We varied the projected stellar rotational velocity from 100 km to 250 km to match the known WD velocity of about km s-1, and in order to fit the absorption features of the spectrum, we varied the abundances of the elements, one at a time, from 0.01 solar to 20 solar.
The spectral analysis to derive the effective WD temperature and the abundance of the elements was carried out iteratively. Namely, we first assessed the WD temperature using solar abundances, then for that temperature we varied the abundances one element at a time, then we fine-tuned the WD temperature using the best-fit abundances.
3.1 Abundances
| Ion | C iii | C iv | N iii | N iii | N iii | S iv | Si iv | Si iii | Si iv | Si iii | Si iii | Si iv | Al iii | Orb.Phase |
| (Å) | 1175* | 1550 | 990 | 1085* | 1184* | 1063-73 | 1067 | 1112 | 1126 | 1143 | 1160* | 1400 | 1856-64 | |
| Exp. | ||||||||||||||
| 1-1-1 | 0.4 | 0.75 | 20 | 0.01 | 0.4 | 0.5 | 0.1 | 1.0 | 0.2 | 0.3 | 0.7 | 0.8 | 1.0 | 0.51 |
| 2 | - | 2.0 | 20 | 5 | - | 0.2 | 0.5 | 2.0 | 0.2 | 0.3 | 0.7 | 1.5 | 1.0 | 0.54 |
| 3 | - | 0.75 | 20 | 10 | - | 0.5 | 0.4 | 1.0 | 0.1 | 0.3 | - | 1.0 | - | 0.57 |
| 4 | - | 0.70 | 20 | 20 | - | 3.0 | 2.0 | 3.0 | 1.0 | - | - | 1.0 | 20 | 0.78 |
| 2-1 | 0.4 | 1.0 | 20 | 20 | 0.1 | 1.0 | 0.1 | 5.0 | 0.6 | 0.4 | 0.5 | 1.0 | 20 | 0.81 |
| 2 | - | 0.9 | 20 | 1 | - | 0.8 | 0.1 | 3.0 | 0.3 | 0.3 | 0.5 | 0.5 | 0.8 | 0.86 |
| 3 | - | 0.5 | 20 | 20 | - | 0.6 | 0.05 | 2.0 | 0.1 | 0.3 | - | 0.9 | 0.5 | 0.91 |
| 4 | - | 1.0 | 20 | 10 | - | 0.4 | 0.5 | 2.0 | 0.4 | - | - | 1.0 | 10 | 0.16 |
| 3-1 | 0.6 | 1.0 | 20 | 20 | 0.05 | 1.0 | 0.1 | - | 1.0 | 0.3 | 0.5 | 3.0 | 10 | 0.21 |
| 2 | - | 1.0 | 20 | 20 | - | 1.5 | 0.05 | - | 1.0 | 0.3 | 0.5 | 1.0 | 20 | 0.25 |
| 3 | - | 1.0 | 20 | 20 | - | 0.8 | 0.05 | - | 2.0 | 20 | 0.30 | |||
| 4 | - | 2.0 | 20 | 10 | - | 0.5 | 0.05 | 1.0 | 0.2 | - | - | 2.0 | 1.0 | 0.53 |
| 2-1-1 | 0.2 | 1.5 | 5 | 0.7 | 1 | 0.4 | 3.0∗ | 0.4∗ | 0.3∗ | 0.5∗ | 1.0 | 7 | 0.80 | |
| 2 | - | - | - | - | - | - | - | - | - | - | - | - | - | 0.83 |
| 3 | - | 0.05 | 10 | 0.5 | - | - | - | 0.6∗ | 0.08∗ | 0.2∗ | - | 0.7 | 1 | 0.85 |
| 4 | - | 0.3 | 1.0 | 0.5 | - | 1 | 0.2 | 0.6 | 0.15 | - | - | 0.5 | - | 0.88 |
| 3-1-1 | 0.1 | 1.0 | 1.0 | 10 | 1.0 | 1 | 0.3 | 0.9 | 0.40 | 0.2 | - | 1.0 | 3 | 0.98 |
| 2 | - | 1.0 | - | 3 | - | 2 | 0.2 | 1.0 | 0.2 | 0.2 | 1.0 | 0.6 | 2 | 0.00 |
| 3 | - | 0.7 | - | 1.0 | - | 0.4 | - | 0.7∗ | 0.1 | 0.2 | - | 0.5 | 0.2 | 0.03 |
| 4 | - | 0.1 | - | 0.1 | - | 0.4 | 0.5 | 0.4∗ | 0.15∗ | - | - | 0.6 | 1 | 0.24 |
| 4-1-1 | 0.5 | 2.5 | 20 | 20 | 0.5 | 1 | 0.2 | 1∗ | 0.2 | 0.2 | - | 2.0 | 3 | 0.66 |
| 2 | - | 2.5 | - | 10 | - | 1 | 0.2 | 1∗ | 0.15 | 0.15 | 0.4 | 1.0 | 1 | 0.69 |
| 3 | - | 1.5 | 10 | 10 | - | 0 | - | 1 | 0.08 | 0.3 | - | 0.7 | 1 | 0.96 |
| 4 | - | 3.0 | 10 | 10 | - | - | - | 1 | 0.2 | - | - | 1.0 | 3 | 0.99 |
Except for hydrogen and helium that were set to solar abundances, we started by setting all the metals (i.e. ) to a very low abundance such that no absorption lines formed in the theoretical spectra, except for the lines of the hydrogen Lyman and helium Balmer series. We then increased the abundance of one metal at a time starting at 0.01 solar, up to 20 solar, taking all the discrete values : 0.01, 0.02, 0.03, 0.04, 0.05, 0.08, 0.10, 0.12, 0.15, 0.2, 0.3, 0.4, 0.5, 0.6, 0.7, 0.8, 0.9. 1, 2, 3, 4, 5, 7, 10, 15, 20. In this manner we generated theoretical spectra with varied abundances for C, N, O, P, S, Si, Al, Ar, Fe, Mg, Na, and Ne, one at a time. In all the models we choose , and for the first epoch spectra the WD temperature was set (see next sub-section) to 41,500 K, for the second epoch K, for the third epoch K, and for the fourth and last epoch K. We then fitted each line in each single sub-exposure with the varied abundances WD spectra until a match was found.
The fitting did not reveal abundances for O, P, Mg, Na or Ne (there were no matching lines). In Table 4 we list the abundances we found for C, N, S, Si, and Al, and in Fig.7 we illustrate the abundance fits for these ions. Some spectral regions (e.g. N III 990, Fig.7(a)) are more noisy than others (e.g. Si iv 1400, Fig.7(l)), and some line complexes (e.g. Si iii 1110, Fig.7(h)) exhibit different line shifts within the complex. If one considers only the vicinity of a given line (or complex), then in some cases the continuum is difficult to identify (e.g. Figs.7(a),(d)). For that reason the abundances were checked visually for each line in each sub-exposure. For the N iii (990) line (Fig.7(a)), in spite of the fact that the region is very noisy, the data do agree with a very large nitrogen abundance [N]=20 solar or larger. For the N iii (1085) absorption feature (Fig.7, panel b), the depth of the line barely changes from [N]=0.01 (solid red line) to [N]=20.0 (solid green line), and consequently one cannot rely on this feature to assess the nitrogen abundance. In addition, the exact wavelength of the line is also difficult to assess: a [N]=1 model red-shifted by more than 1 Å is also shown for comparison (solid blue line) and it fits only the right wing of the line, while the two other models fit only the left wing of the line. As to the the N iii (1184) absorption feature (panel c), it seems to be more reliable, however, the fitting of the adjacent C iii (1175) line complex brings up the question of how to assess the continuum flux level. For the nitrogen abundance derived from the N iii (1184) absorption feature, as well as for most of the other abundances derived here, we used the continuum flux level obtained from fitting the entire theoretical spectrum to the observed spectrum. For the C iii (1175) absorption feature (panel d), we found that the left wing (including two additional smaller carbon absorption lines to its left) and the right wing cannot be fitted simultaneously. The fitting of the left side of the feature (as shown in panel d, giving [C]0.4) yields a higher continuum flux level than derived from the global fit. The fitting of the right side of the feature, while giving the same continuum flux level as derived from the global fit, does not agree at all with the left side of the feature and produces a line that is far too narrow ([C]=0.01). This could be due to detector effects near the edge of the spectral segment, where the flux seems to drop. This wavelength region is only covered for one of the four detector positions used with COS, i.e. only one in four sub-exposures, we therefore decided not to rely on this carbon absorption feature, nor on the N iii 1184 feature. For the carbon abundance, we are left with the C iv doublet (1400, shown in panel e) which is covered in all the sub-exposures. Here the abundance is assessed mainly by fitting the wings of the absorption feature. The aluminum abundance is derived by fitting the Al iii doublet near 1860 Å , as shown in panel f. For the sub-exposure displayed, the aluminum abundance is in excess of 20 solar. The sulfur abundance was derived by fitting the S iv (1063 & 1073) lines (shown in panel g). This region of the spectral segment is very noisy and we found that the fitting of the 1063 line, which is to be narrower than the 1073 line, gave a lower abundance than the 1073 line, possibly due to the noise. Nevertheless, the sulphur abundance listed in Table 4 is an average taken from fitting the two lines. Silicon abundances were derived from fitting 5 absorption line complexes. The Si iii (1112), displayed in panel h, shows another example of a complex with lines that are shifted relative to one another. The Si iv (1126) displayed in panel i, shows how the right side of the absorption feature (at Å) has a reduced flux in the vicinity of the edge of the spectral segment (followed by a gradual drop to zero at 1140 Å). The Si iii (1143) absorption feature (panel j) is not very pronounced or deep, but still provides a relatively good assessment of the silicon abundance, contrary to the Si iii (1160) absorption feature (panel h) which is unreliable as it does not match the expected lines. The Si iv (1400) doublet (panel l) provides a more reliable assessement of the silicon abundance, in particular with the additional small line seen around 1419 Å . Accordingly, in Table 4, we marked all the absorption features and abundances that are unreliable with an asterix.
For argon (Ar iii 1669.5, see Fig.9), we found that the abundance would have to be 100 solar or larger. It is possible the 1669 absorption features belongs to a different element which we could not identify.
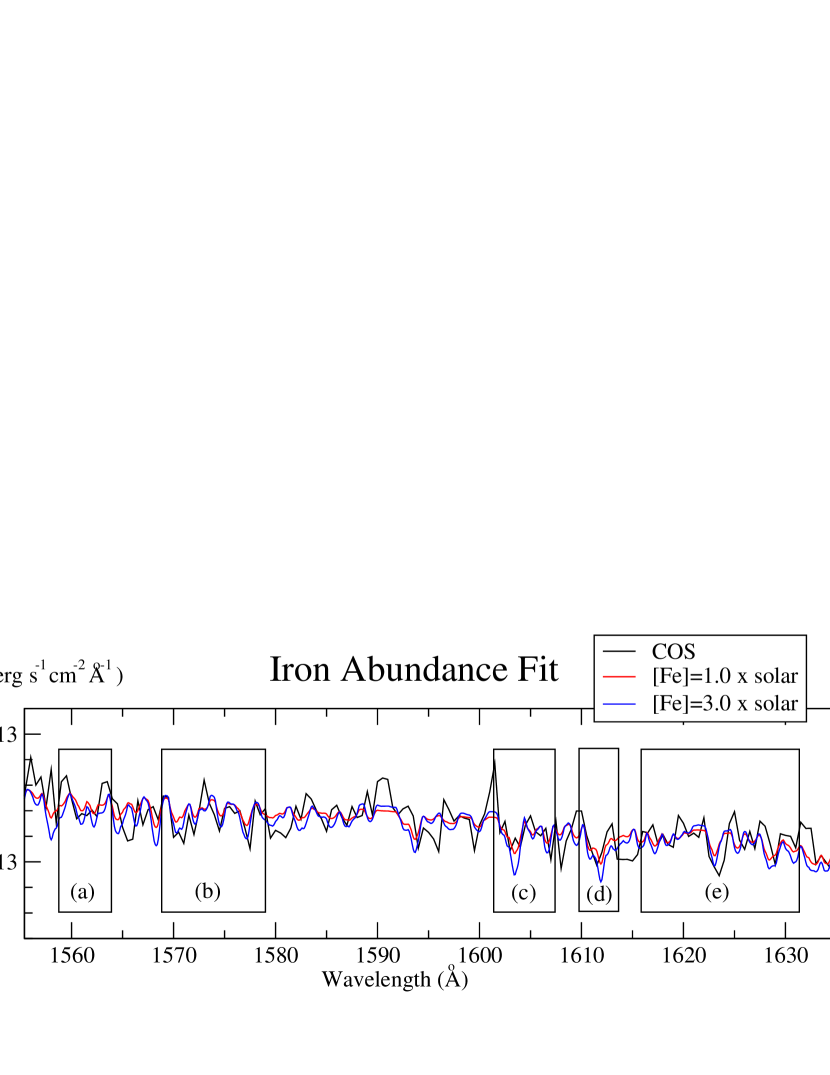
The iron abundance was derived by fitting the sawtooth pattern in the wavelength range Å, as shown in Fig.8.
Overall we found that carbon and sulfur are both consistent with sub-solar to solar abundances; nitrogen, aluminum and argon have all supra-solar abundances. Silicon is sub-solar except for the Si iii ( Å) and Si iv (1400 Å) lines that match about solar abundances, confirming the claim of Long et al. (2006) that the Si iii lines at 1110 Å require abundances that are much larger than required at 1140 and 1155 Å. We note, however, that the silicon lines at Å can be fit with a lower temperature, namely K. We will come back to this in section 3.4. The supra-solar nitrogen abundance with the sub-solar carbon abundance further confirms the anomalously high N/C ratio observed in previous spectra of U Gem in quiescence that has been attributed to CNO processing (Sion et al., 1998; Long et al., 2006).
At solar abundance, the He ii 1640 absorption feature needs a higher rotational velocity of 200-250 km s-1 in some of the sub-exposure spectra. We also found that the Si iv doublet ( Å) appears to be off (red-shifted) by about one Angstrom compared to other lines, as noted by Long et al. (2006) who suggested that they not always form in the stellar photosphere. Some of the absorption lines appear to be transient (see next subsection). We also found that the width, shape, shift and depth of many lines are not uniform and vary, even in a single sub-exposure, indicating that the lines do not form in the same medium. At a first glance (e.g. Table 4), the abundances do not seem to change as a function of the time since outburst. We, therefore, decided to analyze the absorption lines as a function of the orbital phase.
3.2 Orbital Phase Variability of the Absorption Lines
We use the ephemeris of U Gem as given by Echevarría et al. (2007) to find the phase at which each sub-exposure was obtained, where we take the phase as the secondary conjunction. The phase of the start of each exposure is indicated in Fig.4 as well as in the last column in Table 4 to within an accuracy of 0.01 ( s).
By visual inspection of the sub-exposure spectra, we found that many absorption lines appear stronger/deeper at some orbital phases, regardless of the epoch at which the spectra were taken. We, therefore, decided to examine the sub-exposure spectra in order of increasing orbital phase from 0.0 to 1.0 and to combine them near the same orbital phases when possible. Following this procedure we generated 9 spectra at orbital phases 0.00 (made of 4 sub-exposures), 0.16 (1 sub-exposure), 0.25 (3), 0.54 (3), 0.67 (2), 0.78 (1), 0.81 (2), 0.88 (4) 0.98 (1), and 1.00 (=0.00). We found that the Al iii (1854.7, 1862.8), Ar iii (1669.5), and Si ii (1526.7, 1533.4) absorption lines are particularly sharp and deep at orbital phases and 0.78, and are much weaker (almost absent) around orbital phases and 0.00 (1.00) (see Fig.9). Al iii appears to be stronger at phases 0.78 & 0.81 and 0.16 & 0.25, namely over a wider range of phases.
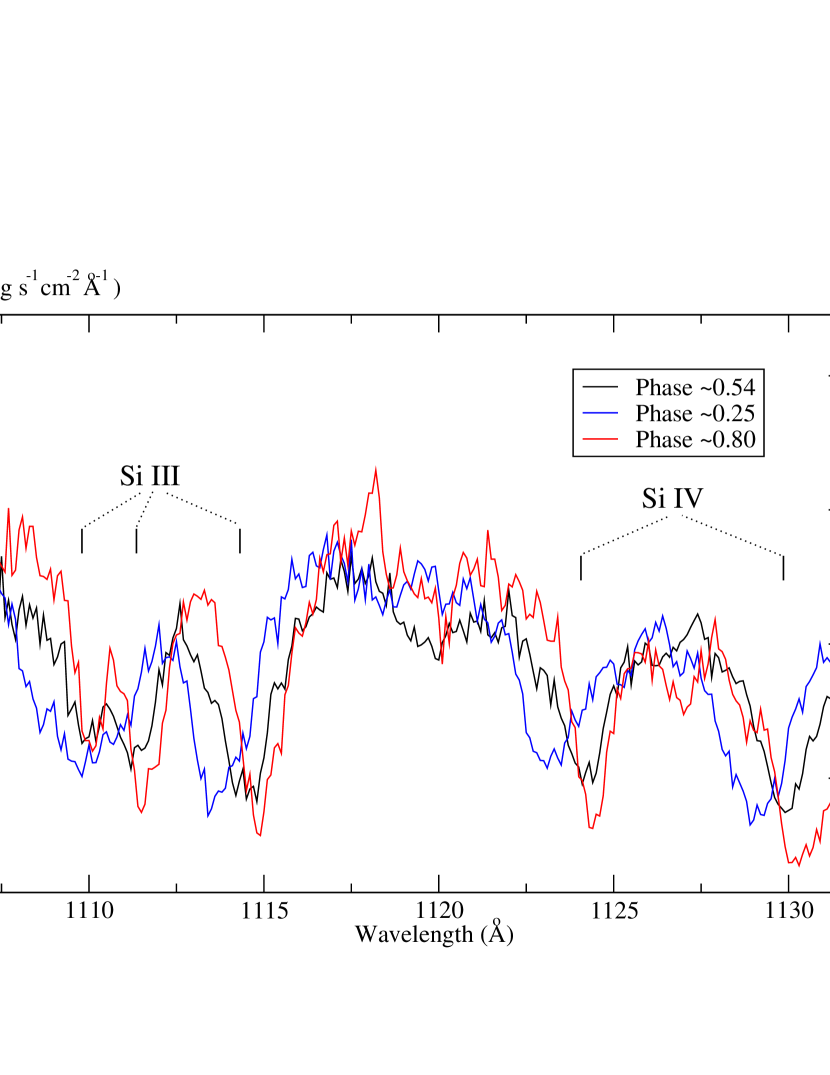
Most of the other metal absorption lines (especially the silicon lines in the range to Å) seem to exhibit some change with the orbital phase, where the depth of the absorption lines decreases from phase 0.80 (deepest), to phase 0.25 (intermediate), and phases 0.0 and 0.54 (shallowest, see Fig.10). The Si iv (1400), and C iv (1550) absorption lines are only slightly deeper around phase 0.25 and 0.80, while the He ii (1640) absorption line does not exhibit such a variation. Due to the wavelength coverage of the sub-exposure spectra we could not carry out the same analysis for the the C iii (1175) and N iii (1183) absorption lines. In addition, the low S/N below 1100 Å prevented us from obtaining robust results for absorption lines in that wavelength region.
In spite of the fact that the sub-exposure spectra were obtained at 4 different epochs, the results show a consistent increase in the depth of the absorption lines at orbital phases 0.16-0.30 and 0.67-0.81, indicating the presence of an absorbing material with high metal content (i.e. Si, Al, Ar) in front of the WD at those phases. This is in complete agreement with the results of Froning et al. (2001); Long et al. (2006) who found an increase in depths of the lines and the sudden appearance of low-ionization lines at orbital phase between 0.53 and 0.85. These are the same orbital phases at which the X-ray and EUV light-curves dip, as seen in U Gem in both outburst and quiescence (Mason et al., 1988; Long et al., 1996; Szkody et al., 1996). The increase in the depth of the absorption lines and the EUV/X-ray light curve dips have possibly the same origin, i.e. a (rim) disk bulge with mass stream overflow material located at large disk radii to agree with the observed low radial velocity (Froning et al., 2001; Long et al., 2006). The increase in the depth of the lines around phase 0.16-0.30 can be attributed to the stream material overflowing the disk rim and bouncing off the disk surface near phase 0.5 where it is then redirected toward phase (Kunze et al., 2001).
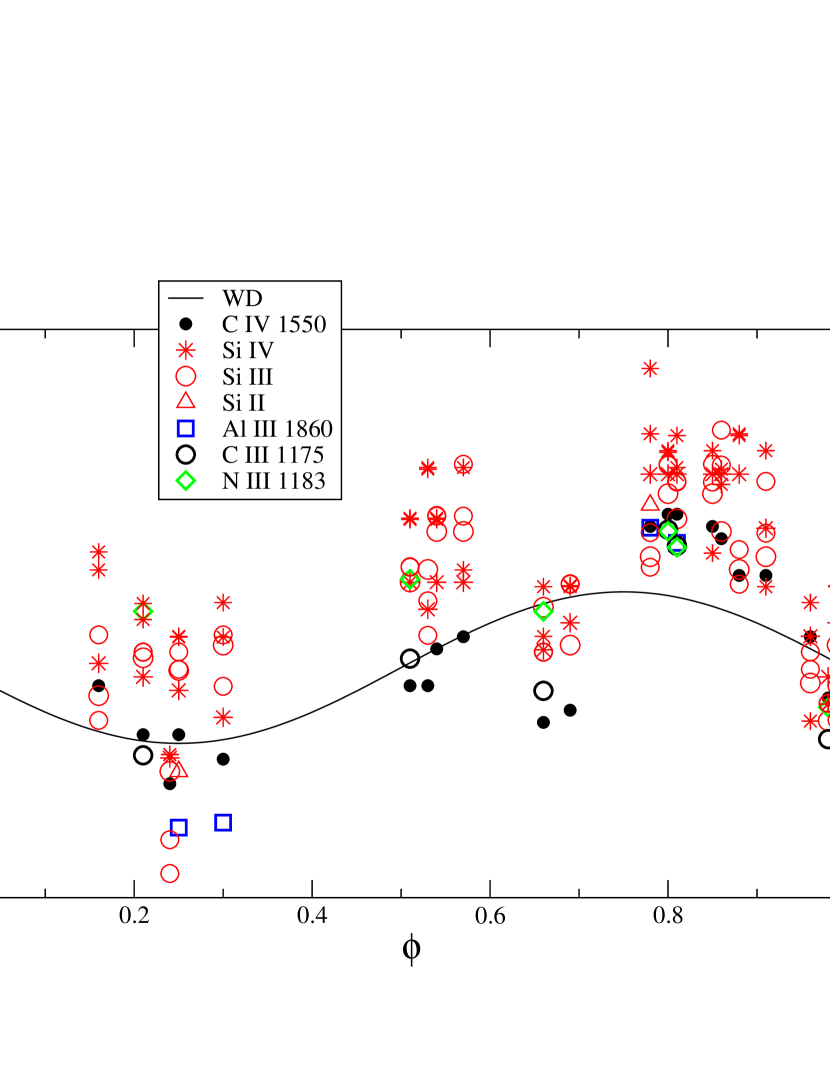
In order to try and further identify the location of the formation of the absorption lines in the COS spectrum of U Gem, we measured the velocity shift of the lines in each sub-exposure spectra. We match each line individually with the corresponding line in a synthetic stellar atmosphere spectrum generated with TLUSTY/SYNSPEC, and we (red- or blue-) shifted the spectrum until the observed line became superposed to the theoretical line. In this manner we obtained a spectral shift accurate within 0.1 Å , which we then translated into a radial velocity shift. The lines for which the velocity was measured were the C iv (1550), Si iv (1400, 1122.5, 1128.3), Si iii (1113, 1144, 1500), and Si ii (1530). For the C iii (1175), N iii (1183), and Al iii (1860) lines only a limited number of dataset were available. The velocity shift of the absorption lines is displayed as a function of the orbital phase in Fig.11, together with the expected velocity shift of the WD, taking into account a 122 km s-1 orbital velocity (Long et al., 2006), a 80.4 km s-1 gravitational redshift (Sion et al., 1998), and a recessional velocity of 84 km s-1 (Wade, 1981). The first thing that is striking in Fig.11 is the large scatter observed at all phases, but this scatter has been observed before (Froning et al., 2001). The carbon lines (in black) appear to follow the WD velocity more closely than the other lines, and the Si iv lines seem to have the largest velocity offset, followed closely by the Si iii lines. Long et al. (2006) also found the Si iv doublet ( Å) to be red-shifted by about one Angstrom compared to the other lines, suggesting that they not always form in the stellar photosphere. For the most part the velocity offset of the silicon is positive, indicative of material falling toward the WD. The average velocity offset is the largest (positive) at phases 0.78-0.91, which is consitent with the location of the L1-stream material overflowing the disk’s edge and falling toward smaller radii.
3.3 Orbital Phase Variability of the Continuum.
The 12 sub-exposures of the first epoch are covering a complete binary orbit and where all obtained within that time frame. The sub-exposures obtained at epoch # 2, 3 and 4 have a lower flux since they were obtained as the system was declining. Consequently, in order to check the variability of the continuum in a self-consistent manner, we used only the 12 sub-exposures from the first epoch. For each of the 12 sub-exposures we integrated the flux from 915 Å to 2000 Å and normalized it. The resulting COS FUV lightcurve is presented in Fig.13 and exhibits an orbital phase variability with a maximum amplitude of only 5%, which is relatively small compared to +20% and -30% observed in FUSE observations obtained in deep quiescence (Long et al., 2006). Even though the lightcurve is made of only 12 data points covering the entire binary orbit, we notice that the two lowest points are at (local minimum) and (global minimum), with maximum at phases .
In order to make a better comparison with the FUSE and optical lightcurves, we generated two lightcurves, one covering the shorter wavelengths 915-1100 Å , and the other one covering the 1380-2000 Å region (Fig.13).
The two dips observed in Fig.13 appear mainly as features in the short wavelength lightcurve only (in blue in Fig.13). The two dips correspond to veiling of the WD by the same L1-stream material that has overflowed the disk rim (near ): first as it overflows higher above the disk toward smaller radii near , then as it is re-directed toward phase 0.25 after it has bounced off the disk surface near phase 0.5 (Kunze et al., 2001). This is completely consistent with the FUSE lightcurve revealing dips at orbtial phase 0.6-0.85 as well as at orbital phase 0.2-0.35. Note that in the FUSE lightcurve the flux below 970 Å decreases substantially during the phase dip (Long et al., 2006).
The longer wavelength lightcurve (Fig.13) exhibits an increase of flux near phase 0.8-0.9. This is similar to the optical (blue and red) light curves revealing a strong hump at phase 0.8-0.9 due to the contribution of the hot spot facing the observer and before it is occulted by the secondary near phase 0.0 (Unda-Sanzana et al., 2006; Echevarría et al., 2007). A secondary broad hump around phase 0.25 is also observed in the H & H light curves (Marsh et al., 1990; Unda-Sanzana et al., 2006; Echevarría et al., 2007).
3.4 The White Dwarf Temperature
Since many absorption lines in the spectrum of U Gem
are either forming in an absorbing medium in front of the WD, or
are being affected by that absorbing medium, we decided to model the
WD spectrum using the continuum and not concentrate on the metal
absorption lines in the model fit.
The continuum is essentially characterized by its slope and
by the broad absorption features of the hydrogen Lyman and
helium Balmer series. The advantage of the COS spectrum is that it
covers the spectral range down to the Lyman limit (though the Ly
feature falls into the detector gap) and consequently allows us to derive the
WD temperature by fitting the Lyman series. While the continuum slope
can also be used to derive the WD temperature, it is not as sensitive
to the temperature as the Lyman series (for the WD temperatures considered
here).
For our WD temperature analysis, we combined the sub-exposure
spectra by epoch to generate 4 spectra, one for each epoch.
Since the first epoch has 12 sub-exposures, its spectrum has a much
higher S/N than the second, third and fourth exposure spectra.
Also, since the lines have a ‘scattered’ velocity broadening of
about 300 km s-1 (see Fig.11; reaching
almost 400 km s-1 at ), we shifted only the first epoch
sub-exposure spectra by the WD orbital velocity before combining them.
As a results the absorption lines have a velocity broadening
larger than the known WD projected rotational velocity of
100-150 km s-1.
In order to approximately match the absorption lines we set up solar
abundances for all elements, except for nitrogen and aluminum that
were both set to solar.
We then modeled the 4 epoch spectra with synthetic WD (with )
model spectra generated in the manner described at the very beginning
of this section.
3.4.1 The First Epoch.
As we fitted synthetic WD model spectra to the first epoch spectrum, we found that the slope of the COS continuum in the longer wavelength down to 2000 Å agreed with a temperature as low as 25,000 K which gives an extremely short distance (43pc) but did not provide enough flux below 1200 Å and basically no flux below 1000 Å . As we increased the temperature to 35,000 K, the slope of the theoretical continuum decreased very slowly, while the short wavelength region was still deficient in flux and the profile of the Lyman series were not fitted properly. In the longer wavelength the slope of the continuum agreed down to about 1800 Å but the model was very slightly deficient in flux for Å.
In order to match the profile of the Lyman series (down to Å), we had to increase the temperature to 41,500 K, while the continuum of the model in the longer wavelengths slightly decreased. The Lyman series is much more sensitive to the temperature than the continuum slope in the longer wavelength and therefore provides a much more reliable way to determine the temperature of the WD. This model presents a satisfactory fit to the overall spectrum and is presented in Fig.14.
Our grid of model for epoch 1 is spaced every 250 K, and we find that the best fit spans 3 models, from 40,250 K to 40,750 K, giving limiting values of 40,000 K and 41,000 K. We therefore take a 500 K error bar for the WD temperature, namely, for the first epoch spectrum we find a WD temperature of 41,500 K500 K, 15 days after the peak of the outburst. For comparison, a 40,500 K model has a flux that is 3% too low at 1000 Å when scaled from the flux at 1400 Å , but the calibration errors of COS are 1.5% at 1400 Å .
With a distance of 100.3 pc, the scaled WD radius is 5,029 km, corresponding to a WD mass of at a temperature of 41,500 K (Wood, 1995; Panei et al., 2000). The WD mass and radius give an effective surface gravity of which is consistent with our assumption of . This model is a little deficient in flux at very short wavelengths ( Å) and long wavelengths ( Å , see Fig.14). A possible explanation for the discrepancy in the very long wavelength region could be a detector edges effects as apparent from Fig.2.

There are other possible emitting components in the system such as the hot spot (L1-stream impacting the rim of the disk), the boundary layer, or the very low mass accretion rate disk which could contribute additional flux. It has also been suggested that the WD itself could have a hot accretion belt remaining in its equatorial region after ouburst, or the WD could have a non-uniform temperature (Long et al., 1993; Sion et al., 1998; Long & Gilliland, 1999; Long et al., 2006). As mentioned previously, not all the silicon lines can be fitted at the same time with the same abundance, however, this could also be due to two emitting components with a different temperature. For example the Si ii (1530) and Si iii () lines are best fitted at 30,000 K (assuming ), while the other silicon lines give a better fit at 35,000-45,000 K. We therefore tried two-temperature WD models, with a hot equatorial region on the surface of a cooler WD.
In order to fit the longer wavelength region, we started by taking a low WD temperature ( K) model (with a corresponding larger radius) that did not provide any flux in the short wavelength region, and added to it the contribution from a hotter region ( K and higher) to provide flux in the shorter wavelength region. Such models did not fit the COS spectrum better than the single WD models. We varied the size and temperature of the hot equatorial region and the temperature of the WD, but this combined model did not provide a qualitatively better fit to the single WD model and was not required by the data. The number of two-temperature models that could fit the data was very large (divergence of the solution). Therefore, in in our analysis below, we only considered single WD models.
The WD temperature depends on the assumed effective surface gravity () of the model as well as on the addition of a hot second component (Long et al., 1995, 2006)). The second component is not always detected (Sion et al., 1998), either because of the wavelength coverage (i.e. Å) or maybe simply because it is not always there. The nature of the second component is still a matter of debate, as different physical models for the second component fit the data just as well (Long et al., 2006). Nevertheless, the WD temperature we obtained two weeks after the peak of the outburst is in good agreement with previous spectral analysis of the system in quiescence and decline (Sion et al., 1998; Long & Gilliland, 1999; Froning et al., 2001; Long et al., 2006).
3.4.2 The Second Epoch.

With only three sub-exposures, the second epoch spectrum has a much noisier spectrum, especially in the short wavelength region. Our single WD model fit gave a temperature of 39,850 K , and a scaled WD radius of 5,022 km, nearly equal to that obtained for epoch # 1. However, due to the slightly lower temperature, this radius corresponds to a 1.109 WD mass, or a of 8.766. This model fit is presented in Fig.15. This spectrum was obtained 21 days after the peak of the outburst, exhibiting a cooling of 1,650 K in 6 days. The discrepancy in the long wavelength region is barely noticeable, but it is still noticeable in the very short wavelength region. The broadening of the lines (200 km s-1) includes some orbital velocity broadening as well as lines forming in different regions, as the projected WD rotational velocity is known to be about 100-150 km s-1.
3.4.3 The Third Epoch.
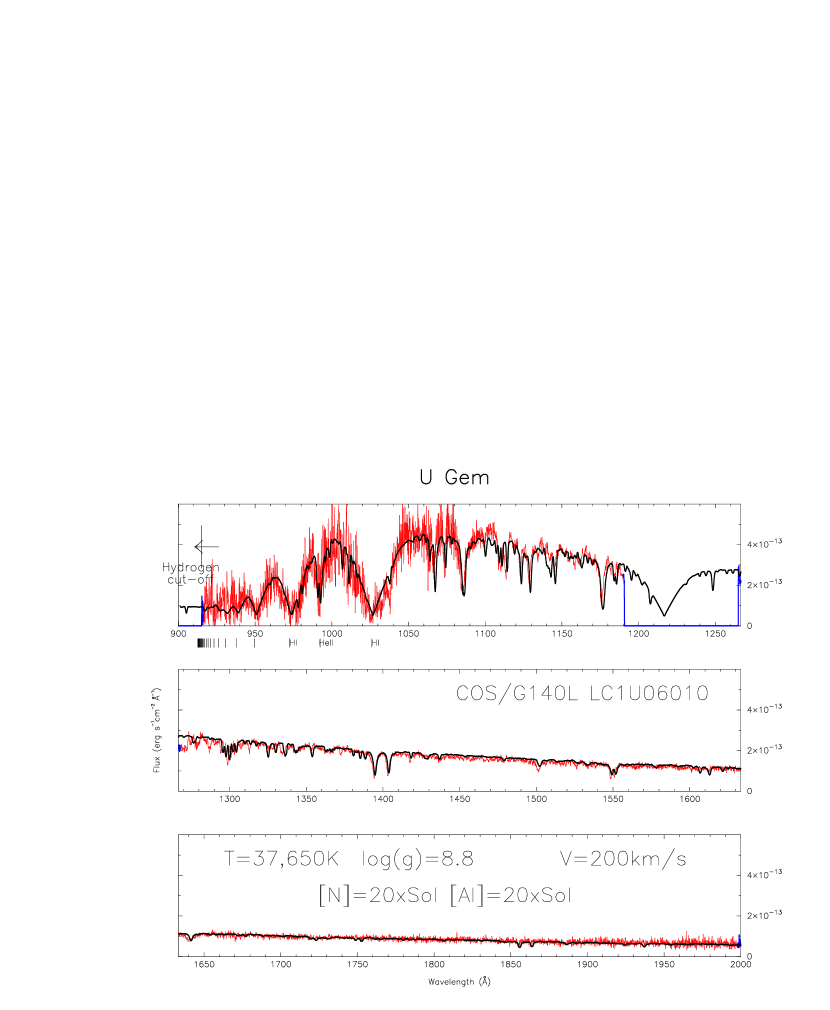
With 4 sub-exposure spectra obtained 33 days after the outburst peak, the third epoch spectrum yielded a WD temperature of 37,650 K and a scaled radius of 4,999 km. This corresponds to a WD mass of and an effective surface gravity of . In 17 days (since epoch # 2), the WD temperature dropped by an additional 2200 K. Compared to the two previous epoch spectra, the model fit (Fig.17) has improved, there is no more discrepancy in the long wavelength region, and it is barely noticeable in the short wavelength region.

3.4.4 The Fourth Epoch.
Also with 4 sub-exposure spectra, the fourth and last epoch spectrum was fitted with a single WD model with a temperature of 36,250 K (Fig.17), revealing a further cooling of 1400 K in 23 days (i.e. 56 days after the outburst peak). The scaled radius obtained was 5,005 km, corresponding to a WD mass of and an effective surface gravity of . Here too, there is no more discrepancy in the long wavelength region, and very little discrepancy in the short wavelength region.
For the third and fourth epoch spectra, the fit to the continuum is relatively good and there is little indication of a possible second emitting component. We find that our results are self-consistent with a massive WD with an effective surface gravity of (as there is basically no difference between theoretical spectra with or - which was our initial assumption), and a radius of about 5,000 km. If we take the error in the distance, of about 4%, into account, we find an error in the WD radius of 200 km, giving km. We find that the WD cools by 5,250 K in 41 days, from a temperature of 41,500 K 15 days after the peak of the outburst, down to 36,250 K 56 days after the peak of the outburst. The cooling of the WD is displayed in Fig.18. The WD radius and temperatures we obtained in our analysis are consistent with the results from the FUSE spectral analysis of Long et al. (2006), who obtained a temperature of (for , respectively) 10 days after the peak of a wide outburst, and (for ) 135 days after the peak of a (different but similar) wide outburst.

4 Summary and Conclusion
We have obtained HST/COS spectra of U Gem following a wide outburst when the WD dominated the FUV. The spectra were taken at 4 epochs, 15 days, 21 days, 33 days, and 56 days after the peak of the outburst, and reveal a decreasing FUV flux as a function of time, an obvious sign of the cooling of the WD.
-
1.
The HST/COS spectra of U Gem exhibits the usual hydrogen Lyman and helium Balmer absoprtion lines forming in the WD photosphere, as well as absorption lines of low ionization energy species of carbon (C ii iii iv), nitrogen (N iii), sulphur (S iv) and silicon (Si ii iii iv). We also identified absorption lines of iron (Fe ii), aluminum (Al iii), and possibly also argon (Ari̇ii). All the metal lines could potentially form in the photosphere of a moderately hot WD. However, many of them (i.e. Si, Al, Ar) are deeper at orbital phases and 0.67-0.81, indicating the presence of absorbing material at these specific phases. Higher ionization energy species of N iv and O vi seen in absorption are known to form at a much higher temperature ( K) and are not attributed to the WD. The spectra do not show any emission features.
-
2.
The first epoch spectra cover en entire orbital phase and show a variation in the continuum flux level with the orbital phase that is more pronounced in the short wavelength range. The FUV light curves display an increase in flux near phase , a small dip near phase and a stronger dip near phase . The increase in flux at is most likely due to the hot spot facing the observer (Unda-Sanzana et al., 2006; Echevarría et al., 2007). The dip around phase is due to L1-stream material overflowing the disk rim and falling toward smaller radii, where it has been shown to bounce back off the disk plane near phase ; there it is re-directed toward (Kunze et al., 2001), where it is likely responsible for the small dip observed in the FUV lightcurve at . The overflowing L1-stream material is also responsible for the strong orbital phase variation of the depth of the the absorption lines of silicon, aluminum and argon.
-
3.
Our analysis of absorption lines velocity as a function of the binary orbital phase reveals an overall red-shift in the velocity of the silicon lines, especially Si iii & iv, compared to the WD orbital velocity, indicating material falling towards the WD. The largest velocity shift in the lines is observed around phase . The carbon lines appear to follow more closely the WD orbital velocity, implying that they are probably forming in the WD photosphere.
-
4.
The spectra exhibit solar to sub-solar abundances of carbon and sulfur, supra-solar (up to ) abundances of nitrogen, aluminum, and argon, while iron is only marginally supra-solar (). Silicon is sub-solar except for the Si iii ( Å) and Si iv (1400 Å) that are solar. Our analysis indicates that the silcon, aluminum and argon lines are at least in part forming in material above the disk veiling the WD at orbital phases and . In spite of the fact that many lines might be affected by absorbing material in front of the WD at all orbital phases, our analysis confirms the high N/C ratio observed previously in the FUV spectra of U Gem in quiescence, a sign of possible CNO enrichment of the accreted material on the WD surface.
-
5.
At the time of the first epoch, 15 days after the peak of the outburst, the WD was still rather hot reaching a temperature of 41,500 K. By the time of the 4th epoch, 41 days later, the WD had cooled down to a temperature of 36,250 K. The temperatures we obtained are consistent with previous observation of U Gem in quiescence for the considered here (Long et al., 2006) and are theoretically consistent with compressional heating and subsequent cooling of the WD as shown by Sion (1995).
-
6.
The spectra are consistent with a single temperature WD component, and two-temperature WD models did not provide any improvment in the fit. Our single WD temperature model fits are self-consistent with a massive WD with an effective surface gravity and a ( K) WD radius of km corresponding to a WD mass and consistent with previous spectral analysis of U Gem in quiescence (Long et al., 2006).
-
7.
We confirm that phase-dependent absorption is the most plausible interpretation of the time-variable absorption seen in the FUV spectra of U Gem during quiescence, and we concur with Long et al. (2006) that it complicates the analysis of the WD spectra.
The picture that emerges from the orbital phase variability of the spectra is a familiar one. The L1-stream material hits the disk’s rim near creating a peak in the UV light curve at that orbital phase. Some of the material overflows the disk’s edge and moves to smaller radii where it reduces the UV flux at phase 0.78, increases the depth of some absorption lines at , and adds a red-shifted component to absorption lines near . The overflowing material eventually falls back onto the disk near phase 0.5 (as corroborated by Doppler mapping Echevarría et al. (2007) and simulations Kunze et al. (2001)) where it bounces back off the disk and continues in a trajectory toward . At this phase the material is high enough above the disk to veil the WD for a second time, creating a second dip in the UV lightcurve as well deeper absorption lines in the spectrum.
References
- (1)
- Bruch & Engel (1994) Bruch, A., & Engel, A. 1994, A&AS, 104, 79
- Dai & Qian (2009) Dai, Z., Qian, S. 2009, ApSS, 321, 91
- Echevarría et al. (2007) Ecchevarría, J., de la Fuente, E., Costero, R. 2007, ApJ, 134, 262
- Froning et al. (2001) Froning, C.S., Long, K.S., Drew, J.E., Knigge, C., Proga, D. 2001, ApJ, 562, 963
- Godon et al. (2012) Godon, P., Sion, E.M., Levay, K. et al. 2012, ApJS, 203, 29
- Hamada & Salpeter (1961) Hamada, T., & Salpeter, E.E. 1961, ApJ, 134, 683
- Harrison et al. (2004) Harrison, T.E., Johnson, J.J., MaArthur, B.E., Benedict, G.F., Szkody, P., Howell, S.B., & Gelino, D.M. 2004, AJ, 127, 460
- Hind (1856) Hind, J.R. 1856, MNRAS, 16, 56
- Hubeny (1988) Hubeny, I. 1988, Comput.Phys.Commun., 52, 103
- Hubeny & Lanz (1995) Hubeny, I., & Lanz, T. 1995, ApJ, 439, 875
-
Hubeny & Lanz (2017a)
Hubeny, I., & Lanz, T. 2017a,
A brief introductory guide to TLUSTY and SYNSPEC
arXiv:1706.01859 -
Hubeny & Lanz (2017b)
Hubeny, I., & Lanz, T. 2017b,
TLUSTY User’s Guide II: Reference Manual
arXiv:1706.01935 -
Hubeny & Lanz (2017c)
Hubeny, I., & Lanz, T. 2017c,
TLUSTY User’s Guide III: Operational Manual
arXiv:1706.01937 - Kiplinger et al. (1991) Kiplinger, A.L., Sion, E.M., & Szkody, P. 1991, ApJ, 366, 569
- Kraft (1962) Kraft, R.P. 1962, ApJ, 135, 408
- Krzeminski (1965) Krzeminski, W. 1965, ApJ, 142, 1051
- Kunze et al. (2001) Kunze, S., Speith, R., & Hessman, F. 2001, MNRAS, 322, 499
- la Dous (1991) la Dous, C. 1991, A&A, 252, 100
- Long & Gilliland (1999) Long, K.S., Gilliland, R.L. 1999, ApJ, 511, 916
- Long et al. (1993) Long, K.S., Blair, W.P., Bowers, C.W., Davidsen, A.F., Kriss, G.A., Sion, E.M., & Hubeny, I. 1993, ApJ, 402, 327
- Long et al. (1995) Long, K.S., Blair, W.P., Raymond, J.C. 1995, ApJ, 454, L39
- Long et al. (2006) Long, K.S., Brammer, G., Froning, C.S. 2006, ApJ, 648, 558
- Long et al. (1996) Long, K.S., Mauche, C.W., Raymond, J.C., Szkody, P., & Mattei, J.A. 1996, ApJ, 469, 841
- Long et al. (1994) Long, K.S., Sion, E.M., Huang, M., & Szkody, P. 1994, ApJ, 424, L49
- Marsh et al. (1990) Marsh, T.R., Horne, K., Schlegel, E.M., Honeycutt, R.K., Kaitchuck, R.H. 1990, ApJ, 364, 637
- Mason et al. (1988) Mason, K.O., Córdova, F.A., Watson, M.G., & King, A.R. 1988, MNRAS, 232, 779
- Panei et al. (2000) Panei, J.A., Althaus, L.G., & Benvenuto, O.G. 2000, A&A, 353, 970
- Panek & Eaton (1982) Panek, R.J., & Eaton, J.E. 1982, ApJ, 258, 572
- Panek & Holm (1984) Panek, R.J., & Hom, A.V. 1984, ApJ, 277, 700
- Ritter & Kolb (2003) Ritter, H., & Kolb, U. 2003, A&A, 404, 301 (update RKcat7.24, 2016)
- Sion (1995) Sion, E.M. 1995, ApJ, 438, 876
- Sion et al. (1997) Sion, E.M., Cheng, F.H., Szkody, P., Huang,M., Provencal, J. Sparks, W., Abbott, B., Hubeny, I. Mattei, J., & Shipman, H. 1997, ApJ, 483, 907
- Sion et al. (1998) Sion, E.M., Cheng, F.H., Szkody, P., Sparks, W., Gänsicke, B.T., Huang, M., & Mattei, J. 1998, ApJ, 496, 449
- Smak (1971) Smak, J.I. 1971, Acta Astron., 21, 15
- Smak (1976) Smak, J.I. 2976, Acta Astron., 26, 277
- Smak (2001) Smak, J.I. 2001, Acta Astron., 51, 279
- Szkody and Mattei (1984) Szkody, P., and Mattei, J. 1984, PASP, 96, 988
- Szkody et al. (1996) Szkody, P., Long, K.S., Sion, E.M., & Raymond, J.C. 1996, ApJ, 469, 834
- Unda-Sanzana et al. (2006) Unda-Sanzana, E., Marsh, T.R., and Morales-Rueda, L. 2006, MNRAS, 369, 805
- Verbunt (1987) Verbunt, F. 1987, A&AS, 81, 339
- Wade (1981) Wade, R.A. 1981, ApJ, 246, 215
- Warner and Nather (1971) Warner, B., and Nather, R.E. 1971, MNRAS, 152, 219
- Wood (1995) Wood, M.A. 1995, in White Dwarfs, Proc. 9th Europ.Workshop on WDs, eds. D. Koester & K. Werner (Lecture Notes in Physics, Vol.443; Berlin: Springer), 41
- Zhang and Robinson (1987) Zhang, E.H., & Robinson, E.L. 1987, ApJ, 321, 813