The velocity ellipsoid in the Galactic disc using Gaia DR1
Abstract
The stellar velocity ellipsoid of the solar neighbour (d 200 pc) is re-examined using intermediate-old mono-abundances stellar groups with high quality chemistry data together with parallaxes and proper motions from Gaia DR1. We find the average velocity dispersion values for the three space velocity components for the thin and thick disc of (,,)thin = (33 4, 28 2, 23 2) and (,,)thick = (57 6, 38 5, 37 4) km s-1, respectively. The mean values of the ratio between the semi-axes of the velocity ellipsoid for the thin disc are found to be, = 0.70 0.13 and is 0.64 0.08, while for the thick disc = 0.67 0.11 and is 0.66 0.11. Inputting these dispersions into the linear Strömberg relation for the thin disc groups, we find the Sun’s velocity with respect to the LSR in Galactic rotation to be V☉ = 13.9 3.4 km s-1. A relation is found between the vertex deviation and the chemical abundances for the thin disc, ranging from -5 to +40∘ as iron-abundance increases. For the thick disc we find a vertex deviation of luv -15∘. The tilt angle (luw) in the - plane for the thin disc groups ranges from -10 to +15∘, but there is no evident relation between luw and the mean abundances. However we find a weak relation for luw as a function of iron abundances and -elements for most of the groups in the thick disc, where the tilt angle decreases from -5 to -20∘ when [Fe/H] decreases and [/Fe] increases. The velocity anisotropy parameter is independent of the chemical group abundances and its value is nearly constant for both discs ( 0.5), suggesting that the combined disc is dynamically relaxed.
keywords:
astrometry, Galaxy: abundances; Galaxy: disc; Galaxy: kinematics and dynamics; Galaxy: solar neighbourhood1 Introduction
Determining the shape and orientation of the three-dimensional distribution of stellar velocities (i.e., the velocity ellipsoid) is a longstanding problem in Galactic dynamics. From epicyclic theory and for a galaxy with a flat rotation curve, the ratio of tangential to radial velocity dispersion is predicted to be 1/ and the orientation of the stellar velocity ellipsoid is tightly related to the shape and symmetry of the Galactic potential — see, for instance, Amendt & Cuddeford (1991); Kuijken & Gilmore (1991); Smith et al. (2012) and references therein. On the other hand, non-axisymmetric structures such as bars (Dehnen, 2000; Minchev et al., 2010) and spiral arms in disk galaxies (Vorobyov & Theis, 2008) might play an important role in influencing the observed orientation of the stellar velocity ellipsoid. For example, Saha et al. (2013) used N-body simulations to follow the evolution of the stellar velocity ellipsoid in a galaxy that undergoes bar instability, and showed that the tilt of the stellar velocity ellipsoid is a very good indicator of the buckling that forms stellar bars in disk galaxies.
Measuring observationally a precise orientation of the velocity ellipsoid has been difficult, mainly due to the absence of reliable parallaxes and proper motions for stars outside the Solar vicinity in the pre-Gaia era. We can calculate the tilt angles of the velocity ellipsoid using the following formula:
| (1) |
where the tilt angle (lij) corresponds to the angle between the -axis and the major axis of the ellipse formed by projecting the three-dimensional velocity ellipsoid onto the -plane, where and are any of the stellar velocities. The traditional vertex deviation within the Galactic plane is defined as luv. By extension we define the tilt of the velocity ellipsoid with respect to the Galactic plane as luw. If the deviation is positive the long axis of the velocity ellipsoid is pointing into the first (l = 0 - 90∘) quadrant. In a stationary, axisymmetric disk galaxy, the stellar velocity ellipsoid in the Galactic mid-plane is perfectly aligned with the Galactocentric coordinate axes (e.g., Binney & Tremaine 2008; Smith et al. 2012).
Siebert et al. (2008) and Pasetto et al. (2012), using a stellar sample from the RAVE survey covering a relatively large range in height from the plane (0.5 1.5 kpc), found that the local velocity ellipsoid is tilted toward the Galactic Plane, with an angle of +7.3 1.8∘. Using also radial velocities from the RAVE survey together with proper motions from the Southern Proper Motion Program (SPMP), Casetti-Dinescu et al. (2011) found a tilt angle of +8.6 1.8∘. From SDSS DR7 disc stars, Carollo et al. (2010) found a tilt angle of +7.1 1.5∘ while for very metal-poor halo stars they found a larger tilt of +10.3 0.4∘ in the range of Galactic heights 1 z 2 kpc. Moni Bidin et al. (2012), used a sample of 1200 red giants vertically distributed in a cone of 15∘ radius centered on the South Galactic Pole, found results in agreement with those of Siebert et al. (2008) and Casetti-Dinescu et al. (2011). Smith et al. (2012) also used SDSS DR7 data, but restricted to Stripe 82. These authors concluded that the tilt angles are consistent with a velocity ellipsoid aligned in spherical polar coordinates, however, the data suffers from larger uncertainties. Recently, Büdenbender et al. (2015), using SDSS/SEGUE G-type dwarfs stars together with USNO-B proper motions, found for the Solar neighborhood ( 425 pc) a tilt angle of –4.7 2.0∘. All of these previous studies addressing the orientation of the velocity ellipsoid problem considered the Galactic disc as a single component, with the exception of Büdenbender et al. (2015) who distinguished between two sub-samples using [/Fe] abundances. However, it is well established that the Galactic disc has a thick component that is chemically distinguished from a thinner one, suggesting a different chemical evolution and, hence distinct disc-formation mechanisms and epochs (e.g.; Chiappini et al. 1997; Fuhrmann 2011; Masseron & Gilmore 2015). This high-[/Fe] sequence, related to the thick disc, exists over a large radial and vertical range of the Galactic disc (e.g., Nidever et al. 2014; Hayden et al. 2015).
One of the main goals of the present work is to explore the orientation of the velocity ellipsoid for the thin and thick discs separately and in mono-abundances groups. Using a very local sample close to the Galactic plane, where the expected velocity ellipsoid tilt should be zero, we want to quantify possible tilt deviations related to the non-axisymmetric structures in the Milky Way disc. We also explore the ellipsoid orientation as a function of stellar iron and [/Fe] abundances. To understand the kinematical properties in the solar circle for the two components of the Galactic disc, we distinguish the two components chemically employing chemical labeling, where stars are grouped in abundance space (Freeman & Bland-Hawthorn, 2002; Ting et al., 2012; Mitschang et al., 2013). We also make use of parallaxes and proper motions from the first Gaia data release (Gaia Collaboration et al., 2016). Variations of the vertex deviation and the tilt angle of the velocity ellipsoid with respect to the vertical Galactic height have been the subject of several studies (Smith et al., 2012; Moni Bidin et al., 2012; Büdenbender et al., 2015), however little progress has been made to address the orientation of the velocity ellipsoid with respect to stellar abundances. Moreover, we exploit the derived velocity dispersions to explore the relation between the Galactic rotation velocity and the stellar abundances. Recently, an intriguing statistical relation has been found between rotational velocity and [Fe/H], with opposite signs for the thin and thick disc (Lee et al., 2011; Adibekyan et al., 2013; Allende Prieto et al., 2016), which suggests that thin disc stars with higher metallicities still have a guiding center radius smaller than that for the lower metallicity stars, and they have larger velocity dispersion and asymmetric drift. However, it is not clear that the velocity dispersion of intermediate-old thin disc stars decreases with radius (Minchev et al., 2014).
This paper is organized as follows. In Section 2 we describe the stellar sample and how we break it up into chemical groups. Section 3 explains parallaxes, proper motions, radial velocities and how they are used to derive individual space velocities for the stellar sample. In Section 4 we explore the rotation-metallicity relation for the chemical groups. Section 5 presents our analysis of the velocity ellipsoid, linear Strömberg relation and the Galactic velocity anisotropy parameter. The most important results are summarized and discussed in Section 6.
2 The data
2.1 The stellar sample
We make use of the high-resolution spectroscopic study of 714 F and G intermediate-old dwarfs and subgiant stars in the solar neighbourhood by Bensby et al. (2014). The spectra have high resolution ( = 40,000 - 110,000) and signal-to-noise (SNR = 150 - 300). They were obtained with the FEROS spectrograph on the ESO Very Large Telescope, the HARPS spectrograph on the ESO 3.6 m telescope, and the MIKE spectrograph on the Magellan Clay telescope. Bensby et al. (2014) provided detailed elemental abundances for O, Na, Mg, Al, Si, Ca, Ti, Cr, Fe, Ni, Zn, Y and Ba. The determination of stellar parameters and elemental abundances is based on analysis using equivalent widths and one-dimensional, plane-parallel model atmospheres calculated under local thermodynamical equilibrium (LTE). Departures from the assumption of LTE (NLTE corrections) were applied to Fe I line, (see Bensby et al. 2014 for details.)
2.2 The chemical groups
The chemical tagging experiment by Mitschang et al. (2013, 2014) used the sample described above to identify groupings of nearby disc field stars that share metal abundances using a Manhattan distance metric. The field stars they identified as having similar abundances are not clustered in space, nor do they share similar space motions (Quillen et al., 2015). These groups represented a first attempt to identify groups of stars from single, discrete birth events. However, it is beyond the scope of this paper to analyze whether the stars in a chemical group were born in the same molecular cloud or formed in different clusters but with the same chemical patterns to the level of precise abundance determination of Bensby et al. (2014). We refer the reader to De Silva et al. (2007), Mitschang et al. (2014), Blanco-Cuaresma et al. (2015), Hogg et al. (2016), Ness et al. (2017) and references therein where this topic is debated in detail. In this study, we rather focus on the usefulness of chemical groups for exploring the kinematical properties of the very local thin and thick Galactic disc.
| N | [Fe/H] (dex) | [/Fe] (dex) | |
|---|---|---|---|
| Thin disc | 41 | +0.07 0.07 | +0.01 0.01 |
| 25 | –0.07 0.06 | +0.03 0.02 | |
| 21 | +0.23 0.04 | +0.01 0.02 | |
| 19 | –0.02 0.06 | +0.04 0.01 | |
| 16 | –0.52 0.05 | +0.10 0.02 | |
| 15 | –0.34 0.04 | +0.09 0.02 | |
| 15 | +0.33 0.04 | –0.01 0.02 | |
| Thick disc | 30 | –0.29 0.05 | +0.18 0.02 |
| 24 | –0.43 0.05 | +0.21 0.02 | |
| 21 | –0.64 0.07 | +0.26 0.02 | |
| 17 | –0.81 0.05 | +0.29 0.01 | |
| 15 | –0.18 0.06 | +0.13 0.02 |
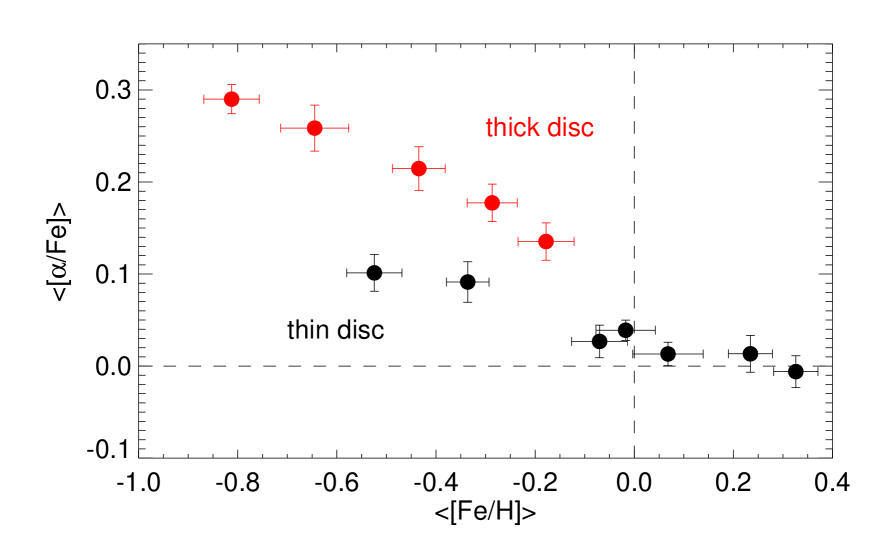
From all the groups identified in Mitschang et al. (2014) we only select those where the number of stars is larger or equal to 15 (N 15), a total of twelve groups. Figure 1 shows the ratio of the mean -elements to the iron abundance, [/Fe], as a function of the mean iron abundance, [Fe/H], for the selected chemical groups, and Table 1 shows their average abundance values and standard deviations together with the number of stars in each group. Different studies of abundance populations in the solar vicinity based on high resolution spectroscopy find that the [/Fe] distribution is bimodal, suggesting that the thin and the thick disc are chemically distinguishable — see, e.g., Navarro et al. (2011), Fuhrmann (2011), Nidever et al. (2014), and Masseron & Gilmore (2015). Using the twelve selected chemical groups we found at least two population sequences in the [Fe/H] - [/Fe] plane. One sequence, associated with the thin disc, has [/Fe] 0.1 dex and [Fe/H] ranging from +0.3 to –0.5 dex, while the second sequence, associated with the thick disc, has [/Fe] 0.1 dex and [Fe/H] ranging from –0.2 to –0.8 dex (see Fig. 1). In this work, we use the chemically distinguished thin and thick disc groups to explore the properties of the disc velocity ellipsoid and vertex deviation.
3 Stellar kinematics
3.1 Parallaxes
For the stellar parallaxes of the sample employed in this study we make use of the first Gaia data release (Gaia DR1), where the combination of positional information from the Hipparcos and Tycho-2 catalogues allows the derivation of positions, parallaxes, and proper motions for about 2 million sources from the first 14 months of observations (Gaia Collaboration et al., 2016).
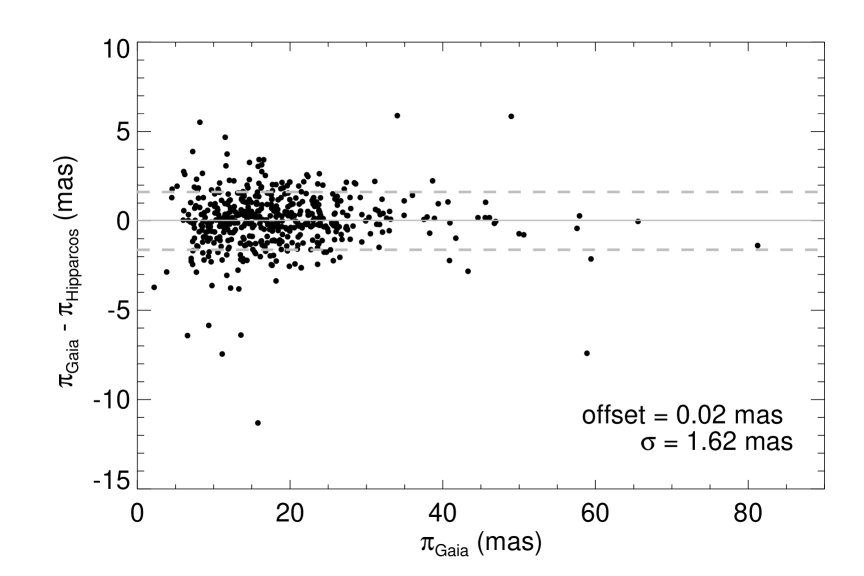
In Figure 2 we illustrate the difference in milliarcseconds (mas) between the parallaxes () measured from Gaia DR1 and those measured in Hipparcos (van Leeuwen, 2007) as a function of the parallaxes from Gaia for our stellar sample. There is no discernible offset between the measurements, and we find a small scatter of only 1.6 mas in the comparison. However, over large spatial scales it is known that the parallax zero-point variations reach an amplitude of 0.3 mas (Lindegren et al., 2016). Gaia Collaboration et al. (2016) stressed that a systematic component of 0.3 mas should be added to the parallax uncertainties. See also Brown (2017) for an update on the systematic errors in the Gaia DR1 parallaxes.

3.2 Proper motions and radial velocities
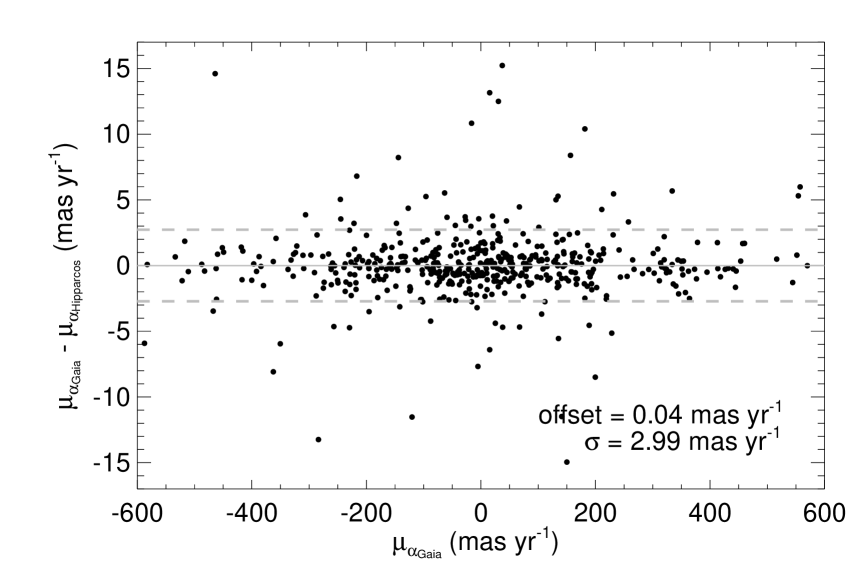

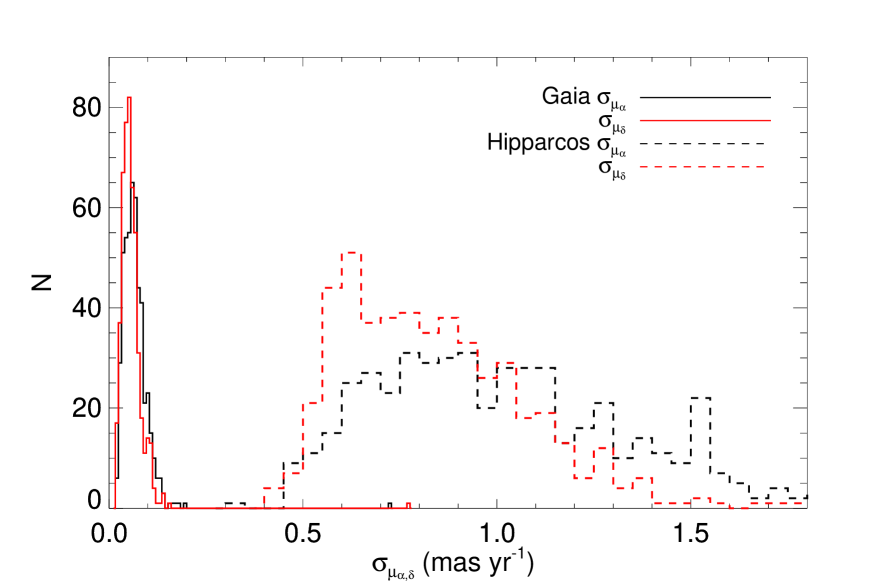
We also make use of the high quality Gaia DR1 proper motions realized by the Tycho-Gaia astrometric solution (TGAS), where the typical uncertainty is about 1 mas yr-1 for the proper motions. The stellar sample we employ in this study is included in a subset of 93,635 bright Hipparcos stars in the primary astrometric data set where the proper motions are much more precise, at about 0.06 mas yr-1 (Gaia Collaboration et al., 2016). In Figure 4 we compare the measurement of the proper motion in right ascension and declination respectively between the Hipparcos and Gaia DR1 catalogues. There is a scatter of 3 mas yr-1 in and 2.7 mas yr-1 in when comparing both measurements. Figure 5 clearly shows the major improvement in astrometry from Gaia DR1 with respect to Hipparcos. All the stars in this sample have a 0.2 mas yr-1 from Gaia DR1 (solid black and red lines) while the uncertainties in proper motions from Hipparcos show values ranging from 0.4 to 2.0 mas yr-1 (dashed black and red lines in Fig. 5). Most of our stars show a 0.05 mas yr-1. A systematic uncertainty at about 0.06 mas yr-1 may be present in the proper motions from Gaia DR1 (Gaia Collaboration et al., 2016).
The radial velocities (RVs) employed in this study were obtained from the Geneva-Copenhagen Survey (GCS), using the photoelectric cross-correlation spectrometers CORAVEL (see Nordström et al. 2004 for details). All stars have uncertainties in RVs better than 0.7 km s-1.
3.3 Space velocities
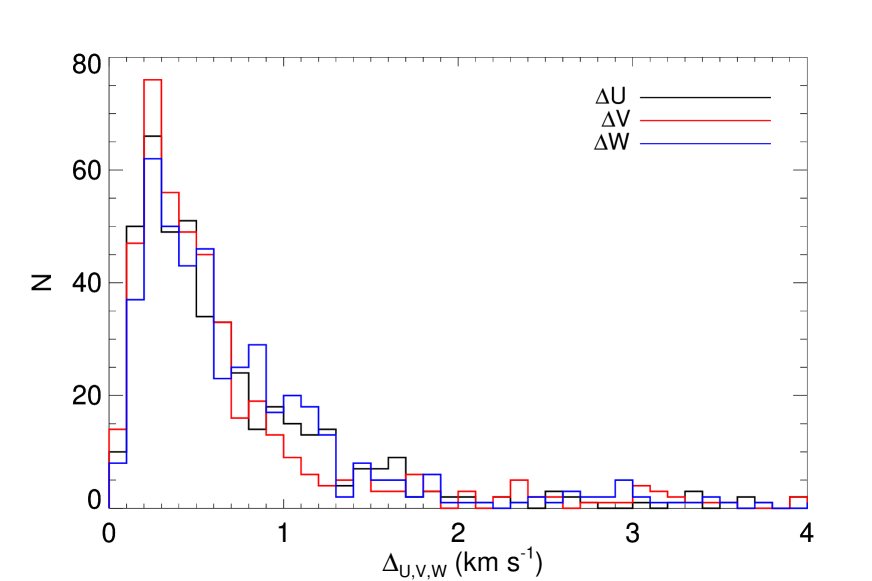
Velocities in a Cartesian Galactic system were obtained following the equations in Johnson & Soderblom (1987). That is, from the observed GCS radial velocities, and the Gaia DR1 proper motions and parallaxes, we derive the space velocity components (U, V, W). We adopt a right-handed Galactic system, where U is pointing towards the Galactic centre, V in the direction of rotation, and W towards the North Galactic Pole (NGP). The uncertainties in the velocity components U , V and W were derived also using the formalism introduced by Johnson & Soderblom (1987). The sources of uncertainties are the distances, the proper motions and the radial velocities where the errors of these measured quantities are uncorrelated, i.e., the covariances are zero. We illustrate in Figure 6 the random uncertainties distribution for the three stellar velocity components, i.e., U, V, W. The typical uncertainties for the space velocities in the stellar sample is just 0.4 km s-1.
4 The rotation-abundance relation
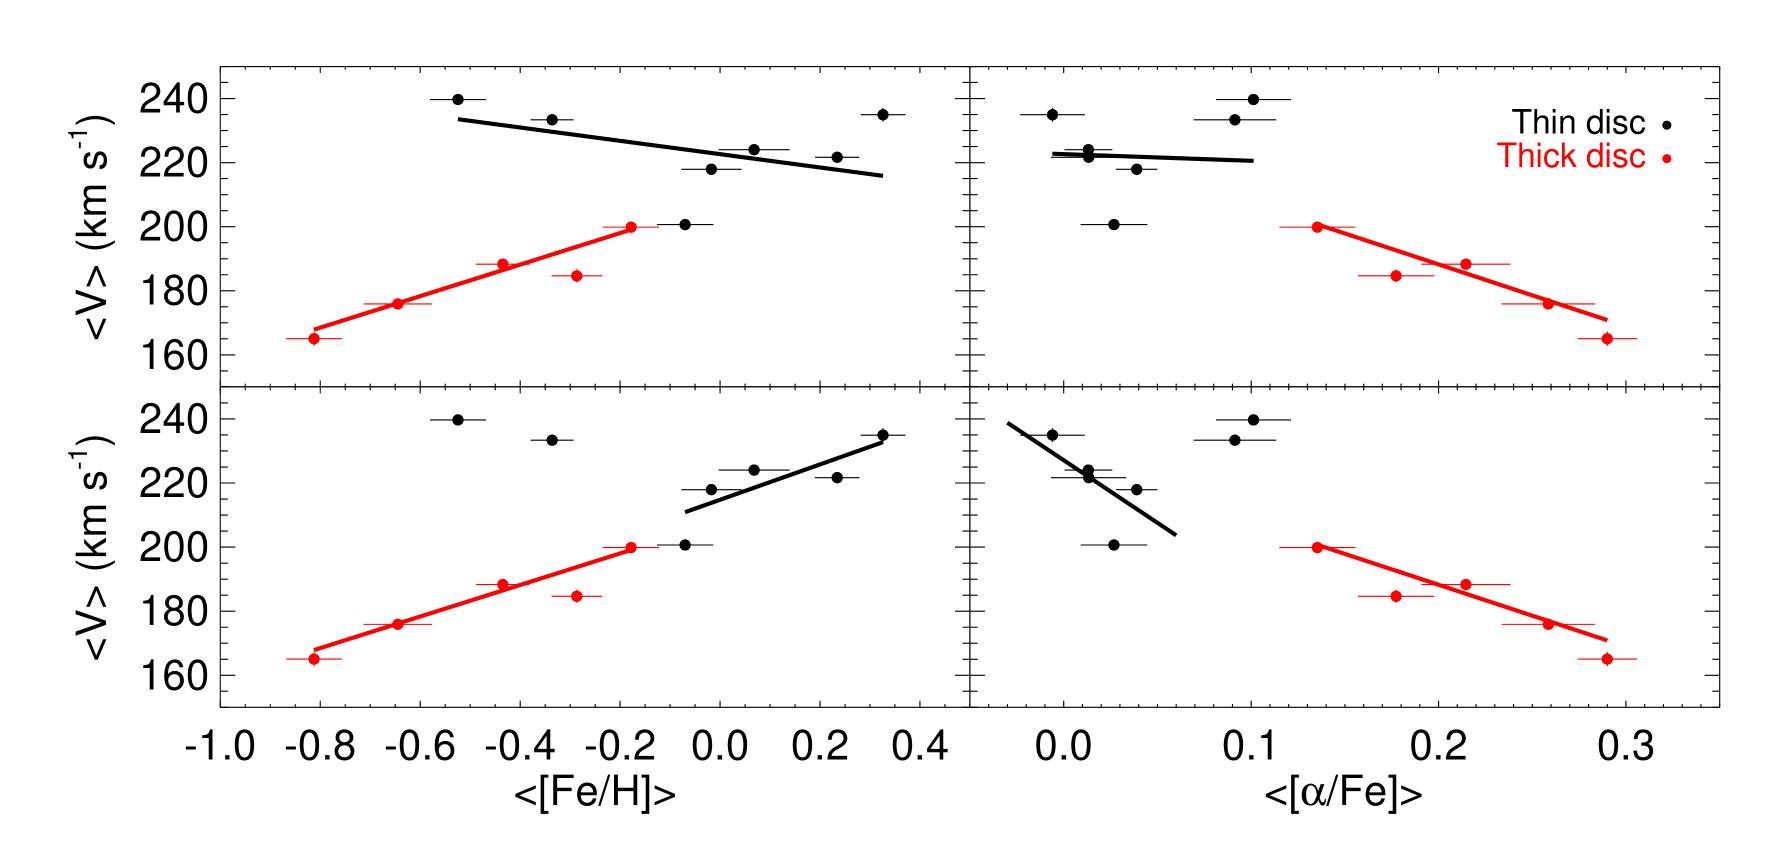
In this section we use the chemical groups to examine the correlations between the rotational velocity and the mean abundances of the groups. Figure 7 shows the relationship between the mean Galactic rotation111The LSR was assumed to be on a circular orbit, with circular velocity km s-1 (Reid et al., 2014). and [Fe/H] and [/Fe], respectively. We find a clear correlation between the V and the abundances for the thick disc groups (red points): the asymmetric drift increases as the groups get more metal-poor and more -enhance. However, for the thin disc any correlation is less clear. The top-left panel in Figure 7 shows the best linear fit (black line) in the V-[Fe/H] diagram using all seven thin disc groups. The trend shows an opposite sign for the thin and the thick disc, where more metal-poor thin disc stars have the smallest (near zero) asymmetric drift. This result is consistent with other studies addressing this problem, e.g., Lee et al. (2011), and Allende Prieto et al. (2016). Interestingly, there is a group with thin disc abundances (see Fig. 1 and Fig. 7) but that lies in the thick disc trend in V - [Fe/H]. However, the behaviour described above is less clear in the V-[/Fe] diagram for the thin disc groups, where there is no evident correlation between the velocity and the -elements.
We adopt an alternative view for the bottom panels of Figure 7. The most metal-poor chemical groups in the thin disc show a different trend with respect most of the groups (Fig. 7). When excluding them from the linear fit, we find a tight relation between the V and [Fe/H], where metal-poor groups lag behind with respect to the metal-rich ones, in the same manner as for the thick disc groups. A similar result is found in the V-[/Fe] diagram (bottom-right in Fig. 7). We discuss the implications of these results in Section 6.
5 The velocity ellipsoid
The kinematics of a stellar population can be described by its velocity dispersion tensor
| (2) |
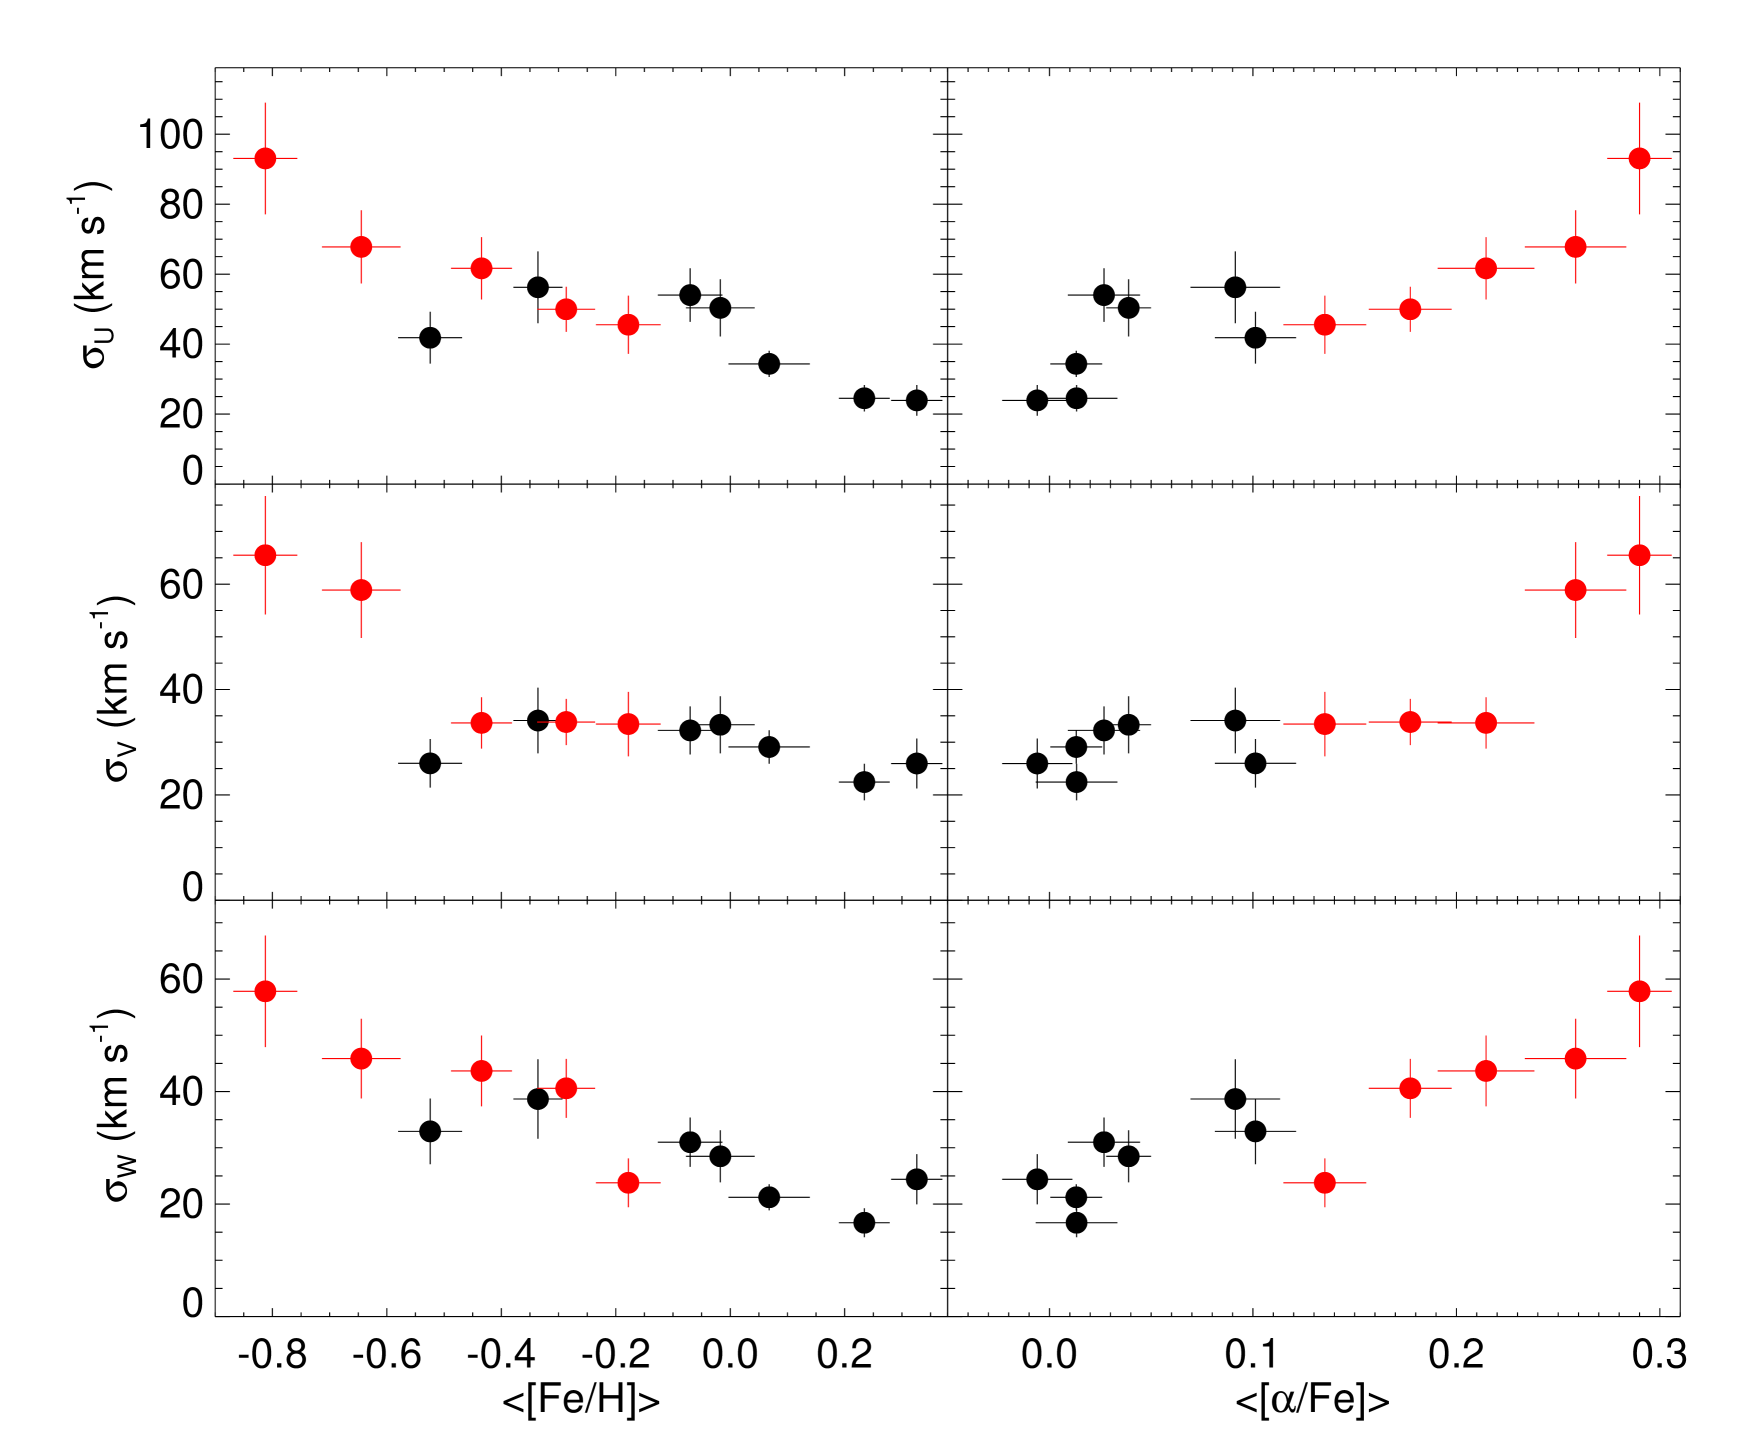
where the subscript indices denote one of the orthogonal coordinate directions and the angled brackets represent averaging over the phase-space distribution function (Binney & Tremaine, 2008; Smith et al., 2009). We represent the velocity dispersion (,,) of the twelve chemical groups as a function of [Fe/H] and [/Fe] in Figure 8. The error bars of the velocity dispersion were computed as
| (3) |
where is the number of stars in each chemical group (see Tab. 2). The error bars of the abundances are adopted as the standard deviations for each chemical group. In Fig. 8 the black dots represent chemically selected thin disc groups while red dots are thick disc groups (Sect. 2.2). Most of the thick Galactic disc population is kinematically hotter than that of the thin disc (Freeman, 2012; Bland-Hawthorn & Gerhard, 2016). We find that very metal-poor and -enhancement groups are typically hotter than their more metal-rich and low -enhancement counterparts though, not all of the chemically selected thick disc chemical groups are hotter than the thin disc ones.
| Thin disc | 33 4 km s-1 | 28 2 km s-1 | 23 2 km s-1 |
|---|---|---|---|
| Thick disc | 57 6 km s-1 | 38 5 km s-1 | 37 4 km s-1 |
For the radial velocity component we find that ranges from 25 to 50 km s-1 for the thin disc chemical groups. The radial velocity dispersion increases from [Fe/H] = +0.3 dex to [Fe/H] = -0.1 dex and then remains nearly constant from -0.1 to -0.5 dex (black dots in Fig. 8 top-left panel). Using a weighted mean where the weights are given by the combined error associated with the three components of the velocity, we obtain an average value for the thin disc groups of = 33 4 km s-1. In the case of the thick disc chemical groups (red dots in Fig. 8 top-left panel), ranges from 40 to 70 km s-1 and there is one group with [Fe/H] -0.85 dex and 95 km s-1, suggesting that some of these stars could be part of the Galactic halo. The average value for the thick disc groups is = 57 6 km s-1. We also plot as a function of [/Fe] (Fig. 8 top-right panel). The selected thin disc groups range from [/Fe] = -0.05 to +0.1 dex (black dots) while the thick disc groups range from +0.1 to +0.3 dex (red dots), following the selection criteria discussed in Section 2.2. For the thin disc clearly increases from -0.05 to +0.05 dex and then rises within the errors. The radial velocity dispersion for the thick disc chemical groups increases constantly from +0.1 to +0.3 dex.
The middle panels in Figure 8 represent as a function of [Fe/H] and [/Fe]. Interestingly, for the thin disc groups slightly increases from 20 to 30 km s-1 in the +0.3 dex to 0.0 dex metallicity range and 0.0 to +0.05 dex in [/Fe], and then remains nearly constant within the errors for the thin disc groups. We obtain an average value for the thin disc of = 28 2 km s-1. For the thick disc groups we also find that remains constant from -0.15 to -0.6 dex and from +0.1 to +0.2 dex for [/Fe], where 35 km s-1. For the two most metal-poor groups there is an abrupt increase of the velocity dispersion in the V component (red dots in Fig. 8 middle panel), reaching values of 60 km s-1. The average value for the thick disc groups is = 38 5 km s-1.
The bottom panels in Fig. 8 represent as a function of [Fe/H] and [/Fe]. The value of increases with decreasing metallicity from 15 to almost 30 km s-1 for the metal-rich groups in the thin disc while for the two metal-poor thin disc groups remains around 30 - 40 km s-1. We obtain an average value of = 23 2 km s-1 for the thin disc groups, ranging from 0.0 to 0.1 dex in [/Fe]. The vertical velocity dispersion for the thick disc groups clearly increases when [Fe/H] decreases and [/Fe] increases, ranging from 20 to 45 km s-1 while the most metal-poor group and -enhancement shows a 55 km s-1. The average value for all thick disc groups is = 37 4 km s-1.
| Thin disc | 0.70 0.13 | 0.64 0.08 |
|---|---|---|
| Thick disc | 0.67 0.11 | 0.66 0.11 |
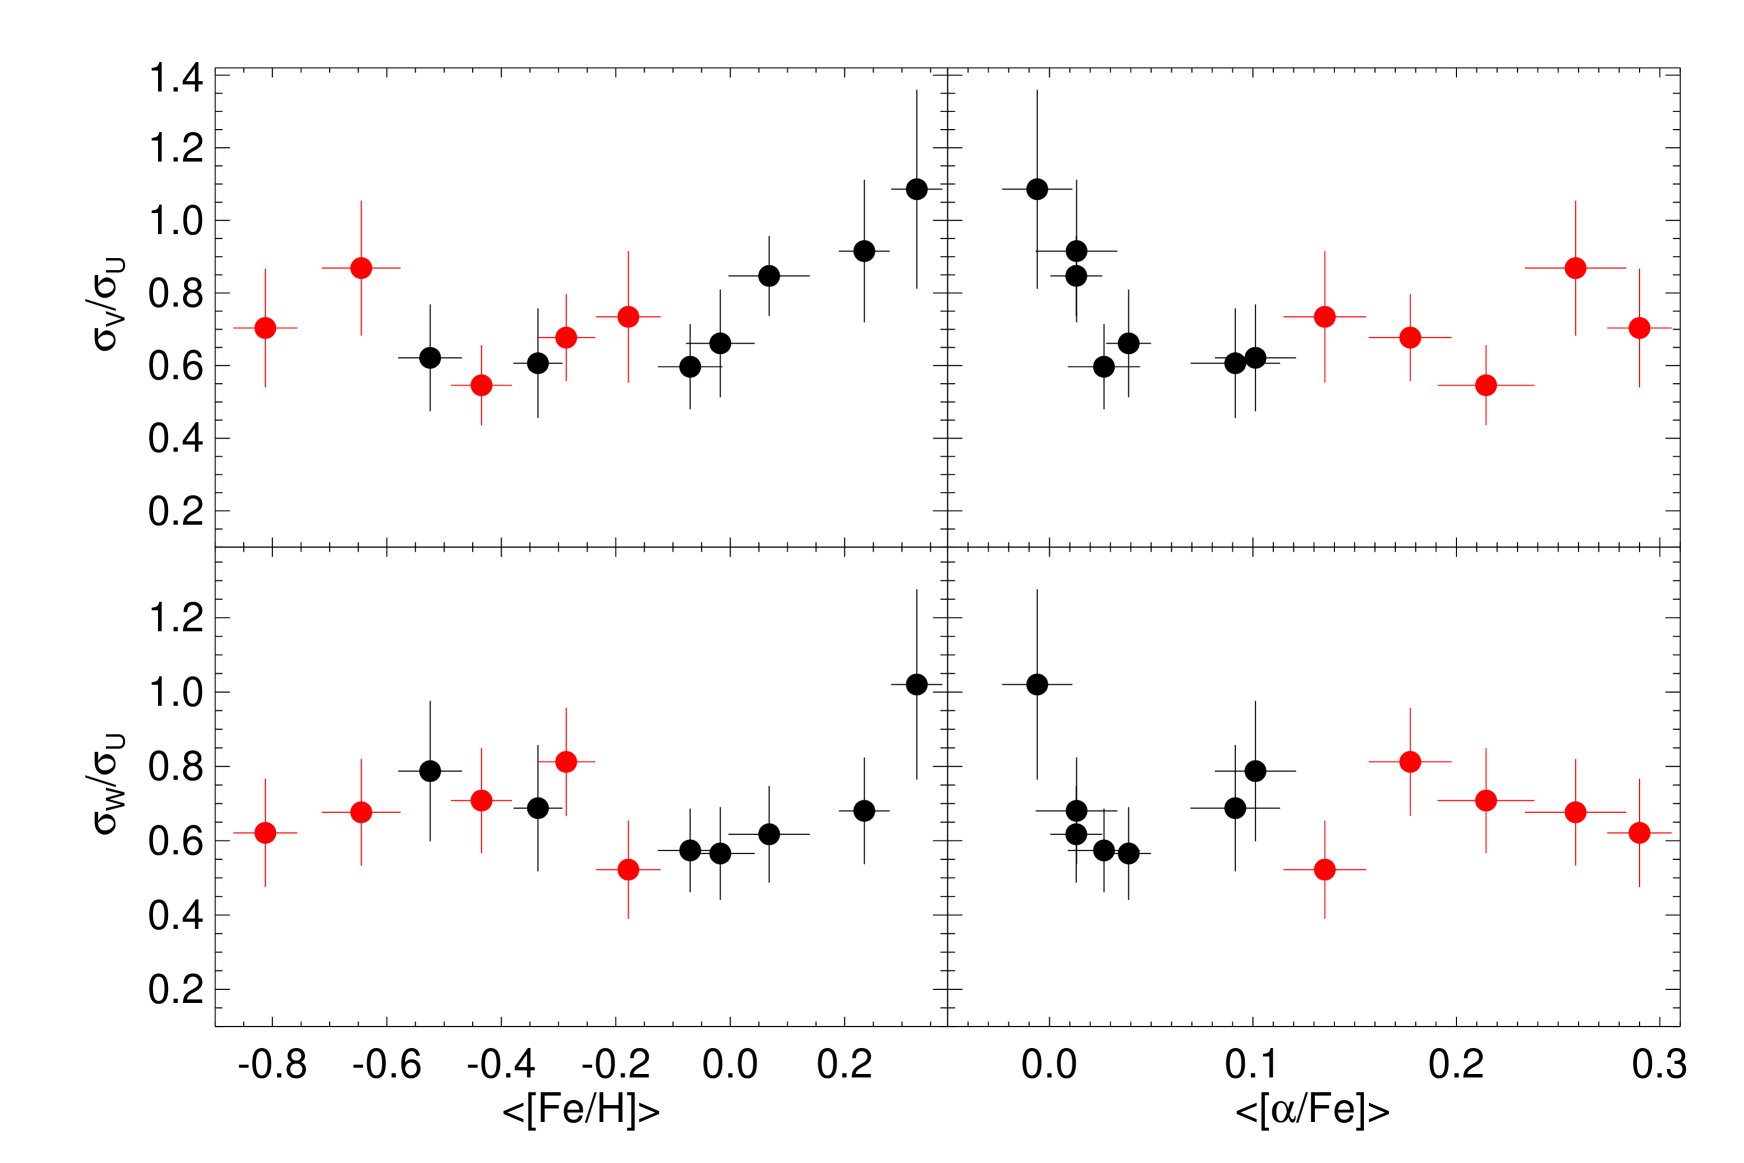
In Figure 9, we represent the value of the ratio between the semi-axes of the velocity ellipsoid, / and / versus [Fe/H] and [/Fe] for the selected thin and thick disc chemical groups. These ratios are related to secular heating processes (e.g., Aumer et al. 2016 and references therein). For the thin disc groups (black dots), there is a trend between / and [Fe/H] and [/Fe] ranging from 1.1 to 0.6, except for the groups with [Fe/H] –0.2 and [/Fe] 0.05 dex, where / 0.6. For the very metal-rich groups / is larger than for the rest of the thin disc chemical groups, however also the error bars are larger compared with the rest of the thin disc groups. The weighted average value for the thin disc is 0.70 0.13 while similar value is found for the thick disc, 0.65 0.13. We do not find any clear trend for the thick chemical groups between / and the mean abundances (red dots). We also find that / is nearly constant for the thin and thick disc groups with respect to the mean [Fe/H] and [/Fe] abundances (see bottom panels in Fig. 9). For the most metal-rich group where [Fe/H] and [/Fe] are +0.33 and -0.01 dex, respectively, we find that / = 1.0 0.2, while for the rest of the groups / is around 0.6. The average value for the thin disc chemical groups is 0.67 0.11 and for the thick disc groups / = 0.66 0.11, again a similar value for both discs. We summary these results in Table 3.

5.1 The linear Strömberg relation
| Reference | Source | V☉ (km s-1) |
|---|---|---|
| This work | Mitschang et al. (2014) | 13.9 3.4 |
| Sperauskas et al. (2016) | McCormick K-M dwarfs | 14.2 0.8 |
| Schönrich et al. (2010) | Hipparcos | 12.2 0.5 |
| Coşkunoǧlu et al. (2011) | RAVE DR3 | 13.4 0.4 |
| Bobylev & Bajkova (2010) | Masers | 11.0 1.7 |
| Breddels et al. (2010) | RAVE DR2 | 20.4 0.5 |
| Bobylev & Bajkova (2007) | F G stars | 6.2 2.2 |
| Piskunov et al. (2006) | Open clusters | 11.9 0.7 |
| Dehnen & Binney (1998) | Hipparcos | 5.2 0.6 |
| Delhaye (1965) | non-MS stars | 12.0 |
We make use of the Strömberg relation to estimate the component in the direction of Galactic rotation, V☉, of the Sun’s velocity with respect to the Local Standard of Rest (LSR) using a very local and pure thin disc sample. Theoretically, the mean velocity of a group of stars lags behind the circular velocity by an amount that is proportional to its radial velocity dispersion, in our case (Strömberg, 1946). Note that, as pointed out in Schönrich et al. (2010), applying the Strömberg relation to samples of stars binned in colour can be problematic. The linear approximation breaks down due to the metallicity gradient in the disc and hence the extrapolation to zero velocity dispersion becomes invalid. Although this affects some of the works presented in Table 4 (for example Dehnen & Binney 1998), our result should be robust as the stars are grouped according to chemistry rather than colour.
Following Golubov et al. (2013) and using the standard application of the non-linear equation for the asymmetric drift, Va, where the quadratic terms V2 and V☉2 are neglected, we can write the linear Strömberg relation as follow,
| (4) |
where –V = Vi, the mean rotational velocity for the chemical group. The slope depends on the radial scalelength and shape and orientation of the velocity dispersion ellipsoid of the subpopulations.
Using only the thin disc chemical groups (black dots in Fig. 10) and fitting a straight line taking into account the intrinsic dispersion in Vi uncertainties we determine a solar space velocity, V☉, with respect to the LSR of V☉ = 13.9 3.4 km s-1. This result is in good agreement with several recent studies (see Tab. 4) using different stellar populations, though several studies also have found a value close to 5 km s-1 (Dehnen & Binney, 1998; Bobylev & Bajkova, 2007; van Leeuwen, 2007). One reason for these discrepancies may arise from local kinematical substructure or any systematic streaming motion in the Sun’s vicinity (Williams et al., 2013). A local spiral arm density wave can lead to kinematical fluctuations (Siebert et al., 2012), and systematic streaming velocities may also exist in the local Galactic disk due to perturbations from the bar (Minchev et al., 2010; Antoja et al., 2014). These could cause deviations of the zero-dispersion LSR orbit from the average circular velocity at (Sharma et al., 2014; Bovy et al., 2015). We find that V for most of the thin disc range from 0 to 20 km s-1 (excluding one thin disc group with V 40 km s-1), while for the thick disc groups we have 40 V 75 km s-1, in good agreement with the mean rotational lag of 51 5 km s-1 for the thick disc reported in Soubiran et al. (2003) using around 900 red clump giants, and also in good agreement with the rotational lag range reported more recently in Allende Prieto et al. (2016) for the thick disc using Gaia DR1 and SDSS APOGEE.
| N | [Fe/H] (dex) | [/Fe] (dex) | luv (∘) | luw (∘) | ||||
|---|---|---|---|---|---|---|---|---|
| Thin disc | 41 | +0.07 0.07 | +0.01 0.01 | 0.85 0.11 | 0.62 0.13 | +35.88 7.83 | –10.92 7.60 | 0.45 0.15 |
| 25 | –0.07 0.06 | +0.03 0.02 | 0.59 0.12 | 0.57 0.11 | +14.23 4.77 | +7.12 2.36 | 0.66 0.11 | |
| 21 | +0.23 0.04 | +0.01 0.02 | 0.90 0.19 | 0.67 0.14 | +38.51 14.52 | +14.49 15.46 | 0.35 0.22 | |
| 19 | –0.02 0.06 | +0.04 0.01 | 0.65 0.15 | 0.56 0.12 | +11.21 8.69 | –2.40 3.16 | 0.62 0.14 | |
| 16 | –0.52 0.05 | +0.10 0.02 | 0.61 0.15 | 0.77 0.19 | –5.25 8.82 | +5.40 7.30 | 0.50 0.19 | |
| 15 | –0.34 0.04 | +0.09 0.02 | 0.59 0.15 | 0.67 0.17 | –0.75 3.89 | –6.69 7.31 | 0.58 0.17 | |
| 15 | +0.33 0.04 | –0.01 0.02 | 1.07 0.27 | 1.00 0.25 | –38.95 12.14 | –43.68 12.43 | –0.11 0.45 | |
| Thick disc | 30 | –0.29 0.05 | +0.18 0.02 | 0.67 0.12 | 0.80 0.14 | –16.61 6.44 | –6.80 10.12 | 0.44 0.16 |
| 24 | –0.43 0.05 | +0.21 0.02 | 0.54 0.11 | 0.70 0.14 | –10.97 5.27 | –15.16 8.61 | 0.60 0.13 | |
| 21 | –0.64 0.07 | +0.26 0.02 | 0.86 0.18 | 0.67 0.14 | –7.56 10.26 | –18.87 8.20 | 0.39 0.21 | |
| 17 | –0.81 0.05 | +0.29 0.01 | 0.69 0.16 | 0.61 0.14 | –18.77 8.76 | +1.26 1.98 | 0.56 0.16 | |
| 15 | –0.18 0.06 | +0.13 0.02 | 0.73 0.18 | 0.52 0.13 | +7.55 10.06 | –6.04 6.28 | 0.59 0.16 |
5.2 The vertex deviation and the tilt of the velocity ellipsoid
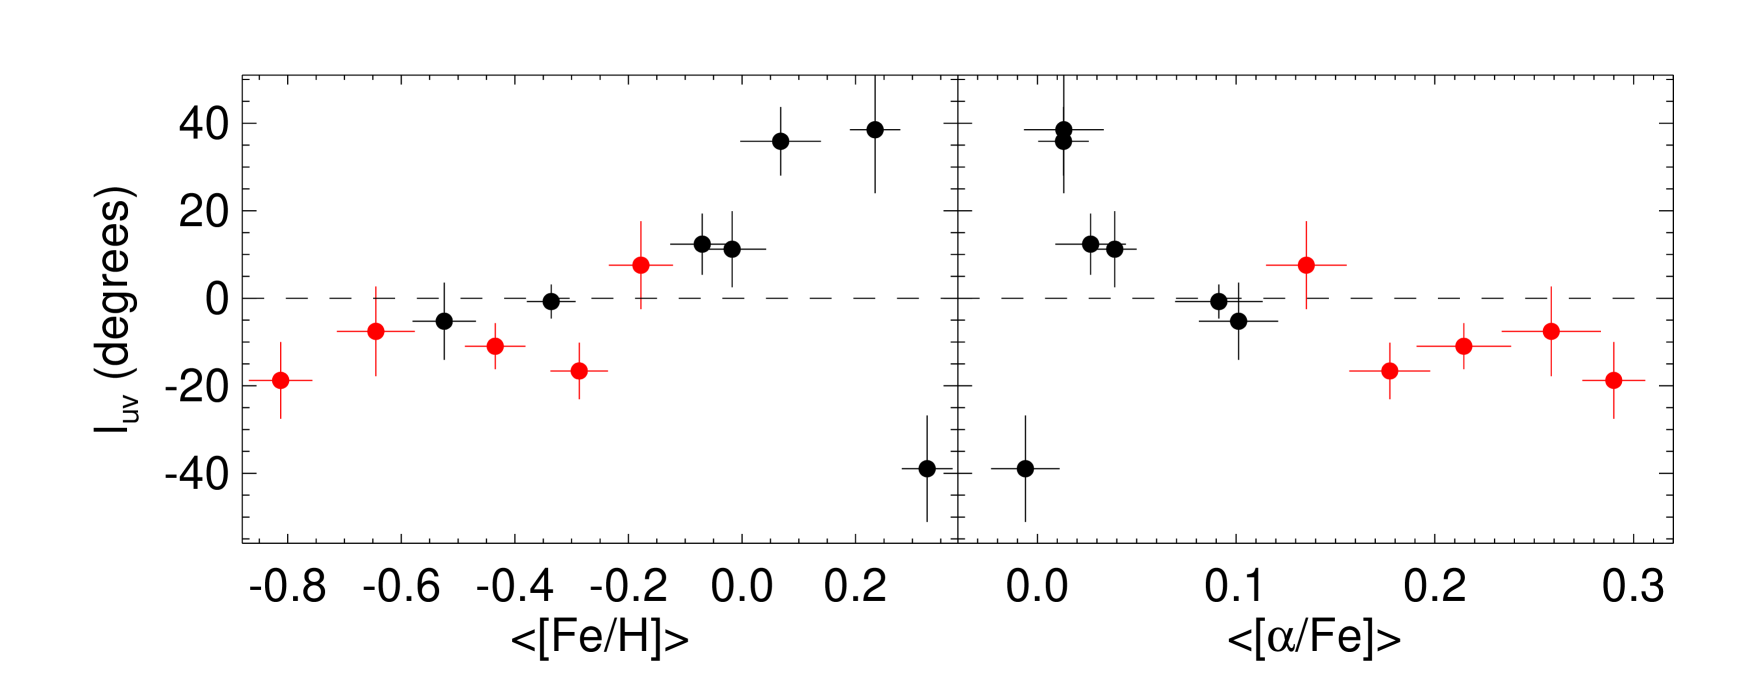
We can calculate the tilt angles of the mono-abundances groups velocity ellipsoid using Equation 1. In Figure 11 we show the vertex deviation (luv) in the - plane for the chemical groups as a function of [Fe/H] and [/Fe]. For the error propagation we use a Monte Carlo technique that takes into account the uncertainties in the velocity dispersion. We generate a distribution of 10,000 test particles around each input value of and assuming Gaussian errors with standard deviations given by the formal errors in the measurements, and then we calculate the resulting luv and their corresponding 1 associated uncertainties. For the thin disc we find a strong correlation between the vertex deviation and abundance (black dots in Fig. 11), except for the most metal-rich group: luv range from +40∘ for the metal-rich groups to -5∘ for the most metal-poor and -enhanced thin disc chemical group. Curiously, for the most metal-rich group, luv -40∘. The vertex deviation for most of the thick disc mono-abundances groups ([/Fe] 0.15 dex) is independent of the abundances (red dots in Fig. 11). For most of the thick disc groups, luv -15∘. There is only one thick disc group ([Fe/H] = -0.18, [/Fe] = +0.13 dex) that has luv 0.
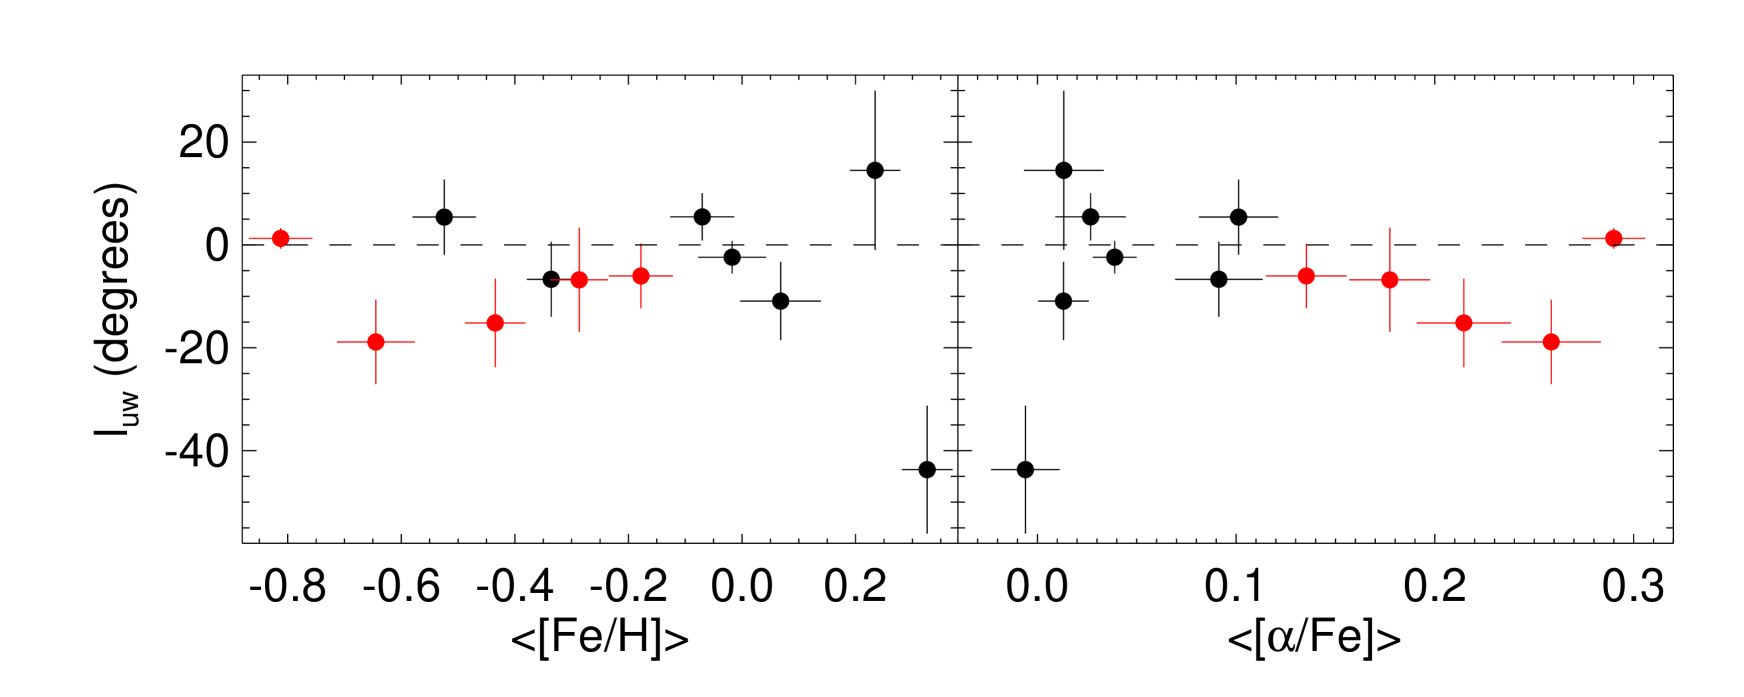
Figure 12 shows the tilt angle (luw) in the - plane for the groups. A positive value means the velocity ellipsoid is tilted towards the Galactic plane toward the Galactic centre. For the thin disc, luw ranges from -10 to +15∘, and there is no evident relation between luw and mean abundance. For the most metal-rich group the tilt angle is around -45∘. However, for the thick disc groups, we find a weak relation for luw as a function of iron abundance and -element abundances. The tilt angle decreases from -5 to -20∘ when [Fe/H] decreases and [/Fe] increases. The most metal-poor and -enhanced group does not follow the common trend for the thick disc, and has a value of luw +1 2∘. We summarize these results in Table 5.
5.3 The Galactic velocity anisotropy parameter
The velocity anisotropy parameter , defined as
| (5) |
was introduced by Binney (1980) to characterize the orbital structure of a system and is extensively used in spherical Jeans equation modeling to estimate the mass distribution of galactic systems (e.g., El-Badry et al. 2017 and references therein). By definition, = 0 corresponds to an isotropic velocity distribution ( = = ). If radial or circular orbits dominate (radial anisotropy), is positive (0 1) or negative (– 0).
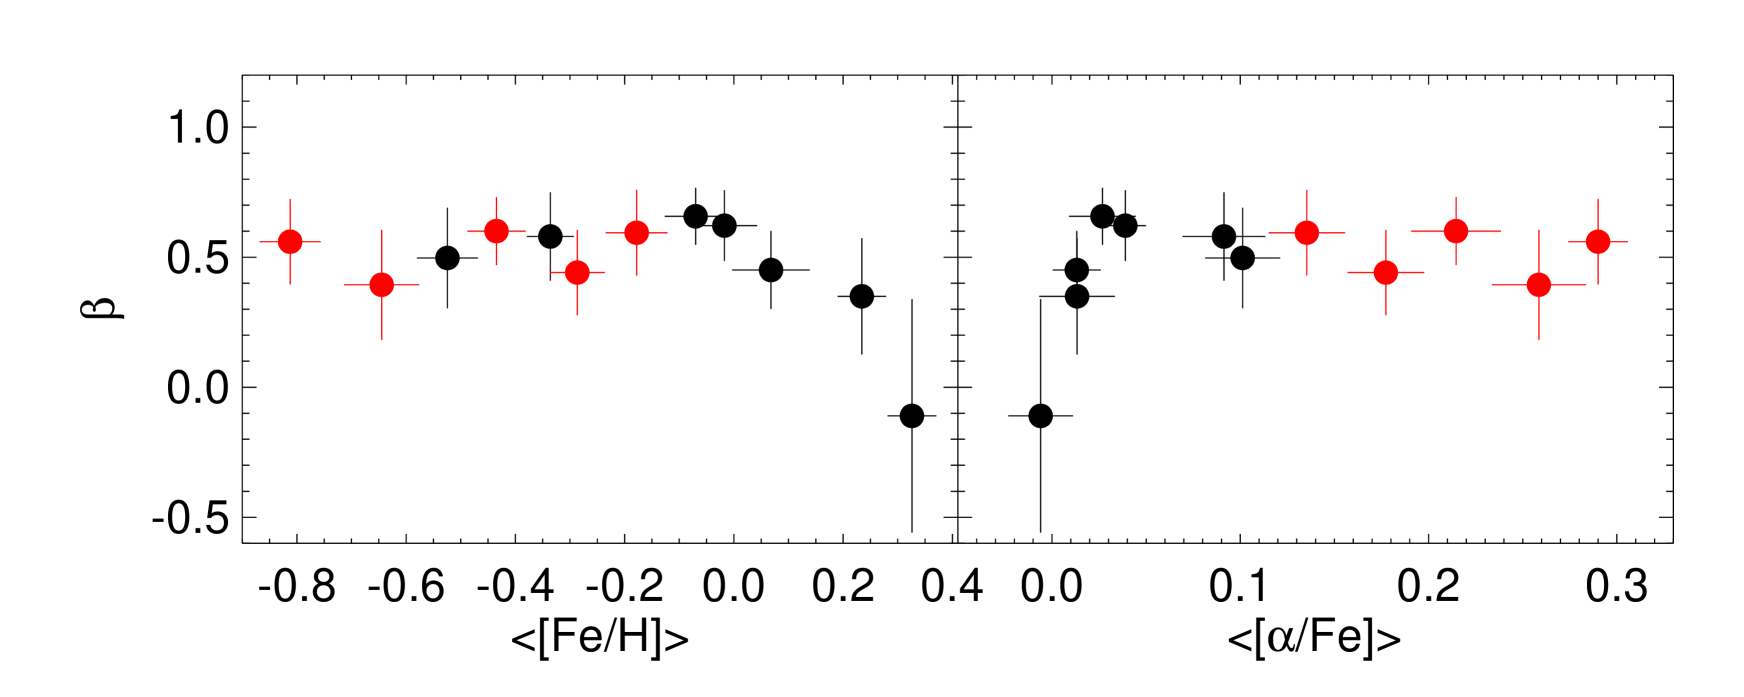
In Figure 13 we present as a function of [Fe/H] and [/Fe] for the 12 chemical groups analyzed in this work. We find that is independent of the abundances of the groups. For the thin and thick disc chemical groups, our results show 0.5, which suggests that the bulk of the stars in the immediate solar neighborhood are dynamically relaxed, where radial and circular orbits dominate independently of [Fe/H] and [/Fe]. We find for the most metal-rich group ([Fe/H] = +0.3 dex) a = –0.1, corresponding to an isotropic velocity distribution; however the error bar is large for this group (see Fig. 13 and Tab. 5).
6 Summary and Discussion
We have used the twelve most populated chemical groups identified in Mitschang et al. (2013, 2014), where very precise (uncertainties in [X/Fe] less than 0.05 dex) individual stellar abundances from Bensby et al. (2014), parallaxes and proper motions from Gaia DR1 (Gaia Collaboration et al., 2016) together with the radial velocities from CORAVEL (Nordström et al., 2004) were employed to explored the velocity ellipsoid and its tilt, and the vertex deviation, and velocity anisotropy as a function of stellar iron abundances and -elements. Typical uncertainties for the stellar space velocities are just 0.4 km s-1. As determined from the iron abundances with respect to [/Fe], our survey includes seven chemical groups associated with the thin Galactic disc, and five associated with the thick disc.
We use the chemical groups to examine the correlations between Galactic rotational velocity and mean abundance of the groups. Lee et al. (2011), using SDSS G-dwarfs and more recently Allende Prieto et al. (2016), combining APOGEE data with Gaia DR1, reported a statistical relationship showing opposite gradients signs for the thin and thick disc in the rotational velocity as a function of [Fe/H]. A possible explanation for the reverse gradient of rotational velocity is due to inwards radial migration of relatively metal-poor stars with low velocity dispersion and high angular momentum from the outer disc, and more metal-rich stars from the inner disc into the solar vicinity. The angular momentum exchange was only partial, hence their velocity dispersion is still low despite the migration (Lee et al., 2011). In Section 4 we look at the V-[Fe/H]-[/Fe] tends for the chemical groups (see Fig. 7). Using all the groups in the thin disc we are able to reproduce the results found in Lee et al. (2011), and Allende Prieto et al. (2016). However we find no correlation between V and [/Fe] for the thin disc. Moreover in the V - [Fe/H] diagram there is one thin disk group in the thick disk sequence, which lies about 20 km s-1 lower than the thin disk sequence at its [Fe/H]. How does this chemical group fit into the picture described above? We present an alternative scenario in the bottom-panels of Fig. 7. For the best linear fit in the thin disk, we excluded the most metal-poor groups —they clearly show a different trend with respect to most of the thin disk groups in the V-[Fe/H]-[/Fe] diagram—. In this picture the thin disc shows the asymmetric drift as a function of both abundances, [Fe/H] and [/Fe], where more metal-poor stars are lagging further behind. More mono-abundance chemical groups with precise kinematics are needed to address this problem specially groups in the metallicity range between -0.1 and -0.3 dex.
We find average velocity dispersion values for the three space velocity components for the thin and thick disc of (,,)thin = (33 4, 28 2, 23 2) and (,,)thick = (57 6, 38 5, 37 4) km s-1. The results found in this exercise for the mean velocity dispersion are similar within the errors to those from previous studies, e.g. Quillen & Garnett (2001), Soubiran et al. (2008), Pasetto et al. (2012) and Adibekyan et al. (2013). The very metal-poor and -enhancement groups are typically hotter than their more metal-rich and low -enhancement counterparts, though interestingly, not all the chemically selected thick disc chemical groups are hotter than the thin disc ones (see Fig. 8). For the component there is a clear plateau for the thin disc chemical groups with respect to the iron abundances and [/Fe]. For the most metal-poor (and high-[/Fe]) thick disc groups there is an abrupt increase of .
We also present a characterization of the velocity ellipsoid as a function of stellar iron abundance and -element enrichment. The ratio between the semi-axes of the velocity ellipsoid, / and / are related to the Oort constants and the scattering process responsible for the dynamical heating of the Milky Way disc, respectively. From our study we have found that the mean value of is 0.70 0.13, while is 0.64 0.08, whereas the result for is 0.67 0.11, and is 0.66 0.11. Thus, we do not find different ratios for the thin and thick disc groups. Our values are slightly higher than the results from Dehnen & Binney (1998), where they found / = 0.6 and / = 0.5 using Hipparcos data. But, using the RAVE survey, Veltz et al. (2008) found / = 0.9, while Soubiran et al. (2003) found / = 0.6 using only a data-set of red giants, and Vallenari et al. (2006) reported a value of 0.5 for the ratio where stellar populations toward the North Galactic Pole were employed. Moni Bidin et al. (2012) showed a mean value of / = 0.73 0.05 and / = 0.48 0.06, respectively. Smith et al. (2012) found a range of values for /, from 0.7 to 0.9 and from 0.55 to 0.85 for / as a function of using SDSS data. Simulations of the formation of the thick disc through heating via accretion predict a wide range of values from 0.4 to 0.9 for /, depending on satellite mass ratio and orbital inclination (Villalobos et al., 2010). The ratio / is predicted to lie around 0.5 and 0.6 depending of the shape of the rotation curve (Kuijken & Tremaine, 1991). Interestingly, the super-solar metallicity groups show larger / ratios than the more metal-poor thin disc groups, where these values go from 0.8 to 1.1, but where the uncertainties are also larger. In the / ratio, the most metal-rich group clearly has a larger derived value of 1.0 0.2 compared with the other groups (see Fig. 8 and Tab. 5). Finally, for the thin disc groups there is a trend between / and [Fe/H] and [/Fe] ranging from 1.1 to 0.6, except for the groups with [Fe/H] –0.2 and [/Fe] 0.05 dex, where / 0.6. For the thick disc groups we do not see any clear trend between / as a function of iron-abundance and -element abundances. We find / nearly independent of groups abundance.
Using only the thin disc chemical groups and making use of the Strömberg relation, we determined the expected velocity component in the direction of Galactic rotation of the Sun’s velocity with respect to the Local Standard of Rest (LSR). Our result, V☉ = 13.9 3.4 km s-1, is in good agreement with several recent studies (see Tab. 4).
We also explore the orientation of the velocity ellipsoid. The orientation of a dynamically relaxed population is related to the Galactic potential shape, and the vertex deviation can indicate the presence of non-axisymmetric structures in the disc. For the thin disc we find a trend between the vertex deviation and abundances (except for the most metal-rich group), ranging from +40∘ for the metal-rich groups to -5∘ for the metal-poor thin disc. The vertex deviation for the thick disc mono-abundances groups is independent of abundance, with a value of luv -15∘. Substructure observed in the velocity space might be responsible for the vertex deviation, however it is not totally clear that moving groups are entirely responsible for the non-zero values of luv. Additional causes of the vertex deviation could be the non-axisymmetric component of the Galactic potential and the spiral field (Famaey et al., 2005; Siebert et al., 2008). Why do for most of the thick disc groups we find a nearly constant vertex deviation? Significant overdensities in the velocity distributions are reported beyond the solar circle; for example, Antoja et al. (2012) found that local kinematical groups are large-scale features, surviving at least up to 1 kpc from the Sun at different heights from the Galactic plane. Some of these trends are consistent with dynamical models of the effects of the bar and the spiral arms; however, in this study we find a nearly constant vertex deviation for the Galactic thick disc despite the fact a significant variation may be expected from the non-axisymmetric components associated with the thick disc.
The tilt angle (luw) in the - plane for the thin disc groups range from -10 to +15∘, and there is no evident correlation between luw and the mean abundances. Furthermore we find a weak trend of luw as a function of iron abundance and -element abundances for most of the groups in the thick disc, where the tilt angle decreases from -5 to -20∘ when [Fe/H] decreases and [/Fe] increases. Also, the tilt of the most metal-rich group seems to deviate from the common trend, as observed for the vertex deviation. The tilt of the velocity ellipsoid is a good indicator of the buckling instability of a stellar bar in a disk galaxy (Saha et al., 2013). This may suggest that this group could be an overlap of spiral and bar resonances in the Milky way disc (Minchev & Famaey, 2010). The velocity anisotropy parameter, , is independent of the chemical group abundances and its value is nearly constant for both discs, with a mean value of 0.5, which suggests that the disc is dynamically relaxed. The most metal-rich group has 0, corresponding to an isotropic velocity distribution, but the uncertainties here are large.
In this work we use a small sample with very precise stellar abundances and kinematics, however the APOGEE and APOGEE-2 surveys (Majewski et al., 2017) have accurate individual abundances for more than 300,000 stars in both celestial hemisphere covering a much larger volume than the present study. The GALAH survey (De Silva et al., 2015) has already observed more than half million stars in the South with high-resolution and high signal-to-noise ratio. Combined with astrometry from Gaia, these samples are very promising data-sets to explore in great detail though mono-abundances groups via chemical tagging the kinematical properties of the Galactic disc. Such work is underway, and will be the subject of future contributions.
Acknowledgments
The authors thank the referee for comments that helped improve the paper. BA thanks Hanna Lewis, Chris Hayes, Nick Troup and Robert Wilson (University of Virginia) for lively discussions on the manuscript. BA and SRM acknowledge support from National Science Foundation grant AST-1616636.
References
- Adibekyan et al. (2013) Adibekyan, V. Z., Figueira, P., Santos, N. C., et al. 2013, A&A, 554, A44
- Allende Prieto et al. (2016) Allende Prieto, C., Kawata, D., & Cropper, M. 2016, A&A, 596, A98
- Amendt & Cuddeford (1991) Amendt, P., & Cuddeford, P. 1991, ApJ, 368, 79
- Antoja et al. (2012) Antoja, T., Helmi, A., Bienayme, O., et al. 2012, MNRAS, 426, L1
- Antoja et al. (2014) Antoja, T., Helmi, A., Dehnen, W., et al. 2014, A&A, 563, A60
- Aumer et al. (2016) Aumer, M., Binney, J., & Schönrich, R. 2016, MNRAS, 462, 1697
- Bensby et al. (2014) Bensby, T., Feltzing, S., & Oey, M. S. 2014, A&A, 562, A71
- Binney (1980) Binney, J. 1980, MNRAS, 190, 873
- Binney & Tremaine (2008) Binney, J., & Tremaine, S. 2008, Galactic Dynamics: Second Edition, by James Binney and Scott Tremaine. ISBN 978-0-691-13026-2 (HB). Published by Princeton University Press, Princeton, NJ USA, 2008.,
- Blanco-Cuaresma et al. (2015) Blanco-Cuaresma, S., Soubiran, C., Heiter, U., et al. 2015, A&A, 577, A47
- Bland-Hawthorn & Gerhard (2016) Bland-Hawthorn, J., & Gerhard, O. 2016, Annual Review of Astronomy and Astrophysics, 54, 529
- Bovy et al. (2015) Bovy, J., Bird, J. C., García Pérez, A. E., et al. 2015, ApJ, 800, 83
- Bobylev & Bajkova (2007) Bobylev, V. V., & Bajkova, A. T. 2007, Astronomy Reports, 51, 372
- Bobylev & Bajkova (2010) Bobylev, V. V., & Bajkova, A. T. 2010, MNRAS, 408, 1788
- Breddels et al. (2010) Breddels, M. A., Smith, M. C., Helmi, A., et al. 2010, A&A, 511, A90
- Brown (2017) Brown, A. G. A. 2017, arXiv:1709.01216
- Büdenbender et al. (2015) Büdenbender, A., van de Ven, G., & Watkins, L. L. 2015, MNRAS, 452, 956
- Carollo et al. (2010) Carollo, D., Beers, T. C., Chiba, M., et al. 2010, ApJ, 712, 692
- Casetti-Dinescu et al. (2011) Casetti-Dinescu, D. I., Girard, T. M., Korchagin, V. I., & van Altena, W. F. 2011, ApJ, 728, 7
- Chiappini et al. (1997) Chiappini, C., Matteucci, F., & Gratton, R. 1997, ApJ, 477, 765
- Coşkunoǧlu et al. (2011) Coşkunoǧlu, B., Ak, S., Bilir, S., et al. 2011, MNRAS, 412, 1237
- Dehnen & Binney (1998) Dehnen, W., & Binney, J. J. 1998, MNRAS, 298, 387
- Dehnen (2000) Dehnen, W. 2000, AJ, 119, 800
- Delhaye (1965) Delhaye, J. 1965, Giornale di Astronomia, 61
- De Silva et al. (2007) De Silva, G. M., Freeman, K. C., Asplund, M., et al. 2007, AJ, 133, 1161
- De Silva et al. (2015) De Silva, G. M., Freeman, K. C., Bland-Hawthorn, J., et al. 2015, MNRAS, 449, 2604
- El-Badry et al. (2017) El-Badry, K., Wetzel, A. R., Geha, M., et al. 2017, ApJ, 835, 193
- Famaey et al. (2005) Famaey, B., Jorissen, A., Luri, X., et al. 2005, A&A, 430, 165
- Freeman & Bland-Hawthorn (2002) Freeman, K., & Bland-Hawthorn, J. 2002, Annual Review of Astronomy and Astrophysics, 40, 487
- Freeman (2012) Freeman, K. 2012, Astrophysics and Space Science Proceedings, 26, 137
- Fuhrmann (2011) Fuhrmann, K. 2011, MNRAS, 414, 2893
- Gaia Collaboration et al. (2016) Gaia Collaboration, Brown, A. G. A., Vallenari, A., et al. 2016, A&A, 595, A2
- Golubov et al. (2013) Golubov, O., Just, A., Bienaymé, O., et al. 2013, A&A, 557, A92
- Hayden et al. (2015) Hayden, M. R., Bovy, J., Holtzman, J. A., et al. 2015, ApJ, 808, 132
- Hogg et al. (2016) Hogg, D. W., Casey, A. R., Ness, M., et al. 2016, ApJ, 833, 262
- Johnson & Soderblom (1987) Johnson, D. R. H., & Soderblom, D. R. 1987, AJ, 93, 864
- Kuijken & Gilmore (1991) Kuijken, K., & Gilmore, G. 1991, ApJ, 367, L9
- Kuijken & Tremaine (1991) Kuijken, K., & Tremaine, S. 1991, Dynamics of Disc Galaxies, 71
- Lee et al. (2011) Lee, Y. S., Beers, T. C., An, D., et al. 2011, ApJ, 738, 187
- Lindegren et al. (2016) Lindegren, L., Lammers, U., Bastian, U., et al. 2016, A&A, 595, A4
- Majewski et al. (2017) Majewski, S. R., Schiavon, R. P., Frinchaboy, P. M., et al. 2017, AJ, 154, 94
- Masseron & Gilmore (2015) Masseron, T., & Gilmore, G. 2015, MNRAS, 453, 1855
- Minchev & Famaey (2010) Minchev, I., & Famaey, B. 2010, ApJ, 722, 112
- Minchev et al. (2010) Minchev, I., Boily, C., Siebert, A., & Bienayme, O. 2010, MNRAS, 407, 2122
- Minchev et al. (2014) Minchev, I., Chiappini, C., Martig, M., et al. 2014, ApJ, 781, L20
- Mitschang et al. (2013) Mitschang, A. W., De Silva, G., Sharma, S., & Zucker, D. B. 2013, MNRAS, 428, 2321
- Mitschang et al. (2014) Mitschang, A. W., De Silva, G., Zucker, D. B., et al. 2014, MNRAS, 438, 2753
- Moni Bidin et al. (2012) Moni Bidin, C., Carraro, G., & Méndez, R. A. 2012, ApJ, 747, 101
- Navarro et al. (2011) Navarro, J. F., Abadi, M. G., Venn, K. A., Freeman, K. C., & Anguiano, B. 2011, MNRAS, 412, 1203
- Ness et al. (2017) Ness, M., Rix, H., Hogg, D. W., et al. 2017, arXiv:1701.07829
- Nidever et al. (2014) Nidever, D. L., Bovy, J., Bird, J. C., et al. 2014, ApJ, 796, 38
- Nordström et al. (2004) Nordström, B., Mayor, M., Andersen, J., et al. 2004, A&A, 418, 989
- Pasetto et al. (2012) Pasetto, S., Grebel, E. K., Zwitter, T., et al. 2012, A&A, 547, A70
- Piskunov et al. (2006) Piskunov, A. E., Kharchenko, N. V., Röser, S., Schilbach, E., & Scholz, R.-D. 2006, A&A, 445, 545
- Quillen & Garnett (2001) Quillen, A. C., & Garnett, D. R. 2001, Galaxy Disks and Disk Galaxies, 230, 87
- Quillen et al. (2015) Quillen, A. C., Anguiano, B., De Silva, G., et al. 2015, MNRAS, 450, 2354
- Reid & Brunthaler (2005) Reid, M. J., & Brunthaler, A. 2005, Future Directions in High Resolution Astronomy, 340, 253
- Reid et al. (2014) Reid, M. J., Menten, K. M., Brunthaler, A., et al. 2014, ApJ, 783, 130
- Saha et al. (2013) Saha, K., Pfenniger, D., & Taam, R. E. 2013, ApJ, 764, 123
- Sharma et al. (2014) Sharma, S., Bland-Hawthorn, J., Binney, J., et al. 2014, ApJ, 793, 51
- Schönrich et al. (2010) Schönrich, R., Binney, J., & Dehnen, W. 2010, MNRAS, 403, 1829
- Siebert et al. (2008) Siebert, A., Bienaymé, O., Binney, J., et al. 2008, MNRAS, 391, 793
- Siebert et al. (2012) Siebert, A., Famaey, B., Binney, J., et al. 2012, MNRAS, 425, 2335
- Smith et al. (2009) Smith, M. C., Wyn Evans, N., & An, J. H. 2009, ApJ, 698, 1110
- Smith et al. (2012) Smith, M. C., Whiteoak, S. H., & Evans, N. W. 2012, ApJ, 746, 181
- Soubiran et al. (2003) Soubiran, C., Bienaymé, O., & Siebert, A. 2003, A&A, 398, 141
- Soubiran et al. (2008) Soubiran, C., Bienaymé, O., Mishenina, T. V., & Kovtyukh, V. V. 2008, A&A, 480, 91
- Sperauskas et al. (2016) Sperauskas, J., Bartašiūtė, S., Boyle, R. P., et al. 2016, A&A, 596, A116
- Strömberg (1946) Strömberg, G. 1946, ApJ, 104, 12
- Ting et al. (2012) Ting, Y.-S., Freeman, K. C., Kobayashi, C., De Silva, G. M., & Bland-Hawthorn, J. 2012, MNRAS, 421, 1231
- Vallenari et al. (2006) Vallenari, A., Pasetto, S., Bertelli, G., et al. 2006, A&A, 451, 125
- van Leeuwen (2007) van Leeuwen, F. 2007, A&A, 474, 653
- Veltz et al. (2008) Veltz, L., Bienaymé, O., Freeman, K. C., et al. 2008, A&A, 480, 753
- Villalobos et al. (2010) Villalobos, Á., Kazantzidis, S., & Helmi, A. 2010, ApJ, 718, 314
- Vorobyov & Theis (2008) Vorobyov, E. I., & Theis, C. 2008, MNRAS, 383, 817
- Williams et al. (2013) Williams, M. E. K., Steinmetz, M., Binney, J., et al. 2013, MNRAS, 436, 101