\ShortTitleCharged kaon femtoscopic correlations \ShortAuthorXIIth edition of WPCF
Particle correlations at small relative momenta can be used to measure the space–time characteristics of particle production on the femtoscopic (fm=10-15 m) level in high-energy collisions. Such correlations arise due to quantum statistics and final state interactions. We report correlations of two charged identical kaons measured in p–Pb collisions at TeV by the ALICE experiment at the LHC. The femtoscopic invariant radii and correlation strengths are extracted from the one-dimensional kaon correlation functions and are compared to those obtained in pp and Pb–Pb collisions at TeV and TeV, respectively. Kaon femtoscopy in p–Pb collisions is an important supplement to that in pp and Pb–Pb collisions because it allows one to understand the particle production mechanisms in different collision systems. It also complements the existing pion correlation results. The obtained radii increase with increasing multiplicity and decrease with increasing pair transverse momentum. At comparable multiplicity, the radii measured in p–Pb collisions are close to those observed in pp collisions, whereas it is difficult to compare them with the results from Pb–Pb collisions because of a big multiplicity gap.
1 Introduction
The Bose–Einstein enhancement of the production of two identical pions at low relative momenta was first observed in p collisions about 50 years ago [1]. Since that time the correlation method has been developed and now it is known as “correlation femtoscopy” [2, 3]. Femtoscopy measures the apparent width of the distribution of the relative separation of emission points, which is conventionally called the “radius parameter”. The method was successfully applied to the measurement of the space–time characteristics of particle production processes at high energies in particle [4, 5] and heavy-ion collisions (see, e.g., [6, 7] and references therein).
The ALICE collaboration has already studied pion correlations in p–Pb collisions at TeV [8]. Extensive ALICE PID capabilities [9] and availability of a large amount of experimental data allow performing the K±K± femtoscopic analysis in p–Pb collisions at the same energy, which is the aim of this work. Kaons are a convenient tool to study, in particular, Bose–Einstein correlations. They are less influenced by resonance decays than pions and therefore more effectively probe femtoscopic correlations of directly-produced particles. The comparison of kaon and pion correlation radii [8, 12] depending on pair transverse momentum or transverse mass , where is a correlating particle mass, allows one to understand collective dynamics (collective flow) of a source created in collisions. In addition, the kaon radii in p–Pb collisions at TeV are compared with those in pp and Pb–Pb collisions at TeV [13] and TeV [16], respectively. It provides experimental constraints on the validity of hydrodynamic [14] and/or color glass condensate [15] approaches proposed for interpretation of the p–Pb data. In heavy-ion collisions, the decrease of the correlation radii with increasing () was usually considered as a manifestation of collective behavior of matter created in such collisions. If the dependence of the interferometry radii on pair momentum in p–Pb collisions follows the trends seen in heavy-ion collisions, it would be an indication of collectivity [14].
2 Analysis
The data sample used in the analysis was recorded with the ALICE detector [9] in 2013 at a center-of-mass energy per nucleon of TeV. The analysis was performed in three multiplicity bins: 0–20%, 20–40%, 40–90% and two pair transverse momentum bins: (0.2–0.5), (0.5–1.0) GeV/. The multiplicity classes are determined [10] with the V0 detector [11]. The identification of kaons was performed using the Time Projection Chamber (TPC) detector for all particle momenta and the Time-Of-Flight (TOF) detector – for GeV/. To ensure uniform tracking, events with the collision vertex position within 10 cm from the center of TPC, measured along the beam axis , are selected. At least one particle in the event has to be reconstructed and identified as a charged kaon. The correlation signal is constructed from events having at least two same-charged kaons. The one-kaon events contribute to the background determination. The charged tracks used in this analysis are required to have a transverse momentum 0.141.5 GeV/ and a pseudorapidity 0.8. Usually the femtoscopic correlation functions (CF) of identical particles are very sensitive to the two-track reconstruction effects because the considered particles have close momenta and close trajectories. Two kinds of two-track effects were investigated. The track “splitting” occurs when one track is mistakenly reconstructed as two. The “merging” is the effect when two different tracks are reconstructed as one. To decrease the influence of these effects two-track cuts are applied on the pseudorapidity and the modified azimuthal angle that takes into account the bending inside the barrel magnetic field and is measured at the radial distance of 1.6 m.
The two-particle correlation function is defined as a ratio of the two-particle distribution in the given event to the reference one [17]. Here the reference distribution is constructed by mixing particles from different events of a given class.
The correlation function is measured as a function of the invariant pair relative momentum , where and are determined by the energy components , and momenta , of particles, respectively. The CFs can be parametrized by various formulae depending on the origin of correlations between considered particles. Identical charged kaons correlations are induced by quantum statistics and Coulomb interaction effects. Strong final-state interactions between kaons are negligible [18]. Assuming a Gaussian distribution of a particle source in the pair rest frame, the fitting of the kaon CF is performed using the Bowler–Sinyukov formula [19, 20]
| (1) |
The factor describes the Coulomb interaction, parametrizes the baseline including all non-femtoscopic effects, for instance resonance decays, is a normalization. The Coulomb interaction is determined as
| (2) |
where is a theoretical CF calculated with pure quantum statistic (QS) weights (wave function squared) and corresponds to quantum statistic + Coulomb weights [19, 21]. The parameters and describe the size of the source and the correlation strength, respectively.
3 Results
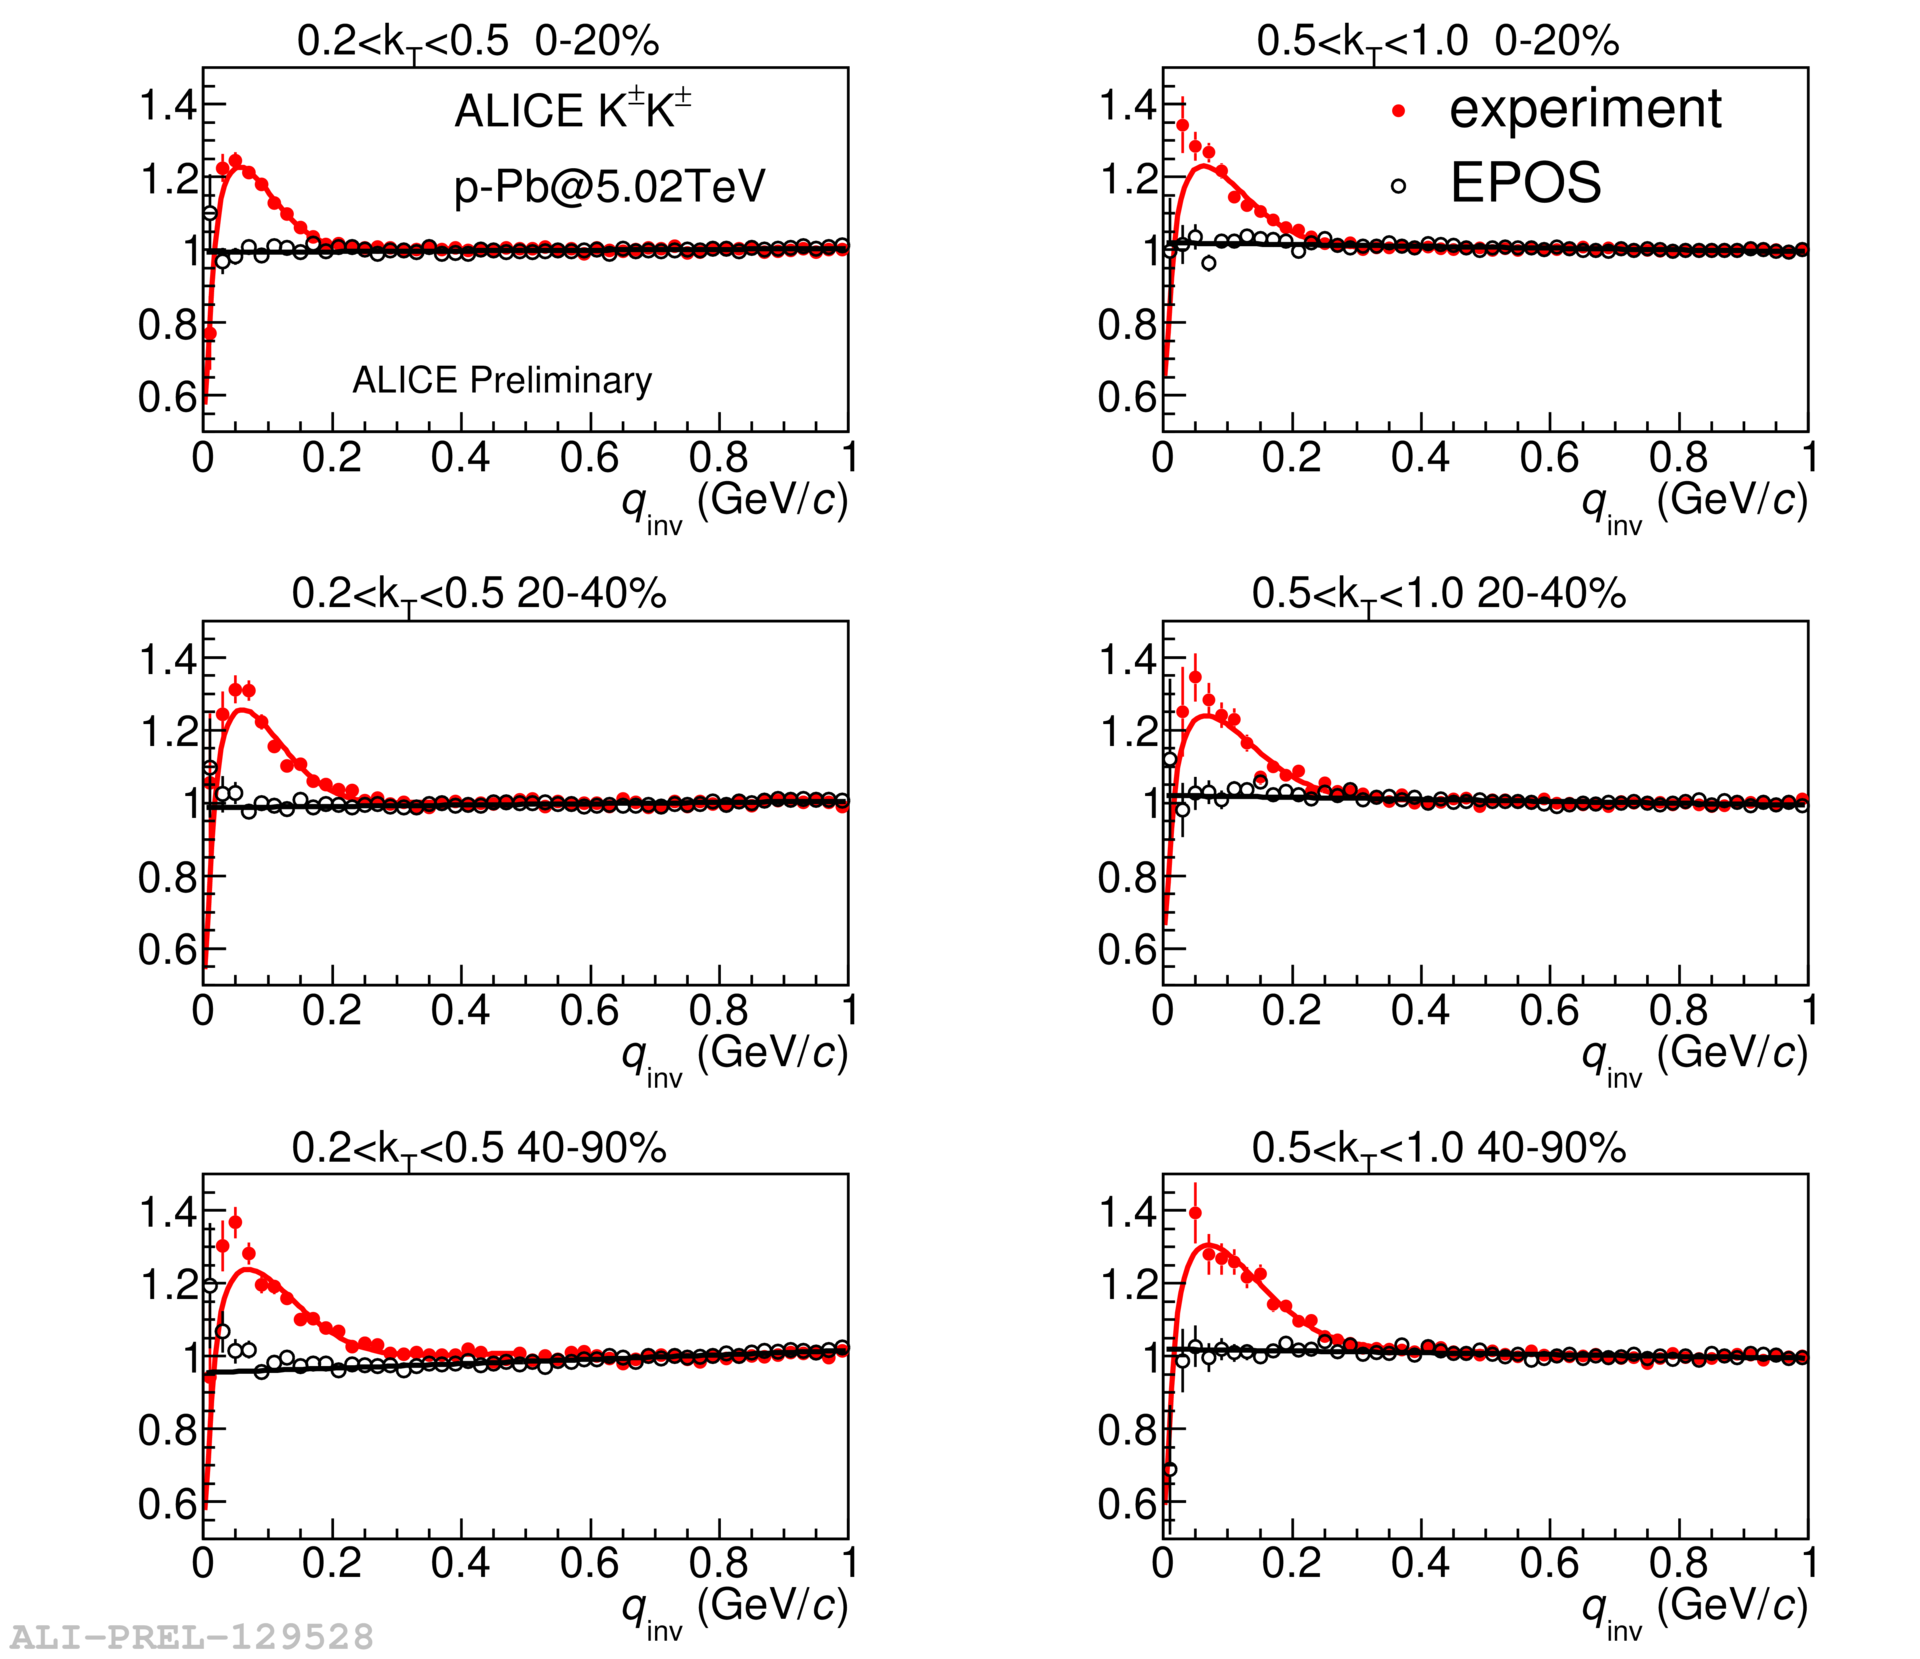
The parameters and can be extracted from (1) using various assumptions to handle the effects of the baseline . In this work, the EPOS model [22] without femtoscopic effects included is used to describe the baseline . First, since it is a realistic model, which reproduces all major results of existing accelerator data [23], and, second, since it gives the best description of kaon spectra [24]. Fitting the EPOS baseline by a first-order polynomial in GeV/ and then the experimental CF by (1) in GeV/, one can extract the femtoscopic characteristics. The Coulomb interaction radius is set to fm, which is on average close to the extracted radii values. The result is shown in Fig. 1. The CFs are normalized to unity in the GeV/ range. As it is seen from the figure, EPOS describes the experimental data outside the femto peak. The experimental CF is flat outside the peak as well as the EPOS function.
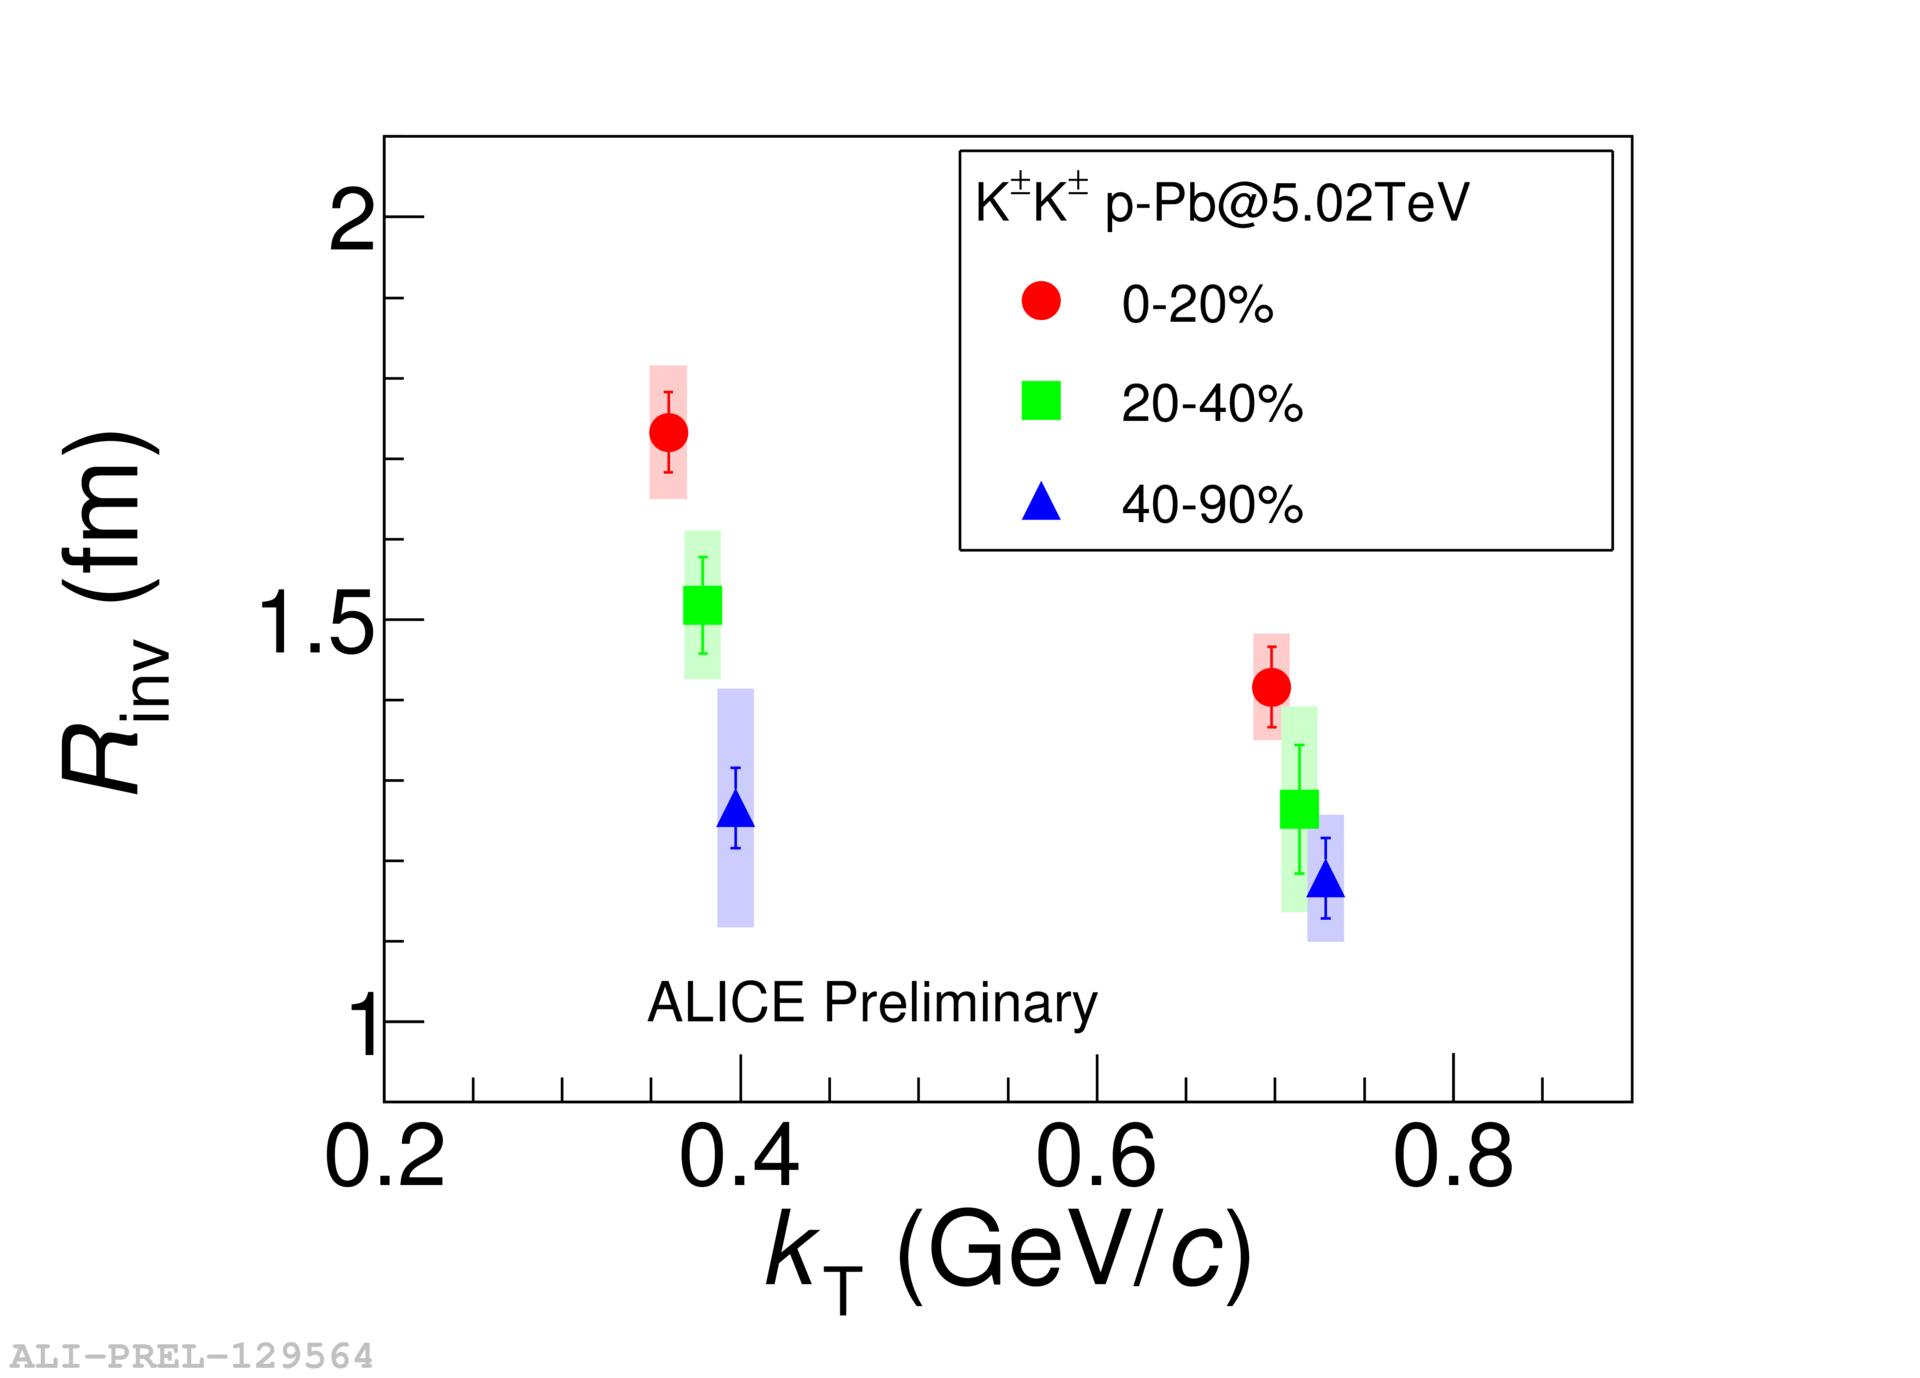
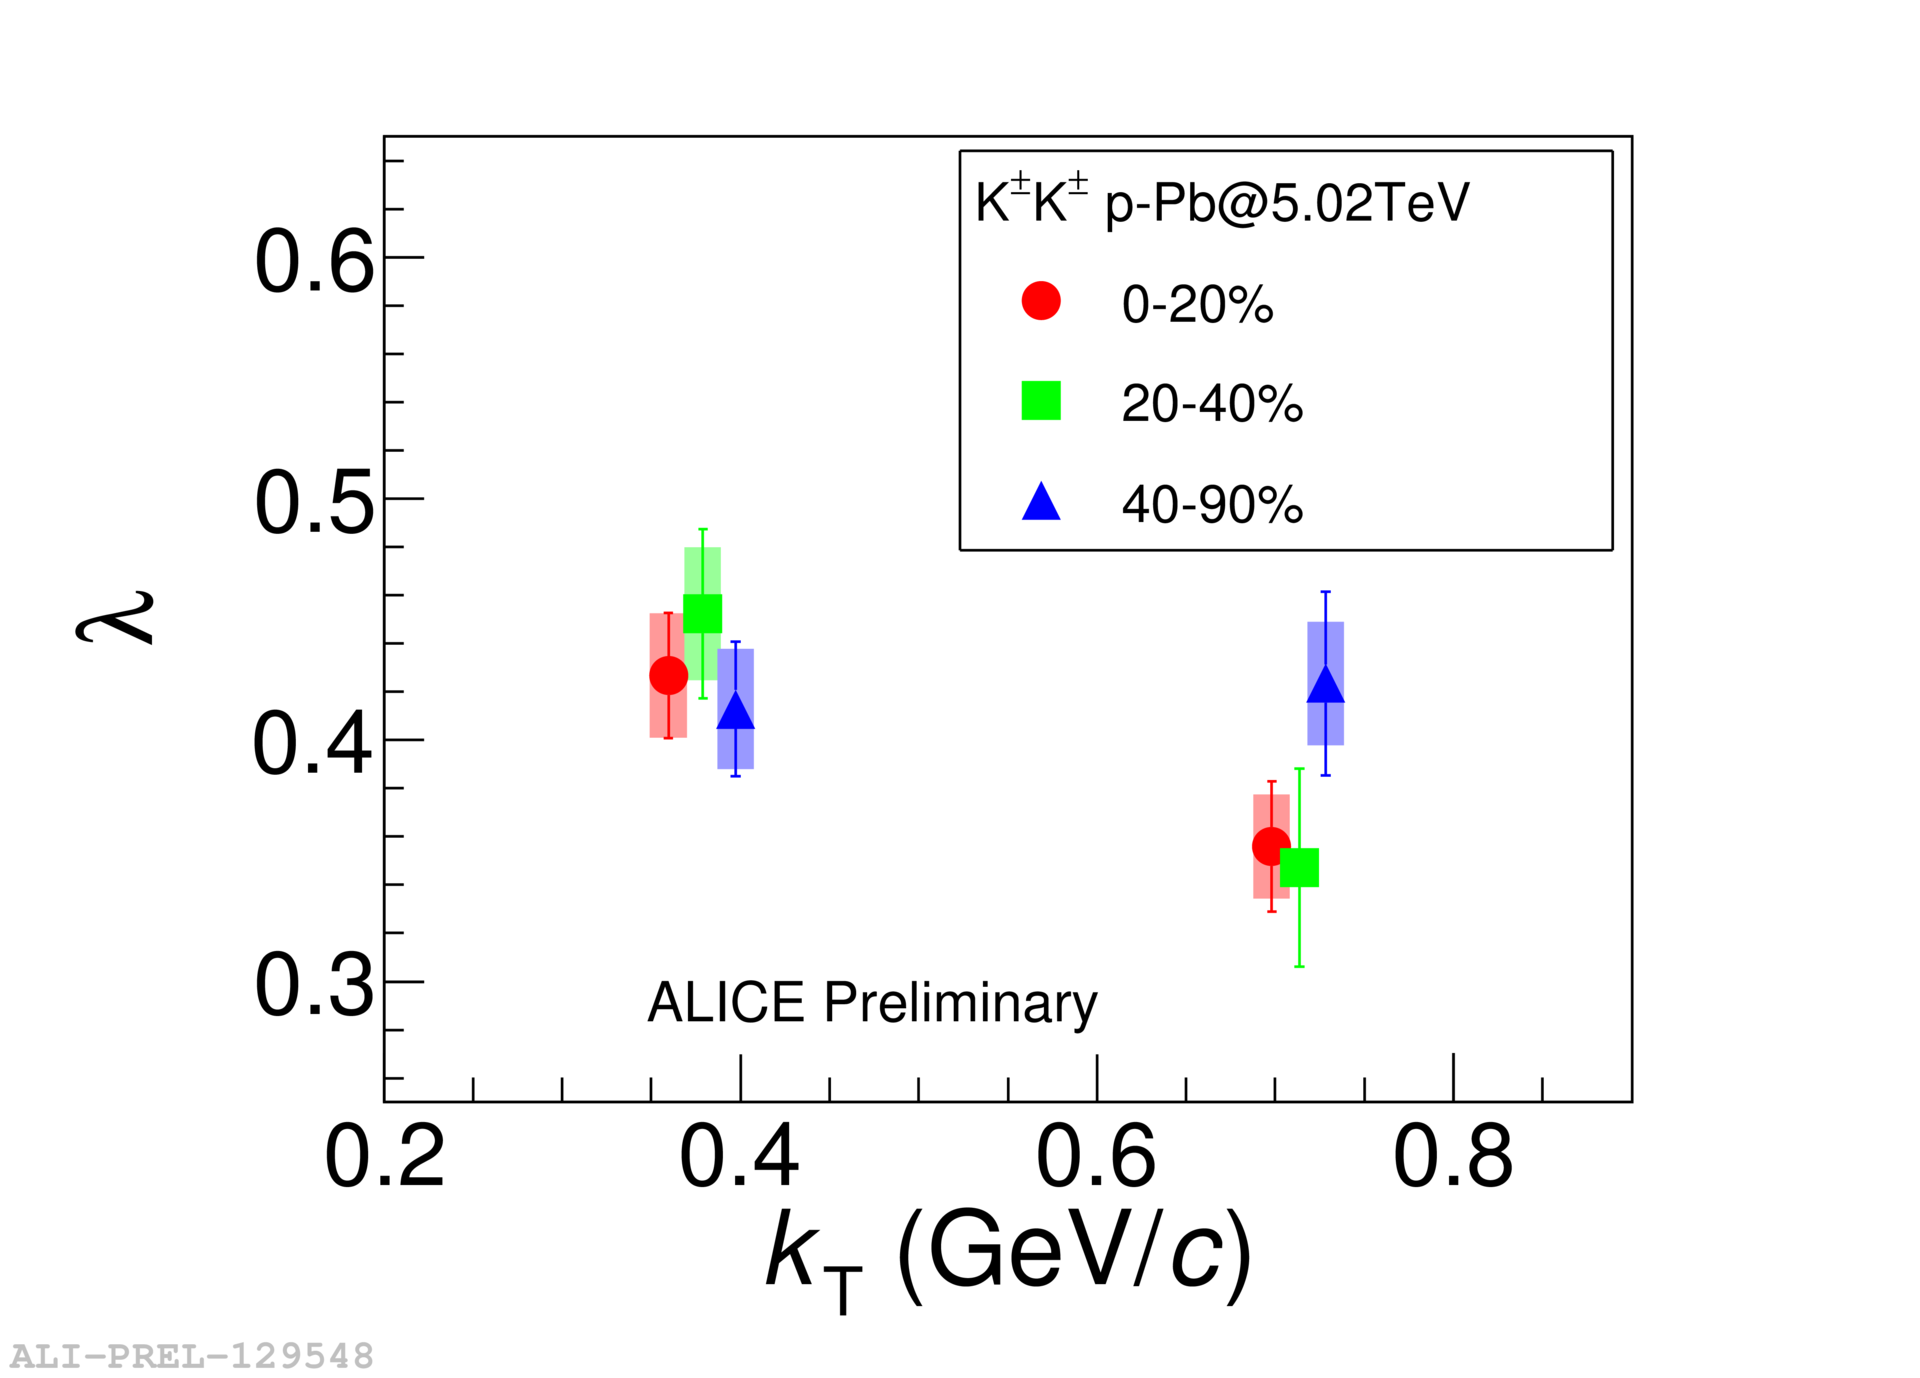
In Fig. 3, the radii from pp collisions at TeV [13] and p–Pb collisions at TeV at similar multiplicity are compared as a function of pair transverse momentum . The corresponding radii in Pb–Pb collisions at TeV [16] are not shown since they cannot be extracted at comparable multiplicities due to a lack of data. The figure shows that at the same multiplicity, the radii in p–Pb collisions are equal to those in pp collisions within uncertainties. This observation differs from the results of the three-dimensional [8] and one-dimensional three-pion cumulants [12] analyses, where radii in pp collisions were obtained 5–15% less than those in p–Pb collisions.
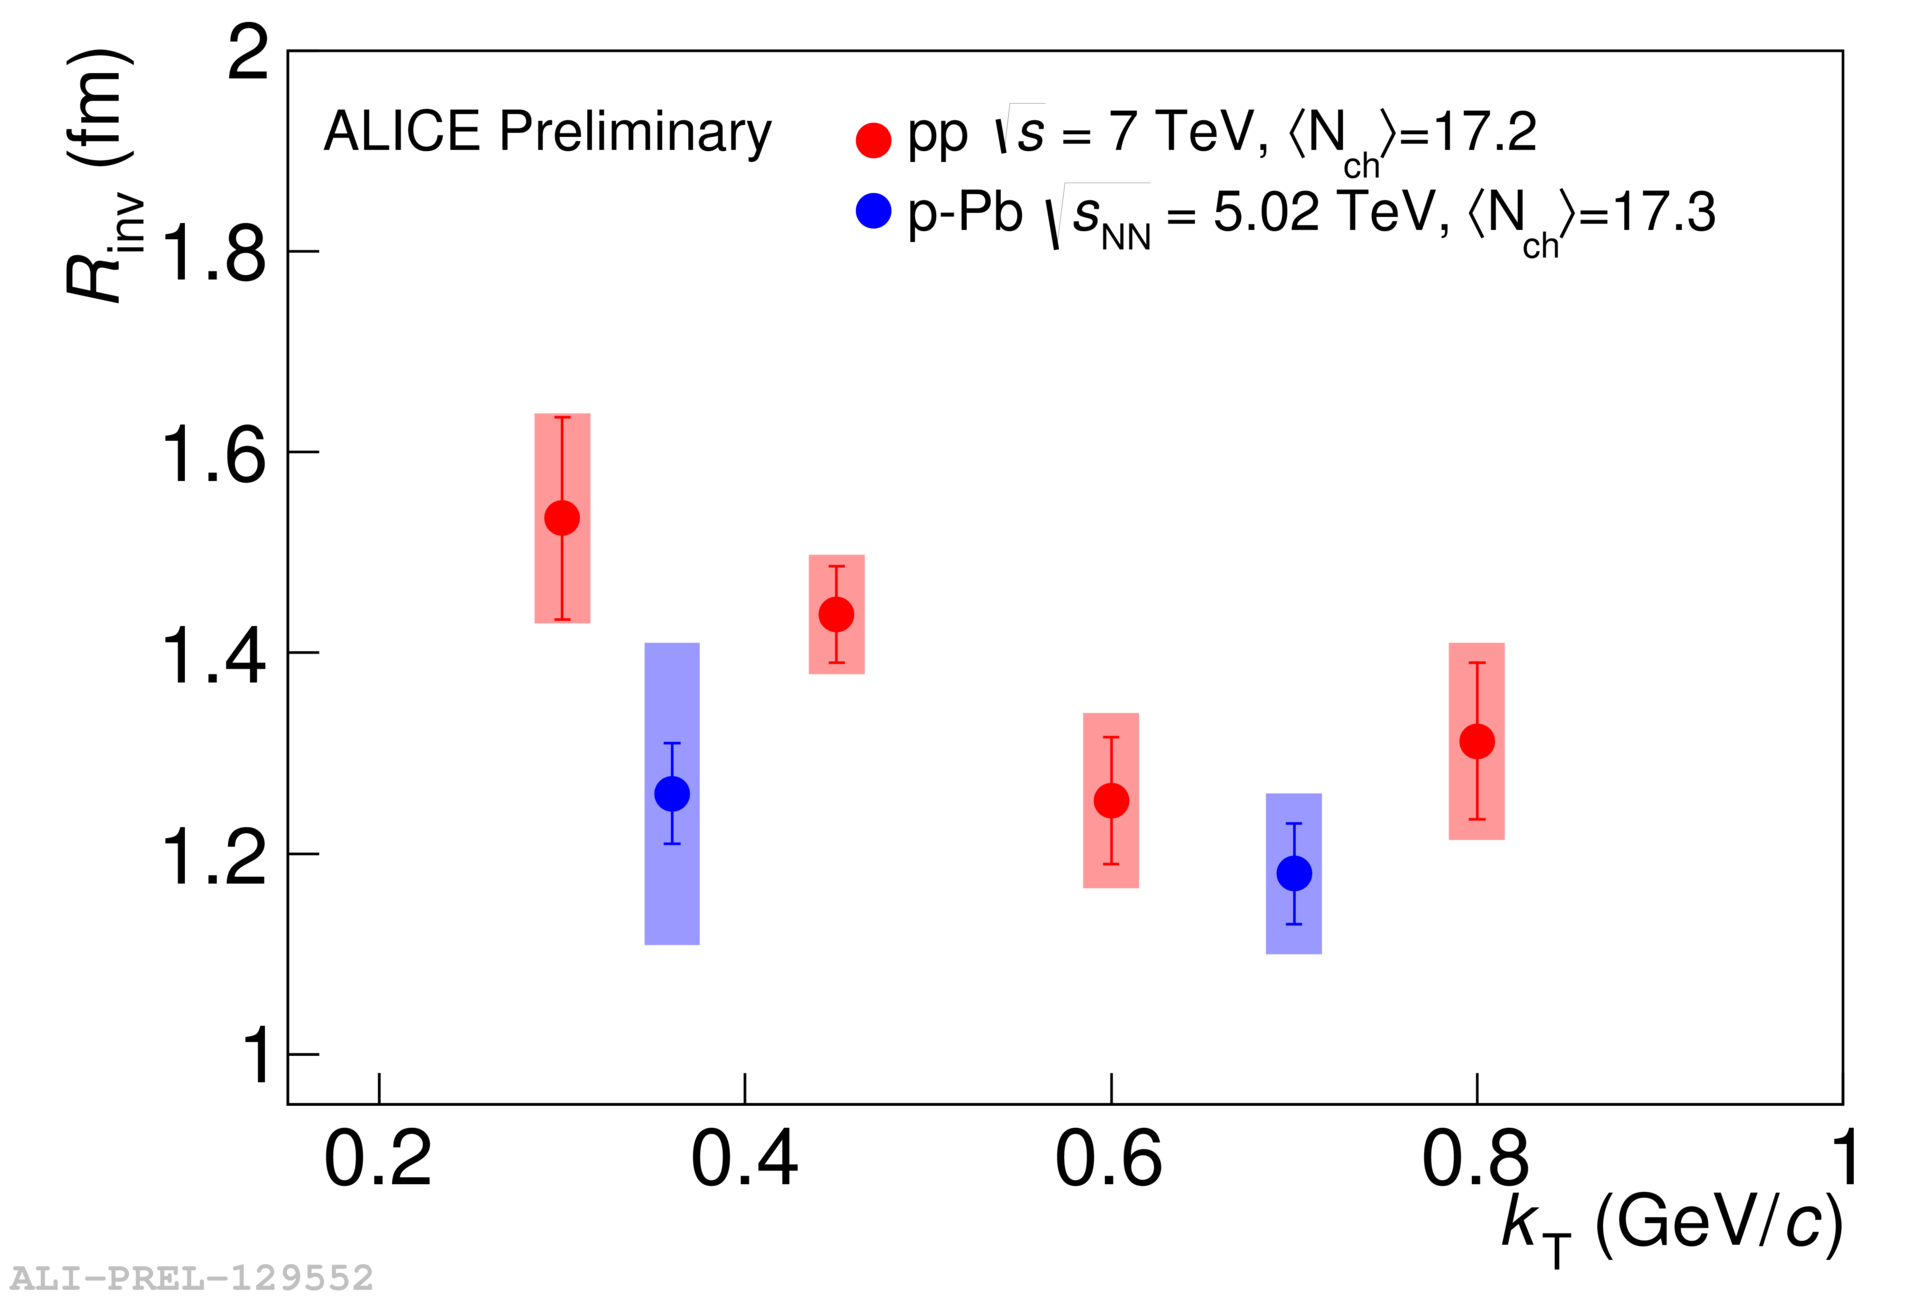
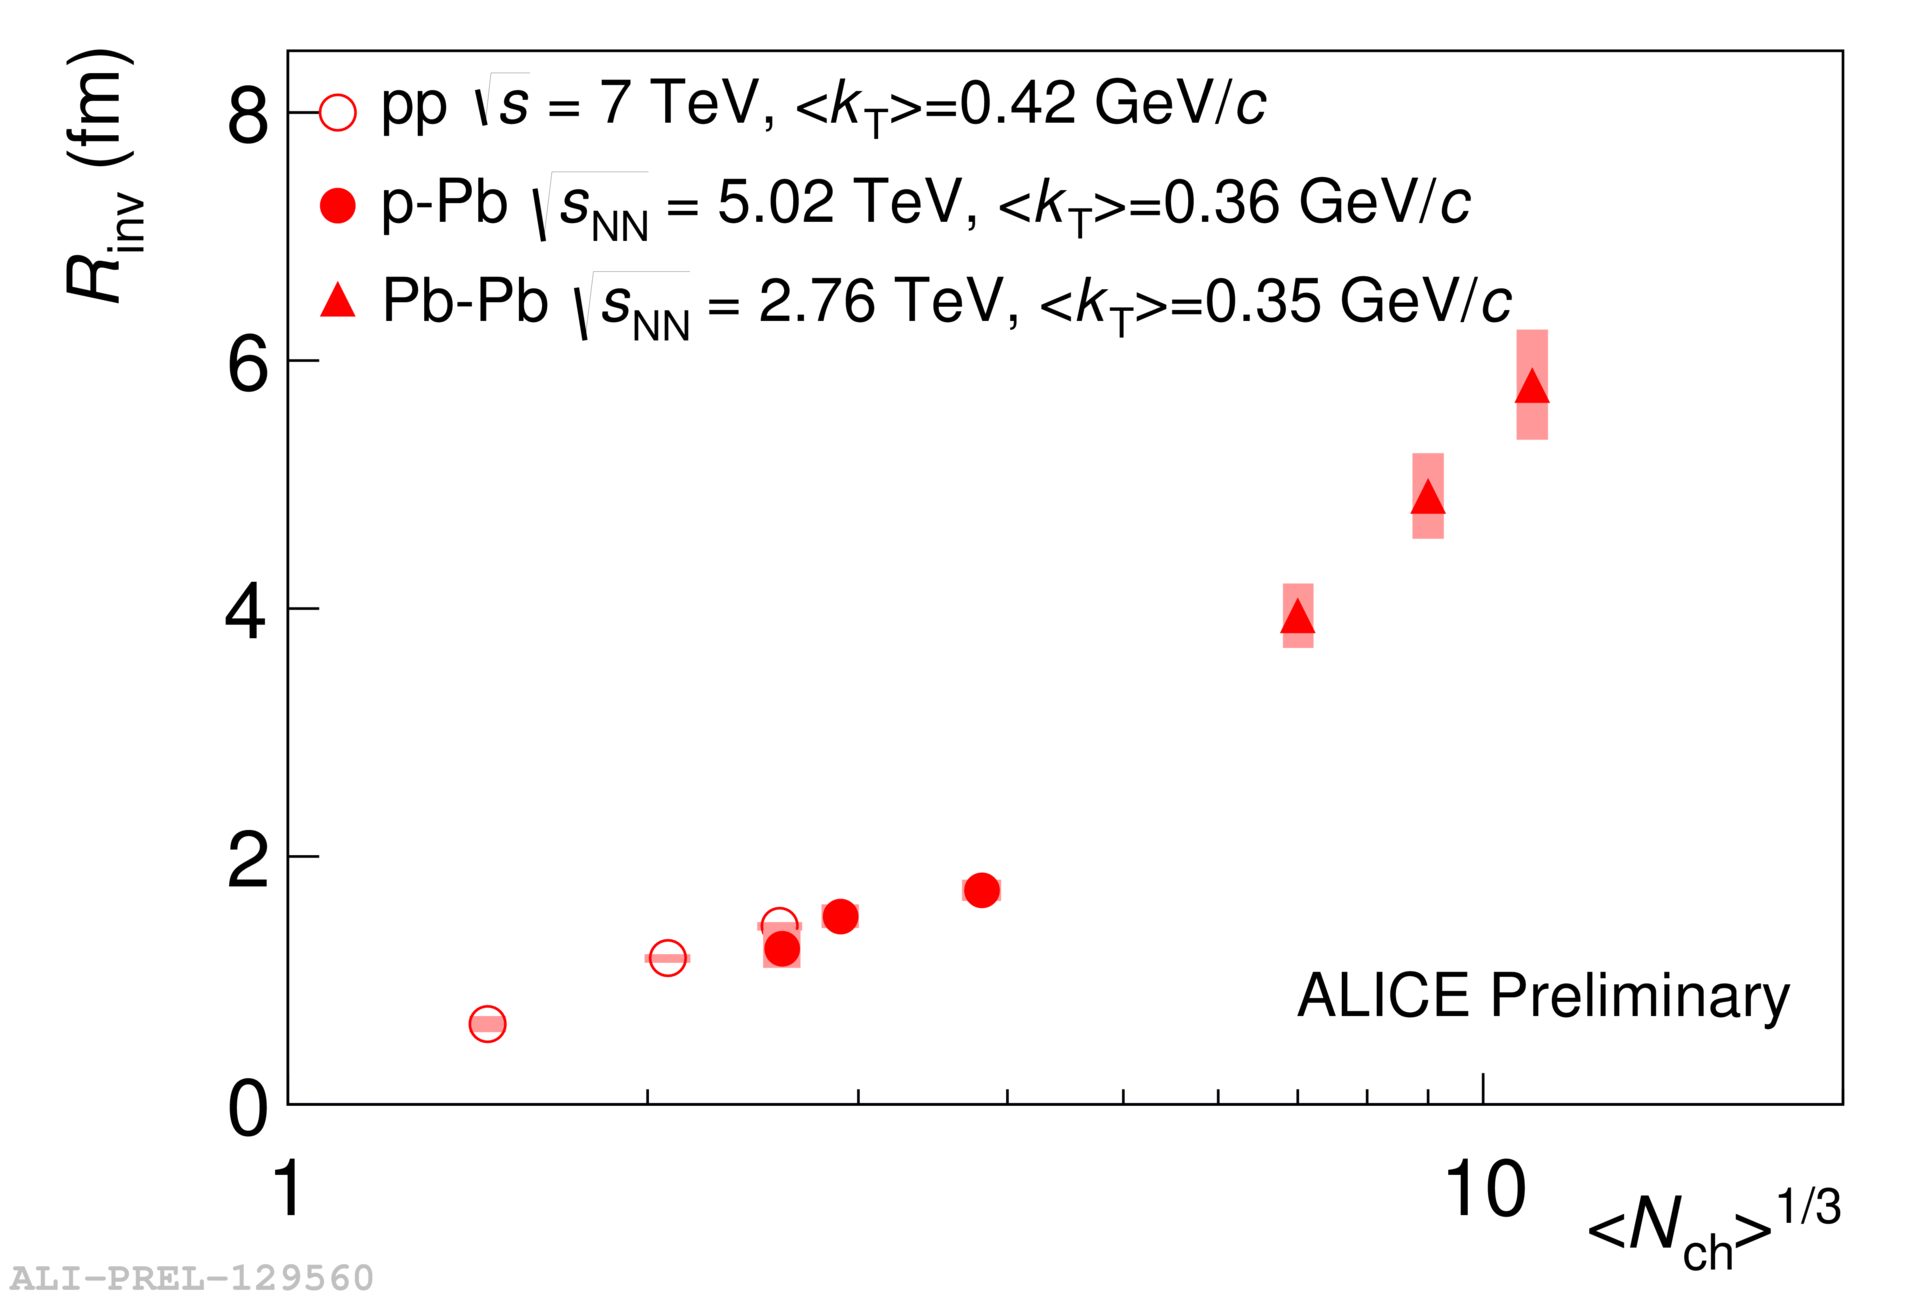
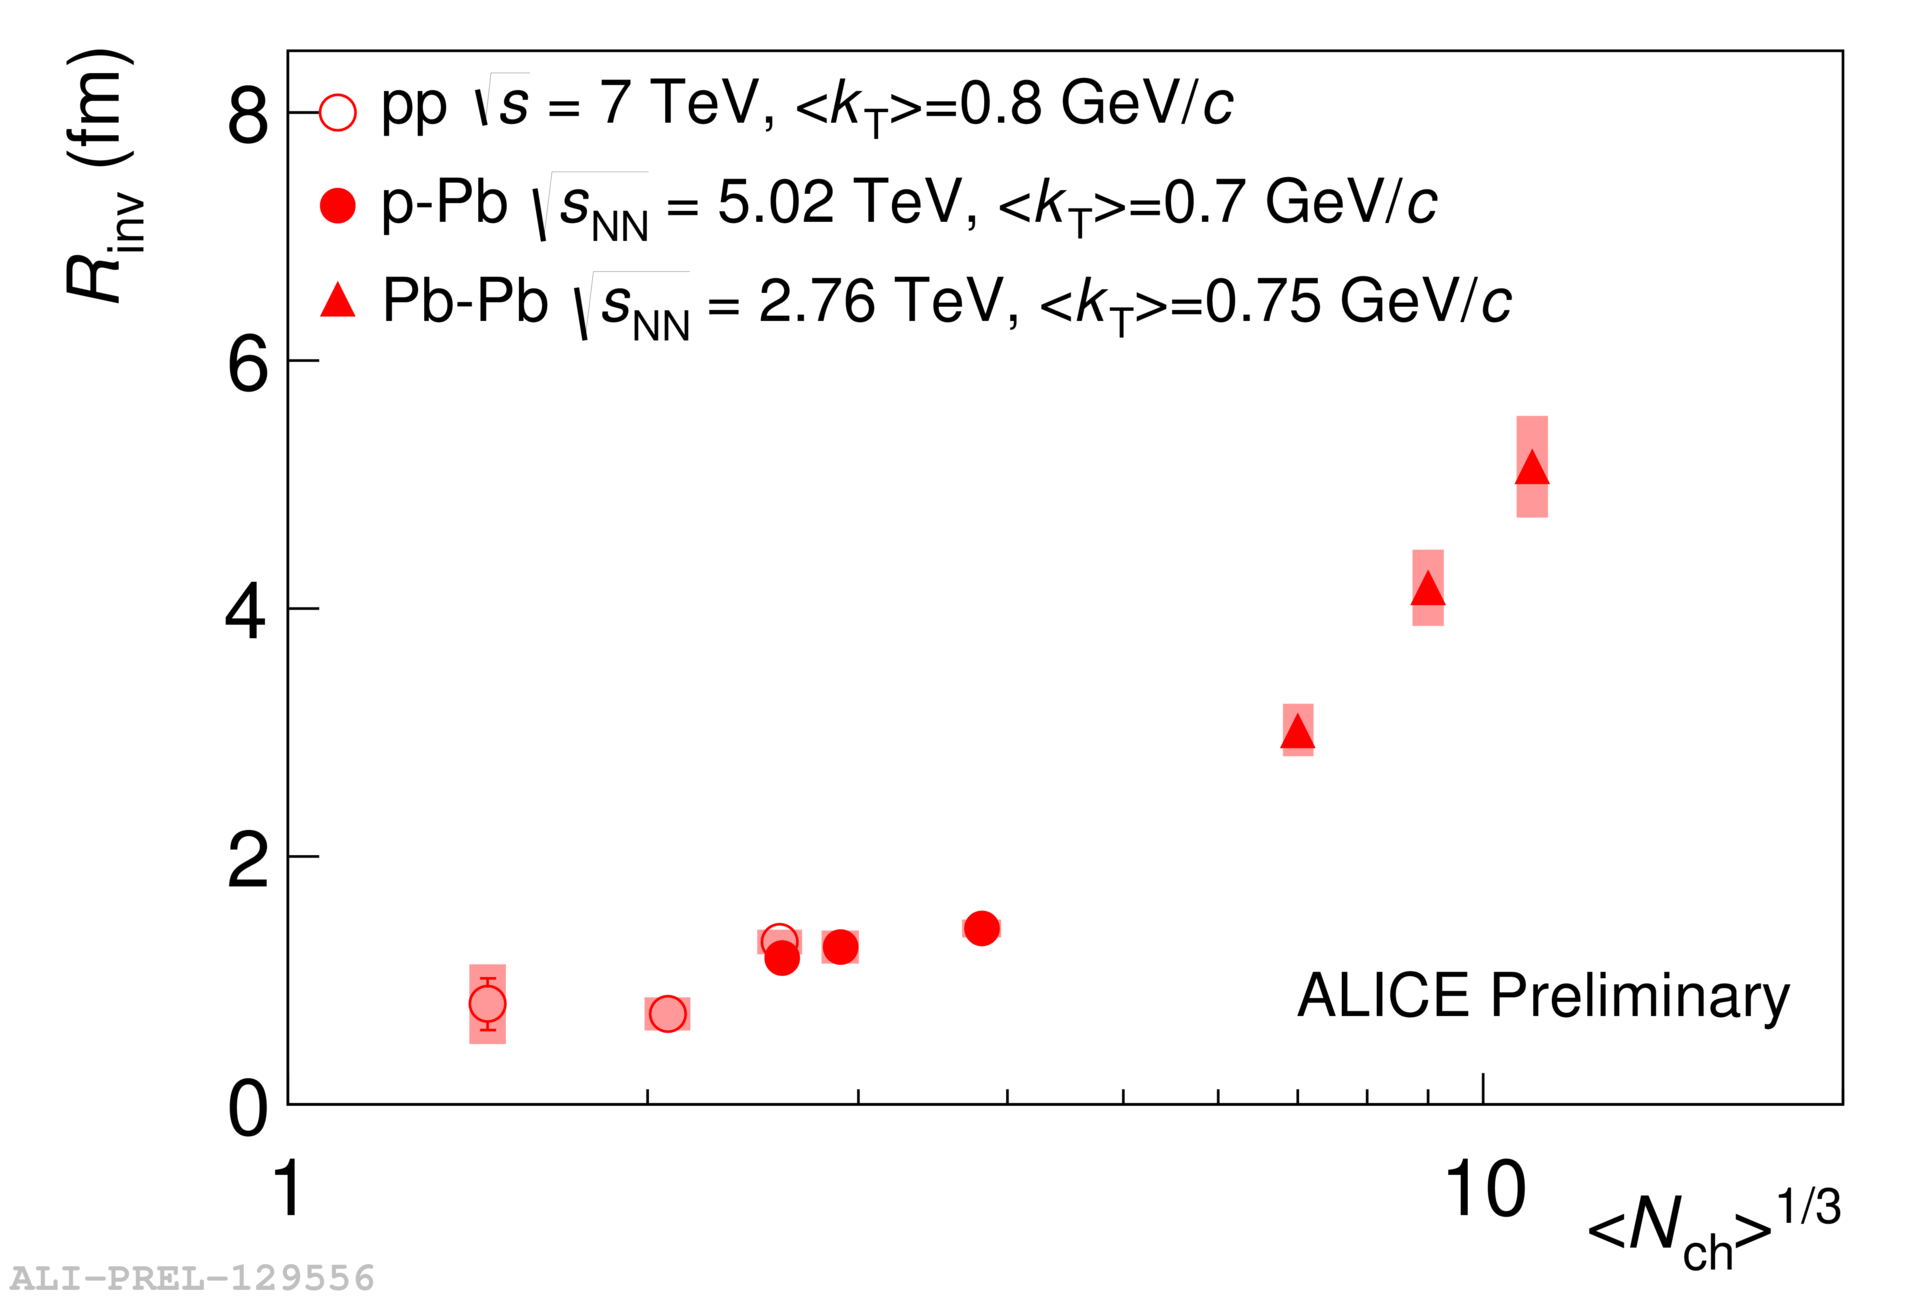
Figure 4 compares femtoscopic radii, as a function of the measured charged-particle multiplicity density , at low 4(a) and high 4(b) extracted in pp [13], p–Pb and Pb–Pb [16] collisions. The obtained radii increase with and follow the multiplicity trend observed in pp collisions. The radii are equal in p–Pb and pp collisions at similar multiplicity within uncertainties. This result indicates the absence of strong collective expansion in p–Pb collisions at low multiplicities [14]. As it is seen from the figure, the radii in p–Pb and Pb–Pb collisions cannot be compared at the same . In order to make a conclusion as it was done in the pion correlation analyses [8, 12] more experimental data are needed.
Figures 5(a) and 5(b) show the correlation strengths in pp [13], p–Pb and Pb–Pb [16] collisions at low and high , respectively. All values are less than unity and vary in the range due to the influence of long-lived resonances and a non-Gaussian shape of the kaon CF peak. It can be noticed from the figure that the correlation strength parameters in Pb–Pb collisions tend to be higher than those in pp and p–Pb collisions. That could point to a more Gaussian source created in Pb–Pb collisions.
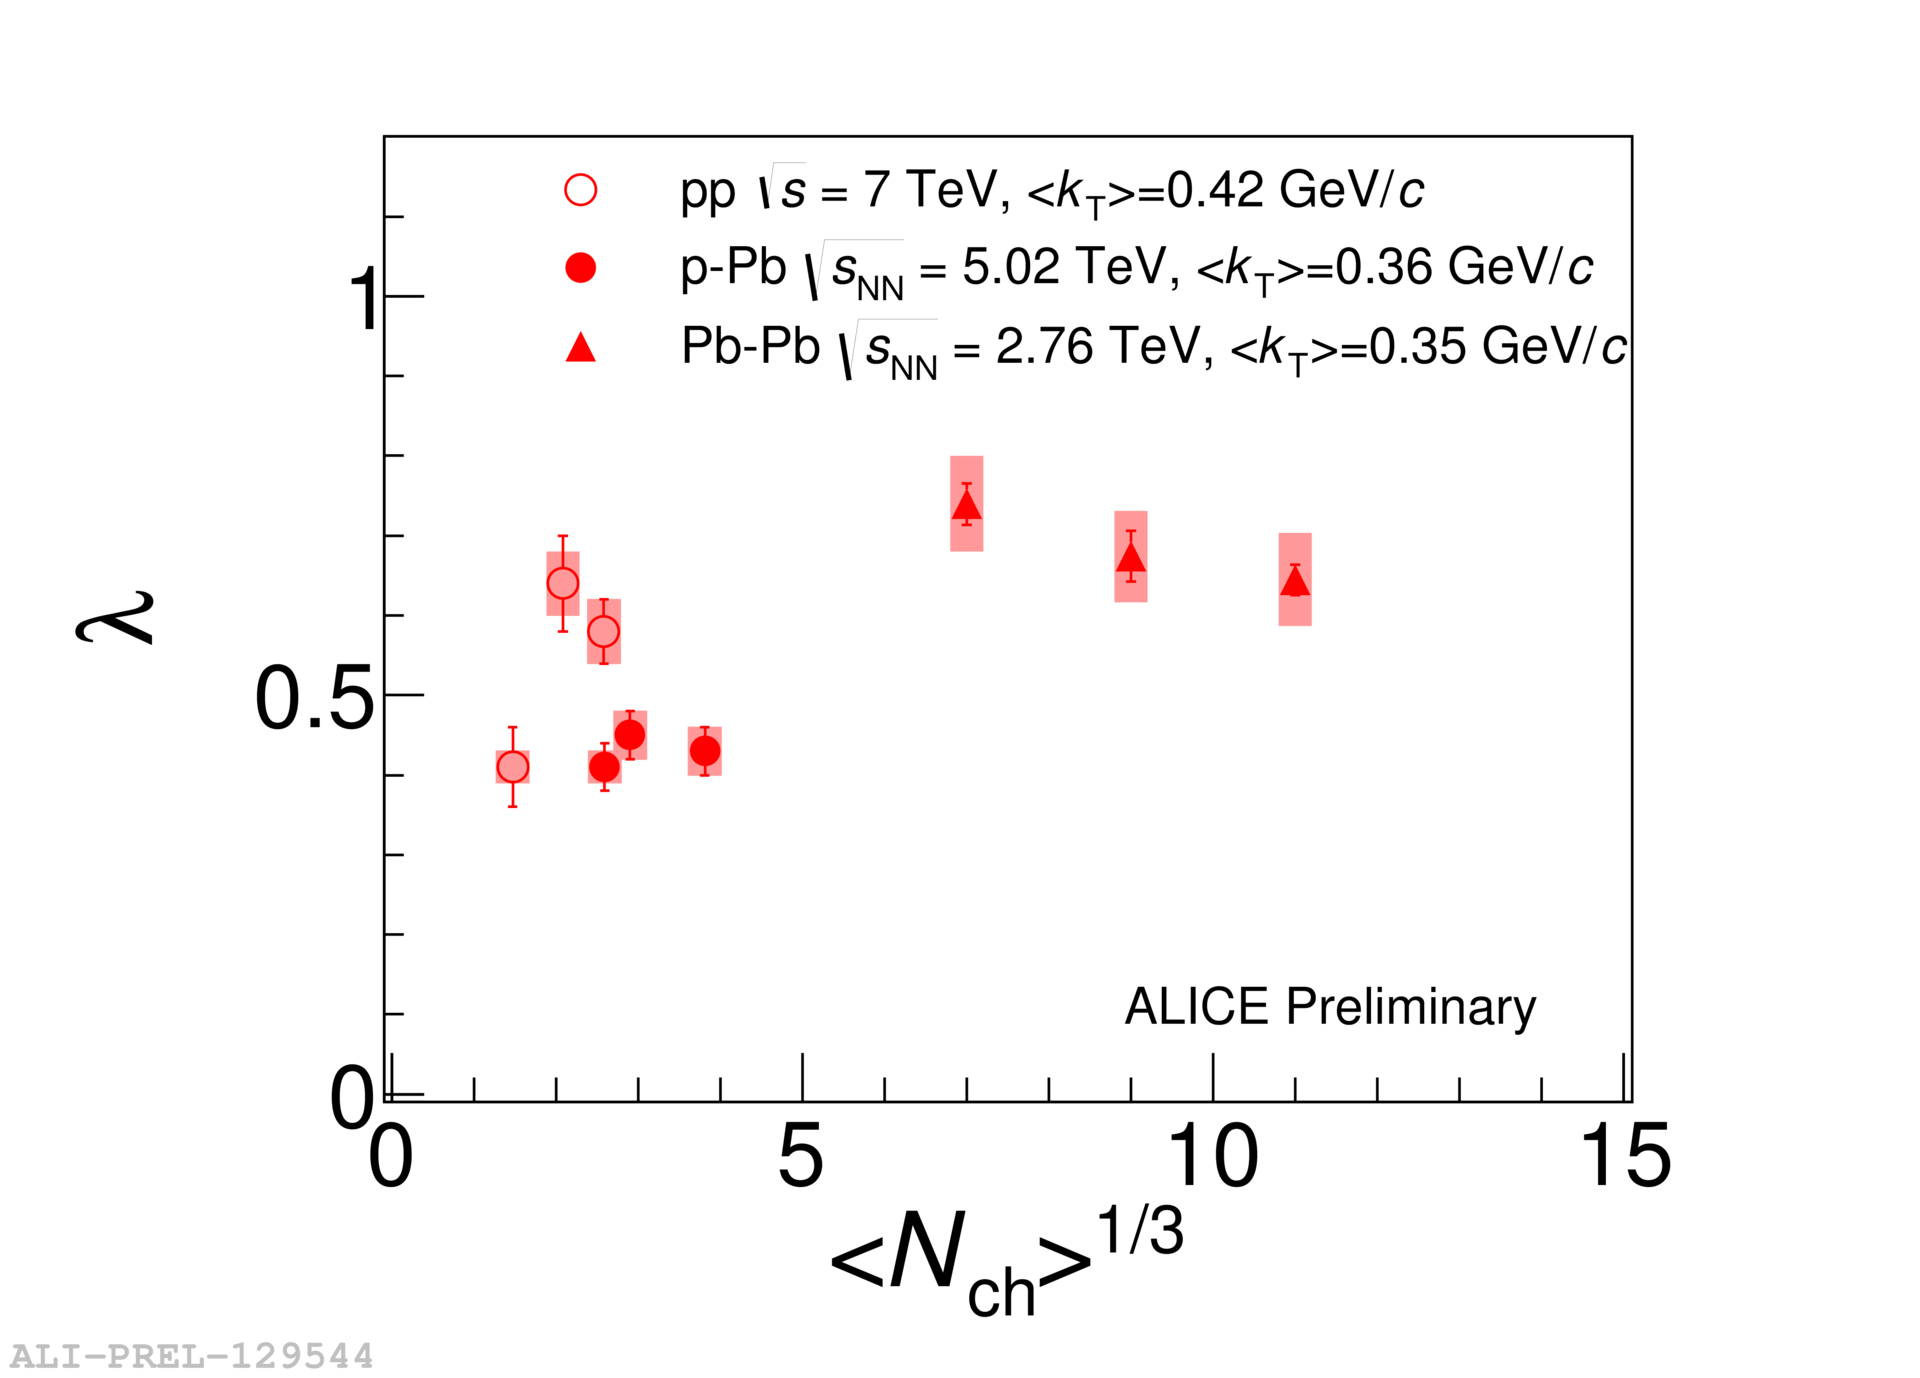
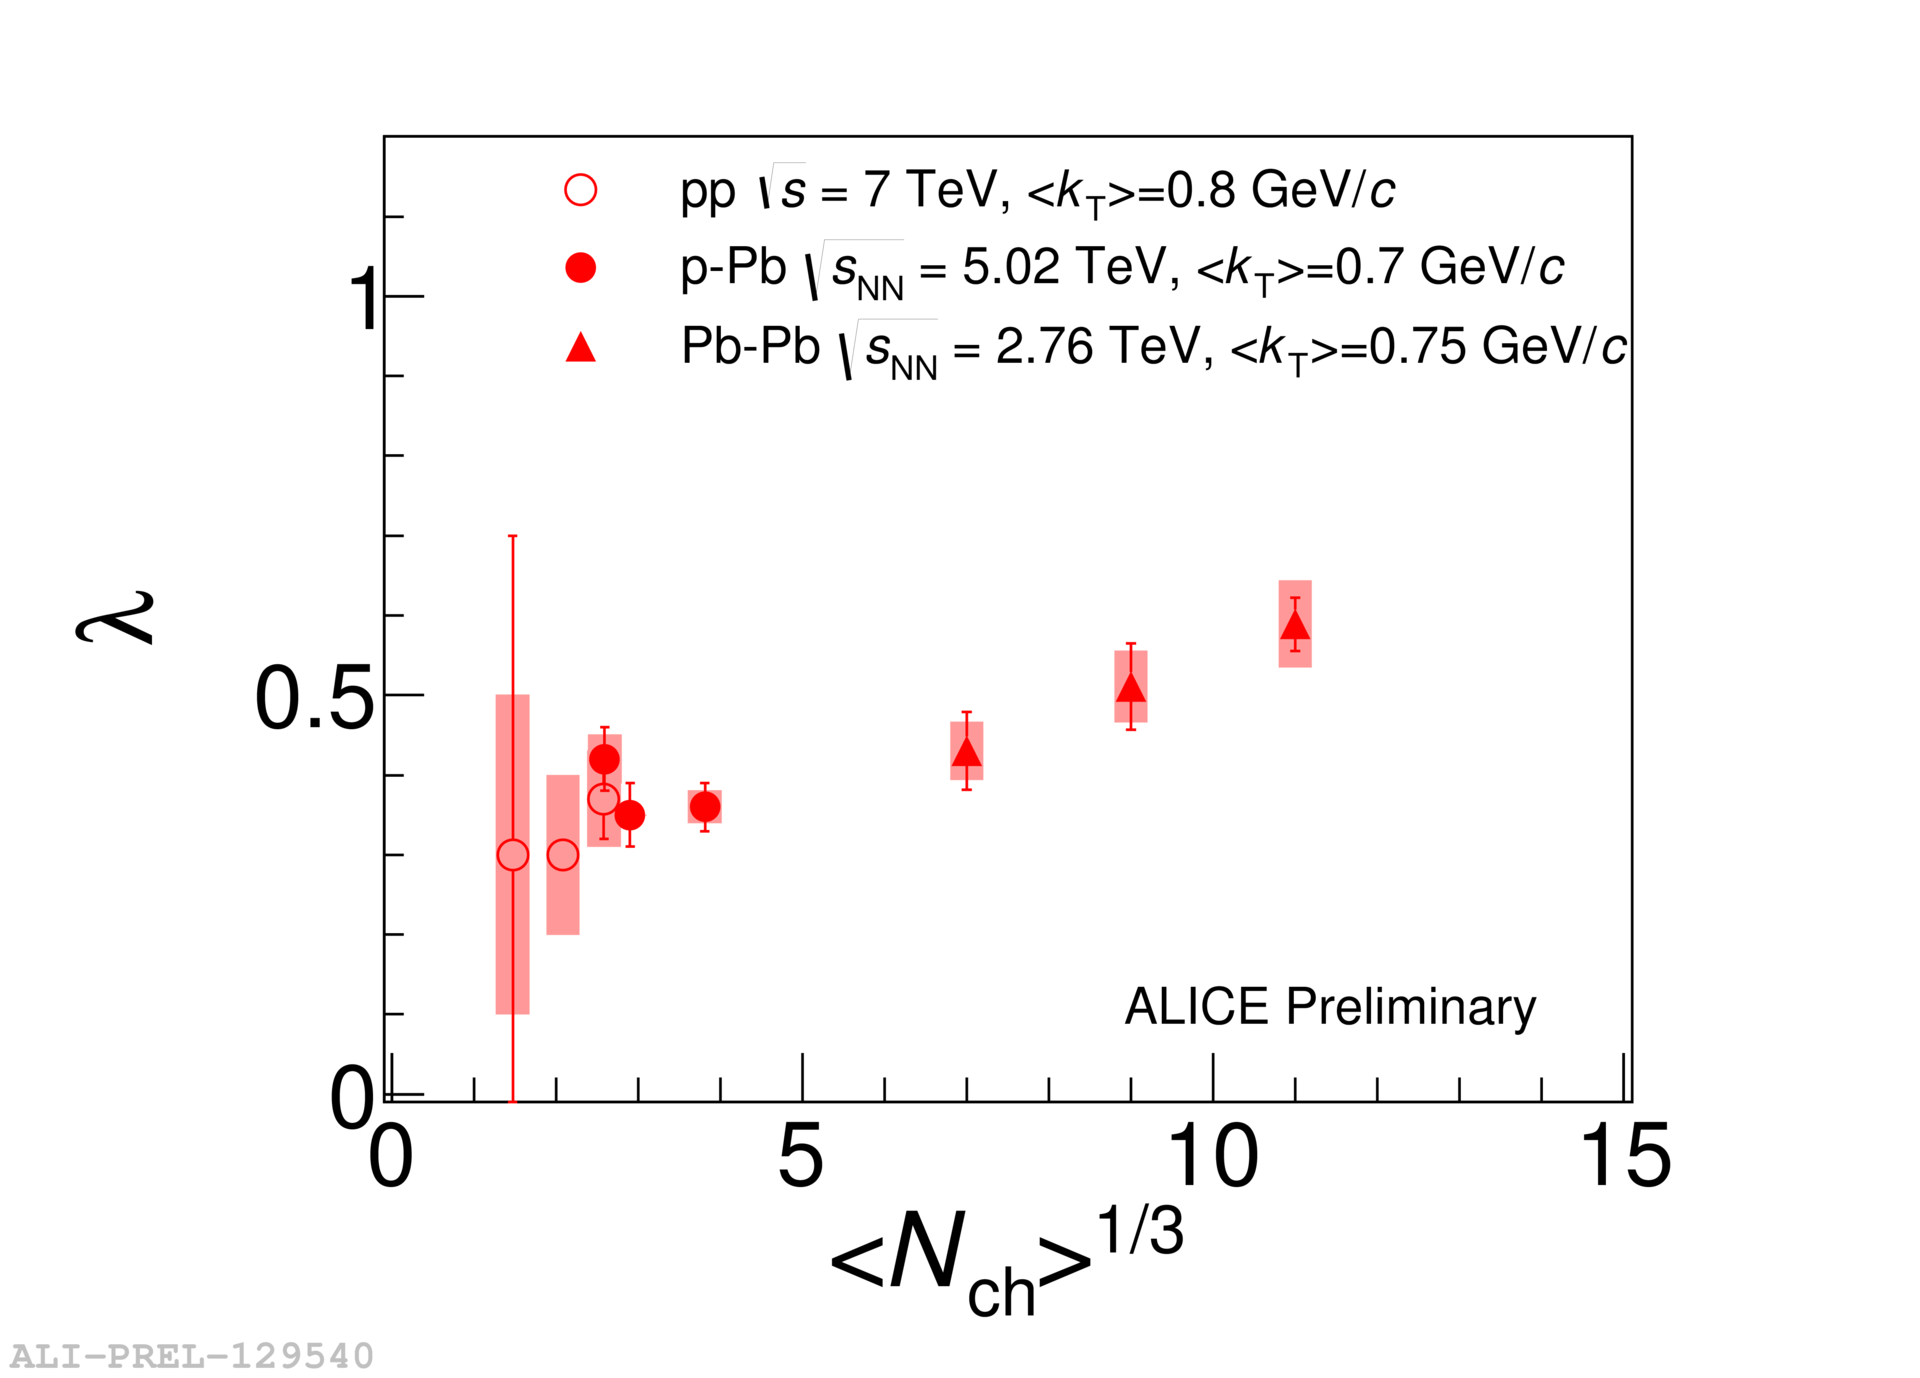
Figure 6 compares correlation strengths in pp [13], p–Pb and Pb–Pb collisions as a function of . These correlation strengths vary in the range . There is no noticeable or centrality dependence observed.
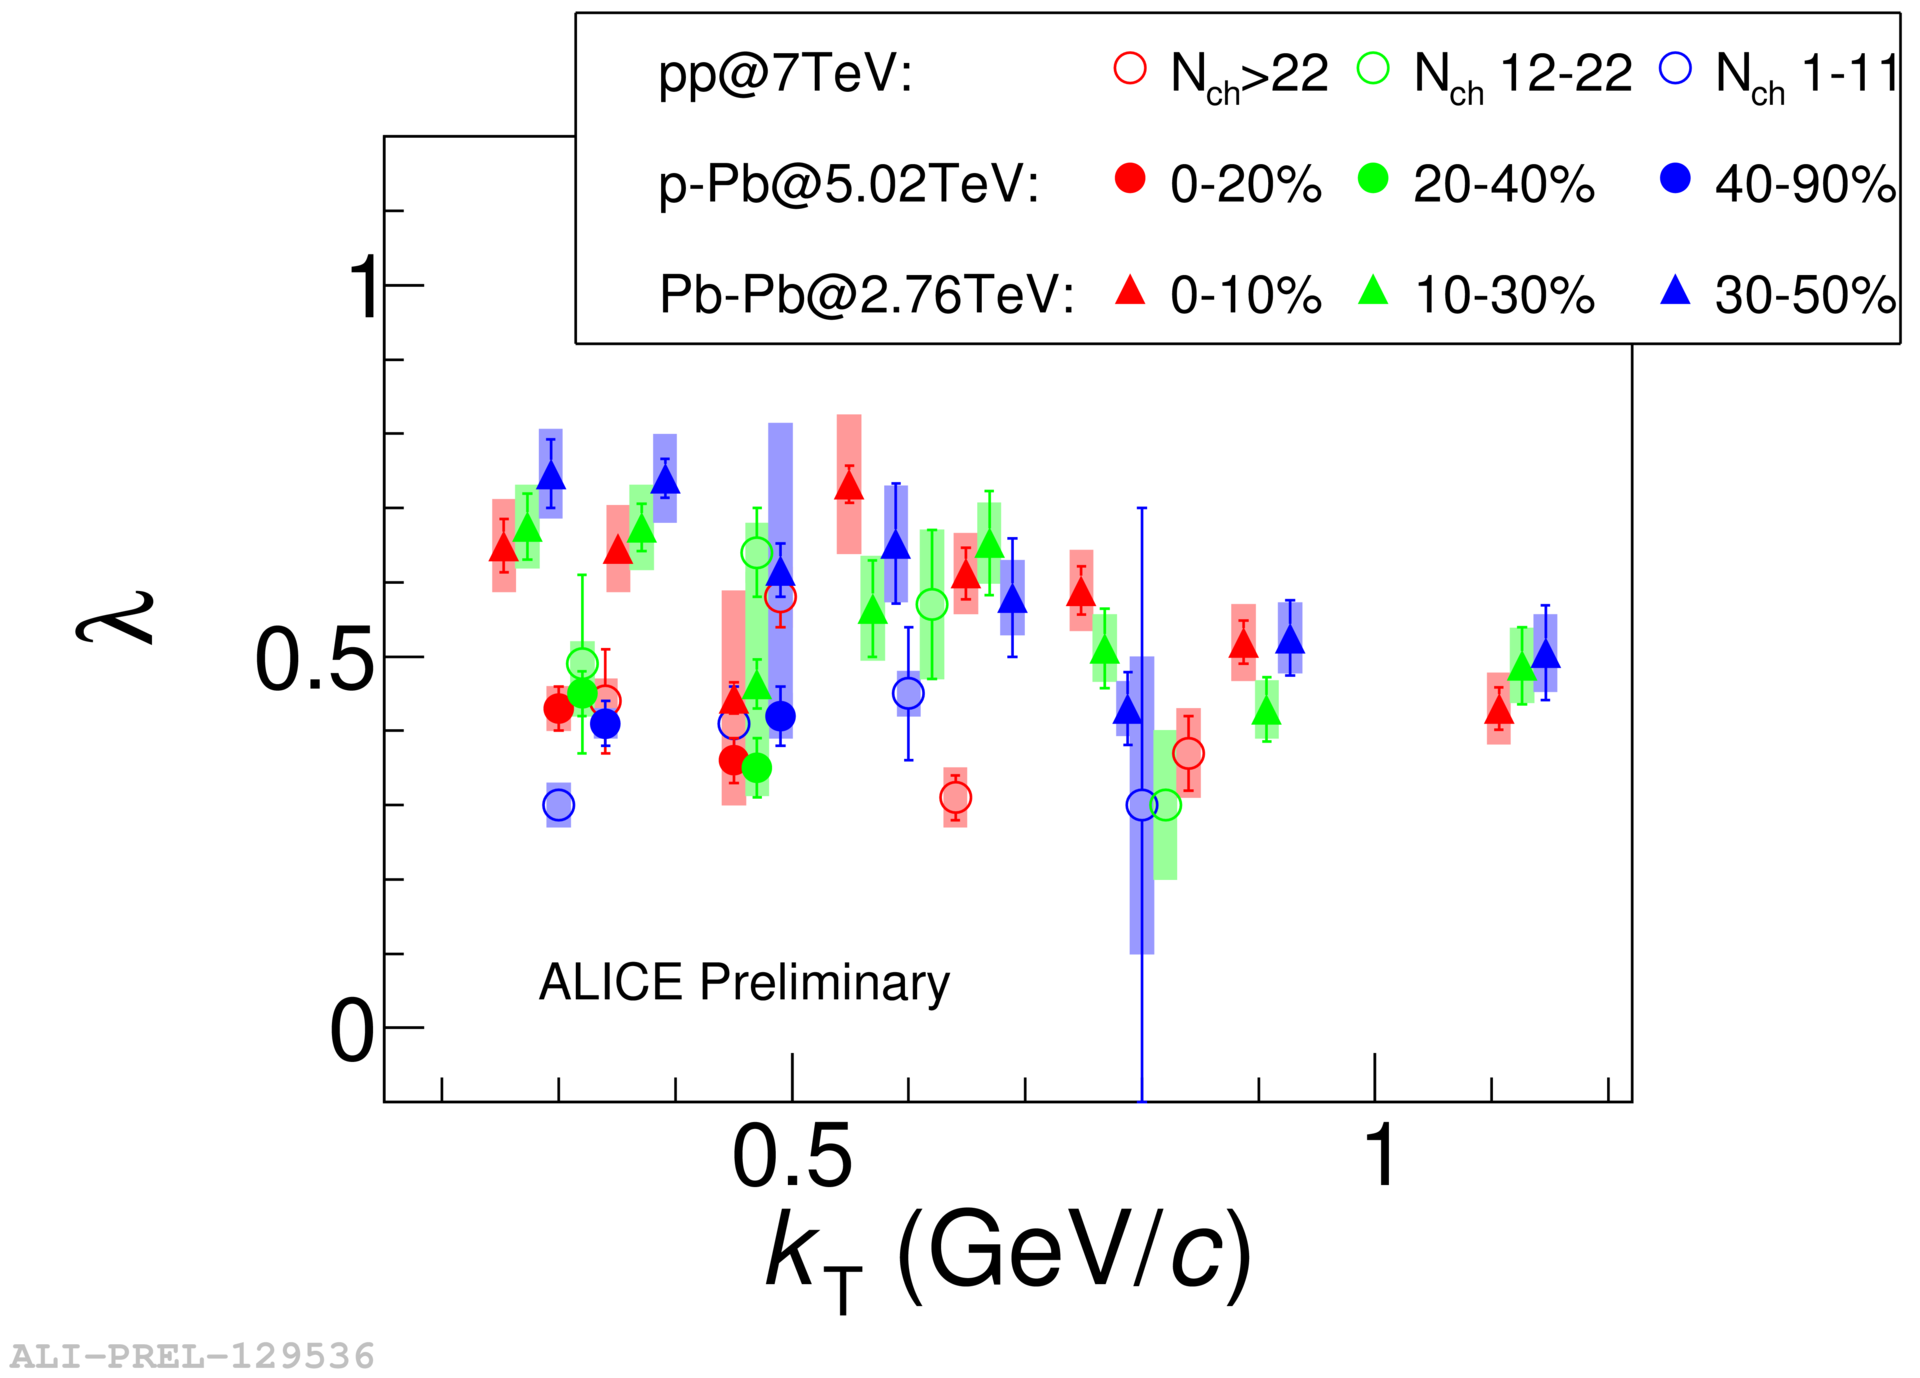
4 Conclusion
In this work, one-dimensional identical charged kaon correlations have been obtained and analyzed for the first time in proton–nucleus collisions, that is in p–Pb at TeV. The source size and correlation strength have been extracted from a correlation function parametrized in terms of invariant pair relative momentum . The obtained radii decrease with increasing pair transverse momentum and with decreasing event multiplicity. This is similar to the behavior of pion radii in the three-dimensional two-pion correlation and one-dimensional three-pion cumulant analyses. The kaon in p–Pb and pp collisions lie on the same multiplicity trend, whereas it is difficult to compare them with the results from Pb–Pb collisions because of a big multiplicity gap. The results disfavor models which incorporate substantially stronger collective expansion in p–Pb collisions as compared to pp collisions at similar multiplicity. The correlation strength varies from 0.3 to 0.7 for all collision systems, with no noticeable dependence on centrality or . The fact that the correlation strength in Pb–Pb collisions tends to be higher than in pp and p–Pb collisions could be an indication of a more Gaussian source created in Pb–Pb collisions. However, a strong conclusion is prevented due to large statistical uncertainties.
References
- [1] G. Goldhaber, S. Goldhaber, W.-Y. Lee, A. Pais, Phys. Rev. 120 (1960) 300-312
- [2] G.I. Kopylov, M.I. Podgoretsky, Sov. J. Nucl. Phys. 15 (1972) 219-223
- [3] G.I. Kopylov, V.L. Lyuboshits, M.I. Podgoretsky, JINR-P2-8069 (1974)
- [4] W. Kittel, Acta Phys. Polon. B 32 (2001) 3927-3972 [arXiv:hep-ph/0110088]
- [5] G. Alexander, Rept. Prog. Phys. 66 (2003) 481-522 [arXiv:hep-ph/0302130]
- [6] M.I. Podgoretsky, Fiz. Elem. Chast. Atom. Yadra 20 (1989) 628-668
- [7] R. Lednicky, Phys. Atom. Nucl. 67 (2004) 72-82 [arXiv:nucl-th/0305027]
- [8] J. Adam et al. [ALICE Collaboration], Phys. Rev. C 91 (2015) 034906 [arXiv:1502.00559 [nucl-ex]]
- [9] K. Aamodt et al. [ALICE Collaboration], JINST 3 (2008) S08002
- [10] J. Adam et al. [ALICE Collaboration], Phys. Rev. C 91 (2015) 6, 064905 [arXiv:1412.6828 [nucl-ex]]
- [11] E. Abbas et al. [ALICE Collaboration], JINST 8 (2013) P10016 [arXiv:1306.3130 [nucl-ex]]
- [12] B.B. Abelev et al. [ALICE Collaboration], Phys. Lett. B 739 (2014) 139-151 [arXiv:1404.1194 [nucl-ex]]
-
[13]
B.B. Abelev et al. [ALICE Collaboration], Phys. Rev. D 87 (2013) 5, 052016
[arXiv:1212.5958 [hep-ex]] - [14] P. Bozek, W. Broniowski, Phys. Lett. B 720 (2013) 250-253 [arXiv:1301.3314 [nucl-th]]
- [15] A. Bzdak, B. Schenke, P. Tribedy, R. Venugopalan, Phys. Rev. C 87 (2013) 6, 064906 [arXiv:1304.3403 [nucl-th]]
- [16] J. Adam et al. [ALICE Collaboration], Phys. Rev. C 92 (2015) 5, 054908 [arXiv:1506.07884 [nucl-ex]]
- [17] G.I. Kopylov, Phys. Lett. B 50 (1974) 472-474
- [18] S.R. Beane, T.C. Luu, K. Orginos, A. Parreno, M.J. Savage, A. Torok, A. Walker-Loud [NPLQCD Collaboration], Phys. Rev. D 77 (2008) 094507 [arXiv:0709.1169 [hep-lat]]
- [19] Yu. Sinyukov, R. Lednicky, S.V. Akkelin, J. Pluta, B. Erazmus, Phys. Lett. B 432 (1998) 248-257
- [20] M.G. Bowler, Z. Phys. C 29 (1985) 617
- [21] B.B. Abelev et al. [ALICE Collaboration], Phys. Rev. C 89 (2014) 2, 024911 [arXiv:1310.7808 [nucl-ex]]
- [22] K. Werner, B. Guiot, Iu. Karpenko, T. Pierog., Phys. Rev. C 89 (2014) 6, 064903 [arXiv:1312.1233 [nucl-th]]
- [23] T. Pierog, Iu. Karpenko, J.M. Katzy, E. Yatsenko, K. Werner, Phys. Rev. C 92 (2015) 3, 034906 [arXiv:1306.0121 [hep-ph]]
- [24] B.B. Abelev et al. [ALICE Collaboration], Phys. Lett. B 728 (2014) 25-38 [arXiv:1307.6796 [nucl-ex]]