Single-atom-resolved probing of lattice gases in momentum space
Abstract
Measuring the full distribution of individual particles is of fundamental importance to characterize many-body quantum systems through correlation functions at any order. Here we demonstrate the possibility to reconstruct the momentum-space distribution of three-dimensional interacting lattice gases atom-by-atom. This is achieved by detecting individual metastable Helium atoms in the far-field regime of expansion, when released from an optical lattice. We benchmark our technique with Quantum Monte-Carlo calculations, demonstrating the ability to resolve momentum distributions of superfluids occupying lattice sites. It permits a direct measure of the condensed fraction across phase transitions, as we illustrate on the superfluid-to-normal transition. Our single-atom-resolved approach opens a new route to investigate interacting lattice gases through momentum correlations.
Ultracold atoms in optical lattices have proven to be a valuable system to investigate condensed-matter models in a tunable and controllable environment bloch2012 . In this context, the past decade has witnessed the emergence of a new generation of lattice experiments capable of measuring spatial distributions and correlations between individual particles bakr2009 ; sherson2010 ; haller2015 ; cheuk2015 ; parsons2015 ; edge2015 ; barredo2016 . These apparatus have paved the way to unprecedented investigations of both equilibrium and dynamical properties of strongly-interacting matter. Similarly, the on-site detection of individual spins is central to other experimental platforms, like trapped ions britton2012 or superconducting circuits barends2016 . Some paradigmatic manifestations of quantum many-body effects are however elusive in spatial correlations, and multi-particle correlations between other degrees of freedom play a fundamental role schweigler2017 .
In this respect, the momentum of the particles is an essential degree of freedom, whose correlation functions contain unique signatures of many-body quantum coherence. Off-diagonal long-range order and Bose-Einstein condensation manifest in the momentum density leggett2006 , and thermal and quantum fluctuations can be characterized through the population of one-particle momentum states chang2016 . While well established for weakly-interacting gases, momentum densities are notoriously difficult to measure in strongly interacting systems like liquid Helium leggett2006 . Two-particle momentum correlations are central to various microscopic mechanisms of pairing in many-body Hamiltonians, from the quantum depletion in Bose liquids to fermionic Cooper pairing leggett2006 , and they exhibit signatures of quantum phase transitions toth2008 and out-of-equilibrium dynamics chen2011 . Creating the possibility to measure the full momentum distribution of individual particles would permit a direct assessment of these many-body phenomena.
In principle, quantum gases offer the possibility to explore the momentum degree of freedom by performing time-of-flight (TOF) experiments, i.e. probing the gas after a free-fall expansion. In practice, the conditions under which the measured distributions precisely map to the in-trap momentum distributions are difficult to fulfill pollet2012 . The free-fall dynamics should not be perturbed by the presence of interactions to apply the ballistic relation between the in-trap momentum and the measured position after time-of-flight. In addition a long TOF is required to enter the far-field regime of expansion where the TOF distribution equals the Fourier transform of the in-trap function gerbier2008 . Optical imaging is not adapted to probing extremely dilute clouds over a large volume and the TOF commonly implemented in experiments is too short to reach the far-field regime. Moreover the technical requirements to efficiently collect the photons emitted by a single atom make it difficult extending single-atom-resolved fluorescence techniques to this regime. Finally, column-integrated images smoothen, and may partially wash out, specific features of the momentum space, e.g. the sharp edges of a three-dimensional Bose condensate.
In this work, we demonstrate the ability to reconstruct, accurately and atom-by-atom, the three-dimensional momentum distribution of strongly-interacting lattice gases of metastable Helium. We compare the time-of-flight distributions measured in the experiment with the in-trap momentum distributions calculated from ab-initio Quantum Monte-Carlo (QMC). The excellent agreement shows that our approach overcomes all the issues associated with measuring momentum distributions in a TOF experiment. Accessing the momentum space allows us to introduce a precise thermometry method from the comparison with QMC calculations and to directly measure the condensed fraction . Finally, we monitor across the superfluid-to-normal phase transition, illustrating the capabilities offered by our apparatus.
Our approach exploits the properties of Helium-4 atoms brought to quantum degeneracy in a metastable state (4He∗). On the one hand, the large internal energy of 4He∗ yields the unique possibility to detect individual atoms in three dimensions over centimeter distances vassen2012 , in contrast to optical imaging methods. On the other hand, the original combination of a long time-of-flight ms and the small mass of 4He∗ allows us to probe the far-field. Entering the far-field regime necessitates a TOF larger than gerbier2008 , where is the reduced Planck constant, the atomic mass and the length of the trapped gas. The use of a light atomic species is thus extremely favorable to keep accessible, even for large system sizes . For our parameters ( lattice sites), we find ms, indeed much shorter than (see SuppMat for further details).
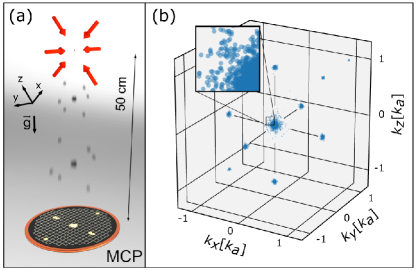
We realize strongly interacting lattice superfluids by adiabatically loading a Bose-Einstein Condensate (BEC) of 4He∗ atoms bouton2015 in the lowest energy band of a cubic optical lattice. The lattice spacing is nm and its amplitude is fixed, where is the recoil energy. At this amplitude , we have , where and are the Bose-Hubbard on-site interaction and tunneling energy parameters, and the expected quantum depletion is large (), highlighting the presence of strong quantum correlations. After abruptly switching off the optical lattice, the cloud expands for ms and it is probed with the Helium detector (Fig. 1(a). The Helium detector yields 3D distributions of individual atoms as shown in Fig. 1(b) and has been described previously nogrette2015 ; chang2016 . In brief, metastable atoms hit the surface of a pair of micro-channel plates (MCPs) from which they can extract an electron by releasing their internal energy (eV). The pair of MCPs multiplies the electron emitted by a single 4He∗ atom and, in combination with a delay-line anode, allows to reconstruct the 3D position of the atom in the frame of the cloud center-of-mass chang2016 , with a detection efficiency of 25(5)%. We associate a momentum to the position of an atom through the ballistic formula , obtaining the distributions reconstructed from the MCP detector.
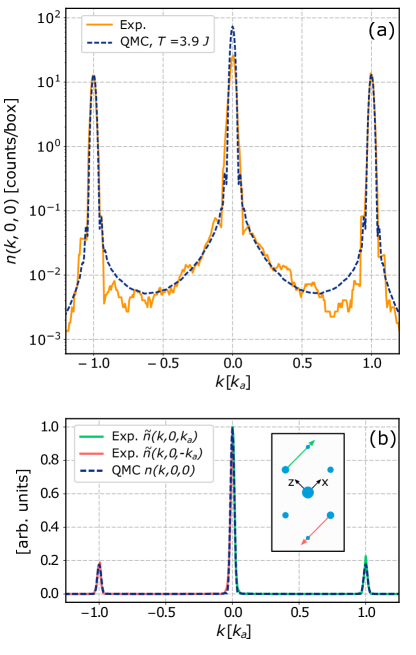
We now turn to the benchmarking of the measured atom distributions . The theoretical framework underlying our experiment is the celebrated Bose-Hubbard Hamiltonian (BHH) trotzky2010 . Equilibrium properties of the BHH at finite temperature can be numerically computed using Quantum Monte-Carlo (QMC) approaches boninsegni2006 . This allows us to compare with ab-initio QMC calculations of the in-trap momentum distribution , without making any assumption about the TOF dynamics occurring in the experiment. In Fig. 2(a) we plot 1D cuts through the 3D distributions, obtained by counting the number of atoms in a box centered at of size with where . The QMC calculations are performed with the experimental parameters, except for the temperature – not measured in the experiment – which is the only adjustable parameter SuppMat . To take into account the efficiency of the detection process, we rescale the experimental data by matching the height of the first-order diffraction peak obtained from the QMC calculations. As shown in Fig. 2(a) we can find a temperature for which the agreement between experiment and numerics is excellent over more than 3 decades in density. Only the amplitude of the peak at is smaller than expected due to a saturation of the Helium detector at large flux of particles fraser1993 . One can avoid this effect by reducing the number of detected atoms per shot, but at the cost of averaging over larger sets of data to maintain a given signal-to-noise for . Interestingly, the 3D detector allows us to measure the relative amplitudes between higher-order diffraction peaks and confirm that the saturation effect is restricted to the central peak only. To do so, we use the translation invariance of the lattice which implies that , where is the Fourier transform of the Wannier function in the lattice. In Fig. 2(b) we plot and find that it compares well with the QMC calculations. The overall excellent agreement between the experiment and the QMC numerics demonstrates that we measure the in-trap momentum distribution in the experiment. In addition, the outstanding resolution () of the Helium detector in 3D makes our apparatus capable of competing with state-of-the-art numerical methods for large systems (here lattice sites).
Obtaining the in-trap momentum distribution in a TOF experiment with interacting particles may be puzzling at first. The expansion of an interacting matter-wave from a lattice of moderate (or higher) amplitude is expected to be ballistic up to small corrections gerbier2008 . This is because the zero-point energy of one site exceeds by far any other energy scale. A low lattice filling at the trap center ensures that the interaction-induced dephasing building up during the TOF can neglected as well kupferschmidt2010 . Our experiment is performed under these conditions and TOF distributions are thus expected to be similar to the in-trap momentum distributions. The excellent match we find over a large dynamical range in density (see Fig. 2) actually shows that the expansion is ballistic up to an excellent approximation and that binary collisions do not affect the far-field distributions within the experimental uncertainties ScattSphere . In the following, we thus use the notation for the measured distributions.
In the correlated superfluid phase, two distinct contributions can be identified in the momentum distribution kato2008 , that of the condensate and that of the depleted atoms (both quantum and thermal depletion),
| (1) |
The condensate has long-range phase coherence and has a Fourier-limited width . On the other hand, is a smoothly varying distribution with a typical momentum width given by the lattice density of state. This results from the population of all quasi-momentum states by the quantum depletion at and by the thermal depletion at non-vanishing temperatures. For large trapped systems, , and thus clearly separate in the momentum space with the condensate manifesting as sharp peaks on top of the broad distribution of depleted atoms kato2008 . In the following we exploit this separation of scales to calibrate the temperature and measure the condensed fraction.
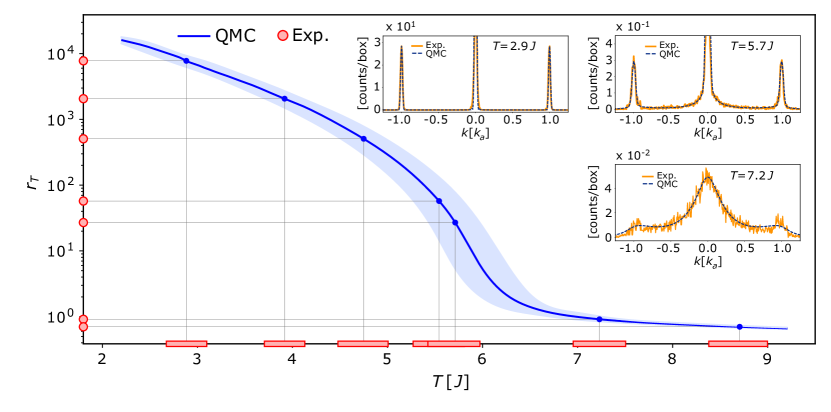
To determine the temperature, we use the comparison with QMC, inspired by the pioneering work of trotzky2010 . Here we measure a single parameter to be matched with QMC numerics. The variation of with obtained from the QMC calculations is shown in Fig. 3. In the regime of the experiment, varies by 4 orders of magnitude when increases only by a factor 3, yielding an unprecedented precision in the calibration of the temperature. Using a controlled heating sequence, we have varied the temperature in the experiment at a fixed SuppMat . By comparing the measured with the thermometry curve we obtain with a 5% uncertainty, limited by the experimental uncertainty on the atom number. In Fig. 3 we also show comparisons of the measured 1D cuts with QMC calculations performed at the temperature obtained from the measurement of . The excellent agreement over the entire range of temperatures validates the thermometry method. The thermometry curve in Fig. 3 applies to the BHH (with our parameters) and is model-dependent. But the central idea of the method – probing low-energy excitations, the population of which strongly varies with the temperature – can be generalized to a large variety of Hamiltonians.
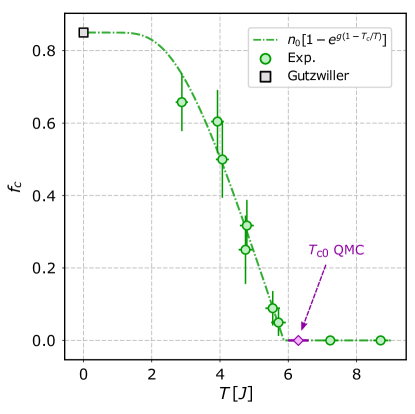
The condensed fraction is a central quantity to investigate finite-temperature phase diagrams fisher1989 . But measuring in many-body systems is challenging as the strong interactions make it difficult to probe single-particle states and access . Techniques like neutron scattering in liquid Helium indeed fail to separate the condensate from the depleted atoms leggett2006 while Bragg spectroscopy in strongly interacting gases necessitates switching off the interactions lopes2017 . Overcoming the difficulties associated to accessing pollet2012 ; ray2013 , our apparatus provides the first direct measurement of in a 3D lattice experiment. We identify the momentum as the momentum where the sharp profile of the condensate separates from , finding SuppMat . The accurate determination of relies on probing far-field distributions in 3D since a finite time-of-flight and/or a column-integration would smoothen the density profile. We then use the full 3D distribution to count the fraction of atoms of the first Brillouin zone contained in a sphere of radius centered on and correcting for the saturation effect SuppMat . We plot as a function of in Fig. 4. In the absence of a theoretical model, we extract the critical temperature using an empirical function ray2013 , obtaining . Our approach allows us to observe the onset of BEC in a deep lattice with unprecedented resolution.
An interesting question is whether a trapped gas can provide information about the phase diagram of homogeneous systems. In our experiment, BEC is expected to first appear at the trap center when is lowered from above trotzky2010 . We thus compare the measured with the critical temperature of a homogeneous lattice gas whose chemical potential matches that at the trap center. is obtained from a QMC approach SuppMat and we find , a value slightly shifted () but compatible with . This observation suggests that our apparatus is suited to explore trap-size scaling and criticality campostrini2009 ; pollet2012 . The direct measure of also opens novel perspectives to investigate many-body quantum phase transitions, e.g. many-body localization in disordered lattices aleiner2010 .
In conclusion, we have demonstrated to measure the 3D momentum distributions of interacting lattice gases with unprecedented accuracy and single-atom resolution. We have shown to estimate the temperature within a few % and to directly measure the condensed fraction. Thanks to single-atom resolution, the Helium detector can in principle access momentum correlations at any order. While its low detection efficiency ( 25%) could be a limitation, momentum correlations up to 6th-order were previously measured in ideal Bose gases dall2013 . In the future, it should thus be possible to probe multiple-particle correlations across quantum phase transitions, to allow for an experimental characterization of the many-body ground-state wave-function undergoing the transition amico2008 or to monitor the dynamics of momentum correlations after a quench chen2011 .
Acknowledgements.
We acknowledge fruitful discussions with A. Aspect, T. Bourdel, M. Cheneau, M. Holzmann, P. N. Ma, L. Sanchez-Palencia, M. Troyer and the members of the Atom Optics group at Institut d’Optique. We acknowledge financial support from the LabEx PALM (Grant number ANR-10-LABX-0039), the International Balzan Prize Foundation (2013 Prize for Quantum Information Processing and Communication awarded to A. Aspect), the Institut Francilien de Recherche sur les Atomes Froids, the ERC Advanced Grant ”SIMCOFE” (FP7/2007-2013 Grant Agreement No. 290464), and the Swiss National Science Foundation through NCCR QSIT. Numerical simulations were performed on the CSCS Mönch cluster. D.C. is a member of the Institut Universitaire de France.References
- (1) I. Bloch, J. Dalibard, S. Nascimbene, Nature Physics 4, 267-276 (2012).
- (2) W. S. Bakr et al., Nature 462, 74-77 (2009).
- (3) J. F. Sherson et al., Nature 467, 68-72 (2010).
- (4) E. Haller et al., Nature Physics 11, 738-741 (2015).
- (5) L. W. Cheuk et al., Phys. Rev. Lett. 114, 193001 (2015).
- (6) M. F. Parsons et al., Phys. Rev. Lett. 114, 213002 (2015).
- (7) G. J. A. Edge et al., Phys. Rev. A 92, 063406 (2015).
- (8) D. Barredo et al., Science 354, 1021 (2016).
- (9) J. W. Bittron et al., Nature 484, 489–492 (2012).
- (10) R. Barends et al., Nature 534, 222 (2016).
- (11) T. Schweigler et al., Nature 545, 323–326 (2017).
- (12) A. J. Leggett, Quantum Liquids – Bose condensation and Cooper pairing in condensed-matter systems, Oxford University Press (2006).
- (13) R. Chang et al., Phys. Rev. Lett. 117, 235503 (2016).
- (14) E. Toth et al., Phys. Rev. A. 78, 013627 (2008).
- (15) D. Chen, M. White, C. Borries and B. DeMarco, Phys. Rev. Lett. 106, 235304 (2011).
- (16) L. Pollet, Rep. Prog. Phys. 75, 094501 (2012).
- (17) F. Gerbier et al., Phys. Rev. Lett. 101, 155303 (2008).
- (18) J. Kupferschmidt and E. Mueller, Phys. Rev. A 82, 023618 (2010)
- (19) W. Vassen et al., Rev. Mod. Phys. 84, 175-210 (2010).
- (20) See Supplemental Material.
- (21) Q. Bouton et al., Phys. Rev. A 91, 061402(R) (2015).
- (22) F. Nogrette et al., Rev. Scient. Instrum. 86, 113105 (2015).
- (23) M. Boninsegni et al., Phys. Rev. Lett. 96, 070601 (2006).
- (24) L. Fraser et al., Nuclear Instrument and Methods in Physics Research A 327, 328-336 (1993).
- (25) Although the atomic density is measured over several decades, a collisional halo associated to two-body collisions can not be identified in the measured distributions presented here. In a regime radically different from that of this work, i.e. at low lattice amplitude () and large lattice filling ( atoms/site), faint collisional halos are visible. Their characterization will be the object of a future work.
- (26) Y. Kato et al., Nature Physics 4, 617-621 (2008).
- (27) S. Trotzky et al., Nature Physics 6, 998-1004 (2010).
- (28) M. P. A. Fisher, P. B. Wiechman, G. Grinstein and D. S. Fisher, Phys. Rev. B 40, 546 (1989).
- (29) R. Lopes et al., Phys. Rev. Lett 199 190404 (2017).
- (30) U. Ray and D. M. Ceperley, Phys. Rev. A 87 051603 (2013)
- (31) M. Campostrini and E. Vicari, Phys. Rev. Lett. 102, 240601 (2009).
- (32) R. B. Diener, Q. Zhou, H. Zhai, and T.-L. Ho, Phys. Rev. Lett. 98, 180404 (2007).
- (33) F. Gerbier et al., Phys. Rev. Lett. 95, 050404 (2005).
- (34) I. L. Aleiner and B. L. Altshuler and G. V. Shlyapnikov, Nat. Phys. 6, 900-904 (2010).
- (35) R. G. Dall et al., Nat. Phys. 9, 341-344 (2013).
- (36) L. Amico, R. Fazio, A. Osterloh and V. Vedral, Rev. Mod. Phys. 80, 517–576 (2008).
I Supplemental material
I.1 Experimental Sequence
Almost pure BECs of about atoms in the state , are initially prepared in a crossed optical trap (ODT) as described in bouton2015 . We adiabatically load the BEC in the lowest energy band of an optical lattice made of three pairs of counter-propagating laser beams derived from a high-power laser source at telecom wavelength 1550 nm (Keopsys CEFL-KILO Series 15W). The lattice beams are turned on with a ms-long exponential ramp with characteristic time ms. Meanwhile, the crossed dipole trap is switched off with an exponential ramp of duration 80 ms and ms. The final trapping frequencies are given by the gaussian shape of the lattice beams and equal to Hz. In order to test the adiabaticity of the process we revert the loading procedure and check that the BEC possess no discernible thermal fraction.
The atoms are left in the optical lattice for a variable holding time (depending on the presence or not of the heating procedure) after which all laser beams are switched off and the cloud expands under gravity for a free fall of 50 cm. During the first of expansion we rapidly transfer a variable fraction of atoms to the non-magnetic state , with a resonant RF pulse ( MHz). We then apply a magnetic gradient to push the atoms remaining in the states away from the detector. The RF pulse power, combined with its time duration allows us to control the flux of atoms () reaching the detector. We typically operate between 1 and RF transfer efficiency, the latter being chosen for the datasets at higher temperature () for which the atomic samples are more dilute. For the low temperature gases where the momentum density spans several orders of magnitude, we reconstruct the 1D profiles from merging low and high flux data as introduced in chang2016 .
I.2 Calibration of the single-atom Helium detector
The Helium detector is made of a pair of Micro-Channel Plates (Burle Industries, channel diameter m, center-to-center spacing m, angle of the channel ) mounted onto a crossed delay-line anode (Roentdek DLD80). The electronic pulses at the four ends of the delay line are amplified and converted into NIM pulses with dedicated constant fraction discriminators (Roentdek company). The digital coding of the arrival times is obtained thanks to a home-made time-to-digital converter described in nogrette2015 .
To calibrate the efficiency of the Helium detector we have used dilute thermal clouds released from an harmonic optical dipole trap. The atom number in the thermal clouds is first measured by absorption imaging with a 10 accuracy. We then monitor the detected atom number on the Helium detector as a function of the radio-frequency amplitude and duration. We have found a detection efficiency of the Helium detector equal to .
The accuracy with which the position of an atom is reconstructed with the Helium detector has different origins in the plane of the MCPs and orthogonally to the MCP surface. The in-plane accuracy is limited by electronic noise and jitters and we have calibrated it by measuring a quantity that we have shown to provide a quantitative answer nogrette2015 . We have measured an in-plane resolution of m corresponding to . The accuracy along the axis of gravity, orthogonal to the MCP surface, is limited by the geometry of the micron-size channels of the MCP. A measure of this vertical resolution is difficult but an upper limit can be obtained assuming an equal detection efficiency over the entire aperture of the channels. It yields an upper value equal to .
When the atomic flux on the Helium detector is too high, the micro-channels do not have enough time to reload properly, leading to lower detection efficiencies. This saturation of the MCP is a complex and long-standing phenomena fraser1993 . In our experiment, we observe a saturation for local fluxes of a few MHz/cm2. For the parameters we use, only the central diffraction peak is affected by this saturation, which leads to a suppression of the atom density around . The side-peaks are instead not saturated, thanks to the envelope of the Wannier function which decreases the local flux of particles by a factor of 0.17 for a lattice depth . This is confirmed in Fig. 2b where is shown to be in excellent agreement with the QMC calculations.
I.3 Reaching the far-field regime of expansion
To test the validity of the far-field approximation when using the Helium detector, we have investigated the time-of-flight dynamics of lattice BECs. The latter yields an interference pattern that can be pictured by considering the lengths and associated to the trapped BEC, giving rise to momentum components and respectively. The momentum is associated with the distance between diffraction peaks in the interference pattern and to the width of these peaks. As larger momenta develop faster during TOF, the diffraction peaks quickly separate. On the contrary, it takes longer for the width to establish. The far-field regime is reached when all momentum scales are fully developed, which happens after a TOF that can be expressed in terms of the smallest momentum component, gerbier2008 . To monitor the relative dynamics of the momentum scales and , one can measure the ratio of the RMS peak size to the peak-to-peak separation as a function of . In far-field where the interference pattern is fully developed, the ratio should be constant and proportional to .
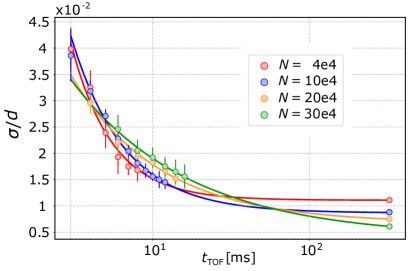
In the experiment, we let the the cloud expand for a varying TOF and it is probed using two methods. At short TOF (from 2 to ms) we take 2D absorption images. After a long TOF of ms, we use the Helium detector. As shown in Fig. S1, we observe that indeed saturates at long TOF, after a fast decrease at short TOF. In addition, we have further verified the variation with the system size (at fixed ) by increasing the atom number in the condensate to increase . As expected, we observe that, the smaller the system size , the faster the initial TOF dynamics and the larger the final value (see Fig. S1). For atoms we find that ms is much shorter than ms, indicating that the distributions measured by the Helium detector is in far-field.
I.4 Heating sequence
To vary the temperature in the lattice, we have used a controlled heating sequence. After loading the BEC in the lattice, a series of non-adiabatic pulses of ms duration each is performed with one of the lattice beams. The number of pulses (from 5 to 10) and their amplitude are varied to obtain different final temperatures in the lattice while keeping the number of atoms constant. After the pulse sequence, the cloud is left to thermalize for a time interval of ms (). By exploiting a band mapping technique we have verified that no discernible fraction of atoms is transferred to higher lattice bands.
I.5 QMC calculations
Exact thermodynamic properties of interacting lattice bosons can be studied using Quantum Monte Carlo (QMC) methods. In this work we have used the worm algorithm QMC, following the scheme of Pollet et al. pollet2007 .
The main idea of this approach is to consider a stochastic representation of the partition function , with is the inverse temperature, and is the Bose-Hubbard Hamiltonian. The starting point is to decompose the Hamiltonian into two terms: and , and consider the Dyson series for the partition function:
where is the time-evolved in the interaction representation. Each of the terms in the Dyson series are then sampled stochastically, using an extended configuration space including open world lines (the so-called “worm”).
This approach also allows to measure efficiently the equal-time, two-particle Green function , for pairs of sites and . The momentum distribution for the trapped system is then obtained as:
where is the Fourier transform of the Wannier function associated to the optical lattice, and
where denotes the coordinate of the th lattice site. In our simulations, we have fixed the total chemical potential in the system in order to match the estimated experimental value for the total number of particles in the system.
For the homogeneous lattice gas (i.e. in the absence of a trapping potential, and considering a cubic box with periodic boundary conditions) we have determined the transition temperature for the superfluid transition through the winding number estimator of the superfluid density ceperley1995 . In this case the chemical potential has been fixed to match the chemical potential estimated at the center of the trap for the experimental configuration. Our calculations were performed using an updated version of the DWA code in the ALPS library alps2007 ; alps2011 .
I.6 Extracting the condensed fraction
As explained in the main text, the inequality allows us to distinguishing the condensate contribution from that of the depletion . The condensate consists in sharp peaks of size and measuring the condensed fraction thus amounts to measuring the atom number in the condensate peaks with respect to the total atom number , . Here we make the assumption that with the number of condensed atoms and . This also relies on the inequality which ensures that the fraction of depleted atoms contained in the sharp peaks is extremely low, of order .
To identify the momentum which delimits the two contributions to we focus on the first diffracted peak that is not affected by saturation effects of the detector. We fit 1D profiles with a Gaussian centered at on top of a power-law. We defined as the momentum where these two fitted distributions intersect, as illustrated in Fig. S2(a). The large dynamical range in density provided by the Helium detector is of primary importance to accurately fit the tails associated to the depletion of the condensate and identify accurately. A similar approach would result difficult from column-integrated images as obtained when probing quantum gases with absorption imaging. In Fig. S2(b), we plot as a function of the temperature . For , one can not identify a double structure with an abrupt change of slope (see experimental profiles at in Fig. 3) and we set .
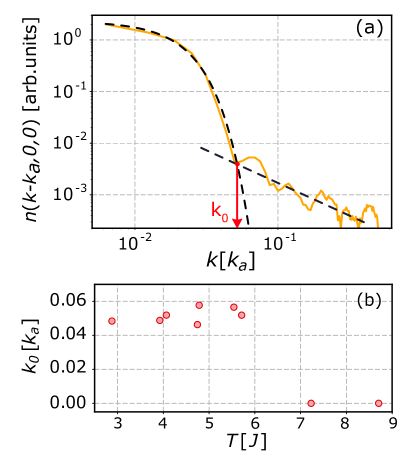
Since the momentum distribution is translation invariant (up to an envelop factor given by the Fourier transform of the Wannier function), we extract by considering a single Brillouin zone only. In the 3D distributions, we count the atom number in the central peak and the atom number in the first Brillouin zone . To take into account the saturation of the detector around , the measured atom number in the central peak is multiplied by a scaling factor obtained from the amplitude of the first-order diffracted peak, . We then calculate .
References
- (1) L. Pollet, K. V. Houcke and S. M. A. Rombouts, Journal of Computational Physics 225, 2249–2266 (2007).
- (2) D. Ceperley, Reviews of Modern Physics 67, 279–355 (1995).
- (3) A. F. Albuquerque et al., Journal of Magnetism and Magnetic Materials 310, 1187-1193 (2007).
- (4) B. Bauer et al., Journal of Statistical Mechanics: Theory and Experiment, P05001 (2011).