EPJ Web of Conferences \woctitleLattice2017 11institutetext: Faculty of Pure and Applied Sciences, University of Tsukuba, Tsukuba, Ibaraki 305-8571, Japan 22institutetext: Center for Computational Sciences, University of Tsukuba, Tsukuba, Ibaraki 305-8577, Japan 33institutetext: RIKEN Advanced Institute for Computational Science, Kobe, Hyogo 650-0047, Japan 44institutetext: Department of Physics, Hiroshima University, Higashi-Hiroshima, Hiroshima 739-8526, Japan
Comparison of different source calculations in two-nucleon channel at large quark mass
Abstract
We investigate a systematic error coming from higher excited state contributions in the energy shift of light nucleus in the two-nucleon channel by comparing two different source calculations with the exponential and wall sources. Since it is hard to obtain a clear signal of the wall source correlation function in a plateau region, we employ a large quark mass as the pion mass is 0.8 GeV in quenched QCD. We discuss the systematic error in the spin-triplet channel of the two-nucleon system, and the volume dependence of the energy shift.
1 Introduction
We carried out an exploratory study of the direct calculation of the binding energy of the light nuclei with the atomic mass number less than or equal to four in quenched lattice QCD Yamazaki:2009ua ; Yamazaki:2011nd . These studies were followed by several calculations Beane:2011iw ; Beane:2012vq ; Yamazaki:2012hi ; Berkowitz:2015eaa ; Yamazaki:2015asa ; Orginos:2015aya ; Wagman:2017tmp . All the recent calculations at GeV, which were obtained from the calculations with the exponential or gaussian source, suggest the existence of a bound state in the two-nucleon channels.
HALQCD Iritani:2016jie suggested that there is a sizable systematic error in the energy shift in the two-nucleon channels obtained from the ratio of the correlation functions. They compared the two results with the exponential and wall sources, and found discrepancies in the effective energy shifts. However, it is well known that the wall source needs the longest temporal extent to obtain a plateau even in the single nucleon mass. In this comparison a high precision calculation is necessary.
The purpose of this work is to investigate the systematic error coming from excited states by comparing the exponential and wall source calculations in the spin-triplet two-nucleon channel in a high precision calculation using a large quark mass of GeV in the quenched approximation. To determine a plateau of the ratio of the correlation functions, we focus on an important condition in the direct calculation, which will be explained below, though it is trivial in lattice QCD calculation. The results in this report are the updated ones from the last conference Yamazaki:2017euu . All the results in this report are preliminary.
2 Important condition of direct calculation
In the direct calculation Yamazaki:2009ua ; Yamazaki:2011nd ; Beane:2011iw ; Beane:2012vq ; Yamazaki:2012hi ; Berkowitz:2015eaa ; Yamazaki:2015asa ; Orginos:2015aya ; Wagman:2017tmp of the two-nucleon channel, the energy shift with the nucleon mass and two-nucleon ground state energy is determined from a plateau region of the ratio of the correlation functions with the two-nucleon correlation function in the spin-triplet channel and the single nucleon correlation function . An important condition of this determination is that should be determined in a region where both and have each plateau. It means that it is not enough to determine a plateau region from only , but we need to investigate plateaus for and .
If one chooses a plateau from only , it might cause an incorrect determination of , as discussed in the later sections. For example, when statistics is not enough, using the wall source has a plateau like behavior in early region, where and do not have plateaus.
In the following sections, we shall call the minimum of the plateau region for , , and as , , and , respectively, using the source (exponential) or (wall).
3 Simulation parameters
We calculate the two-nucleon correlation function in the spin-triplet channel as well as the single nucleon correlation function in the quenched approximation. In this calculation, we employ Iwasaki gauge action at , corresponding to fm AliKhan:2001tx . The quark propagators are calculated with a tad-pole improved Wilson action with at corresponding to GeV and GeV. The actions and parameters are the same as in our previous works Yamazaki:2009ua ; Yamazaki:2011nd . The temporal lattice size is fixed to 64, while the spatial size is chosen to be 16, 20, and 32.
In order to compare results with different source operators, we employ the exponential and wall sources. The exponential source at the time slice is defined by
| (1) |
where is the local quark field. The parameters and are chosen to obtain an early plateau of the effective nucleon mass on each volume. At the sink time slice, each nucleon operator is projected to zero momentum using the local quark field as in our previous calculations Yamazaki:2011nd ; Yamazaki:2012hi ; Yamazaki:2015asa . The number of the measurement of the correlation functions is tabulated in Table 1.
| 16 | 20 | 32 | |
|---|---|---|---|
| Exp | 6,272,000 | 5,504,000 | 4,736,000 |
| Wall | 8,307,200 | 8,960,000 | 4,473,600 |
4 Results
In this section we present the results for twice the effective nucleon mass , the effective two-nucleon energy , and the effective energy shift evaluated from , , and , respectively, on each volume. The volume dependence of is also presented.
4.1
First we present the results of , , and in both the exponential and wall sources on as a typical result.
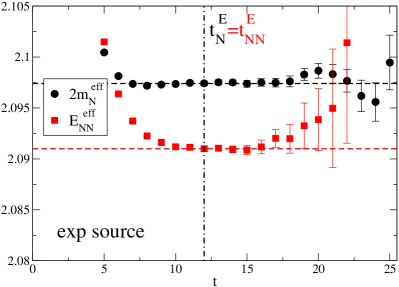
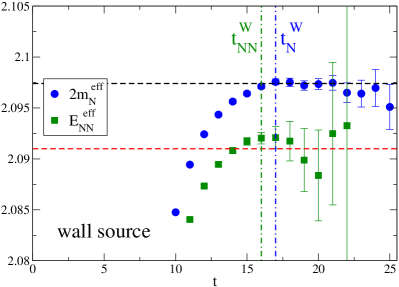
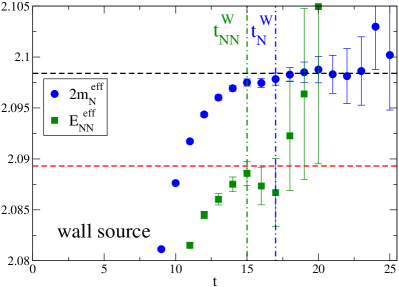
Figure 1 shows the results for and using the exponential (left panel) and wall (right panel) sources. The results of the exponential source have plateaus, which start from as denoted by vertical dot-dashed line in the left panel. It means that in this case. The horizontal dashed lines in black and red represent the values of the plateaus for and , respectively.
The wall source results need longer than the exponential source to have plateaus as shown in the right panel of Fig. 1. We determine and from each plateau region, which are expressed by vertical dot-dashed lines. The same horizontal lines as in the left panel are shown in the right panel. Those lines are in good agreement with each plateau.
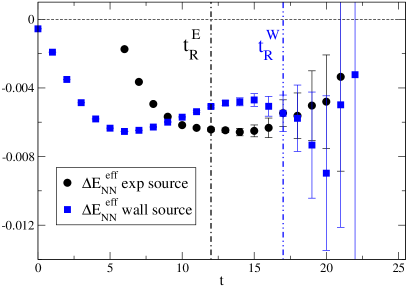
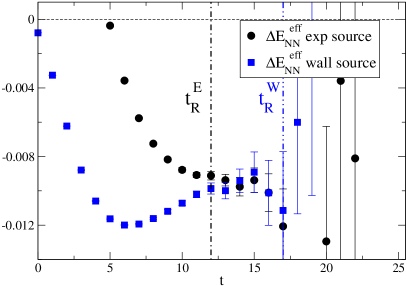
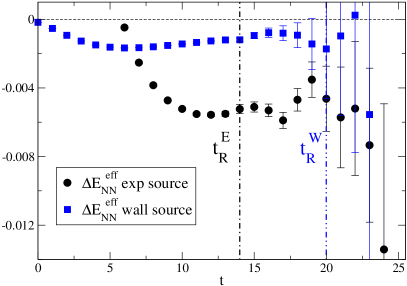
As discussed in Sec. 2, , the minimum of the plateau region of , should be larger or equal to and . Thus, , and , in this case. Figure 2 presents that of the exponential source has a reasonable plateau after . On the other hand, the result of the wall source has a non-monotonic dependence in .
One might choose , if it is determined from only the wall source data in Fig. 2. Moreover, if the statistics is much smaller than the current calculation, the data around would be also regarded as a plateau. However, the data in the small region contain excited state contributions as shown in the right panel of Fig. 1. It suggests that it is easy to mistake the plateau region, when it is determined from only , especially in the case where has a non-monotonic dependence, like the wall source data in the current study.
In the wall source, while the data in has the large error, it agrees with the plateau value of the exponential source within the error.
 |
 |
4.2
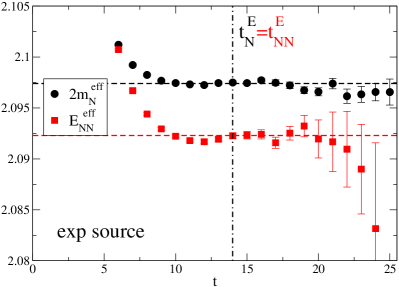
The results for and using the exponential and wall sources are plotted in the left and right panels of Fig. 3, respectively. The results are similar to the ones on in the previous subsection. The data of the exponential source have plateaus, which start from , and the ones of the wall source need longer to have plateaus. It is noted that comparing with the results on and 16 we observe 0.02% finite volume effect in on this volume of the spatial extent fm.
The results of are shown in Fig. 4. The exponential source has a reasonable plateau after as in the case. The dependence of the wall source in the smaller region becomes larger as the volume decreases comparing with the result in Fig. 2. While the error of the wall source is large after , the data is consistent with the plateau value of the exponential source.
It is noted that on the consistent results with the exponential and wall sources are not obtained even in , when the number of the measurement of the wall source is half of the current calculation. This suggests that a huge statistics is necessary to obtain statistically stable result from the wall source even in the single nucleon mass.
 |
 |
4.3
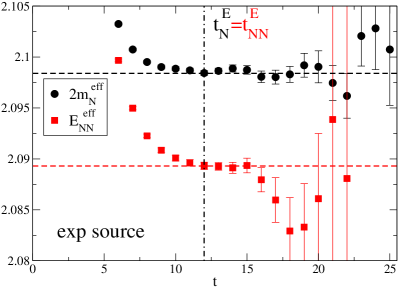
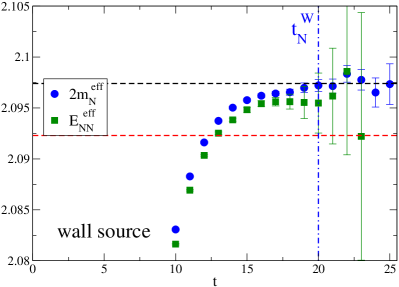
The left panel of Fig. 5 presents that the results for and with the exponential source are similar to the ones in the and 20 cases.
On the other hand, the wall source results look different from the ones on the other volumes. The result of with the wall source in is larger than the one with the exponential source represented by the red dashed line. One of the reasons is that the contribution of the two-nucleon scattering state with almost zero relative momentum, which corresponds to the first excited state in this system, becomes relatively larger than the one of the ground state in with the wall source as the volume increases. Another reason is that the energy of the first excited state is larger than in this system, where one bound state exists Yamazaki:2011nd . Thus, it is harder to obtain the same plateau as the one of the exponential source, expressed by the red dashed line in the right panel of Fig. 5, from the wall source as the volume increases. From the data, we cannot determine of the wall source. In the following analysis, it is assumed that in the wall source result.
From the above reasons, it is expected that on much larger volumes than the current calculation of the wall source would become larger than in a large region. Then, it would go down to agree with the plateau value of the exponential source in much larger region.
Figure 6 shows the results of with both the sources. It is surprising that the wall source result has a mild dependence in the small region, although the data for and largely depend on in the same region as shown in the right panel of Fig. 5. If a plateau of is determined from only the wall source data in smaller statistics than the present calculation, one might choose much smaller region as a plateau than .
While it is not as good as the smaller volumes, we observe a plateau after in the exponential source result on this volume. Although the wall source result has large error after , it is not inconsistent with the plateau of the exponential source. We expect that the plateau of with the wall source is obtained in a region of the much larger than the smaller volumes. In order to confirm this expectation, it is an important future work to observe clear signal of the wall source after .
From the comparisons including the ones in the smaller volumes, we conclude that the results using the exponential and wall source are consistent with each other in each plateau region. Thus, contaminations of excited states in obtained from the plateau region are negligible in our calculation.
 |
 |
4.4 Volume dependence
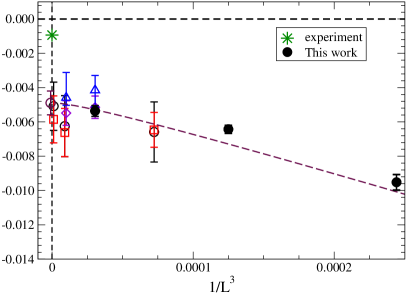
The result of on the three volumes with the exponential source are plotted in Fig. 7 together with our previous result Yamazaki:2011nd . We neglect the wall source data in the following due to the much larger error. The result of the current calculation denoted by the filled circle has much smaller statistical error, and is reasonably consistent with the fit curve using the previous data, so that the result indicates that the existence of a bound state in this system.
Recently HALQCD Collaboration suggested that the volume dependence of obtained from the direct calculation is too small comparing to the one expected from the effective range expansion Iritani:2017rlk . However, this argument is assumed that the effective range expansion is valid in region in the continuum theory, and there is no finite volume effect in the two-nucleon interaction. In the comparison between the expectation in the ideal case and the lattice data, there could be several sources of systematic errors, such as finite lattice spacing and finite volume effects, which may deform the two-nucleon interaction. In order to understand the current situation, it is an important future work to investigate such systematic errors in the calculation.
It is noted that even if there is a finite volume effect in , which cannot be treated by the finite volume method Luscher:1986pf ; Luscher:1990ux , we consider that the signal of the existence of the bound state is meaningful in our calculation, because we discuss the existence in the infinite volume limit, so that our result does not contain the finite volume effect.
5 Summary
We have carried out the high precision calculation of the spin-triplet two-nucleon channel at the large quark mass, corresponding to GeV in the quenched approximation to investigate a systematic error of coming from excited states by comparing the results with the two different source calculations using the exponential and wall sources on the three volumes. Though it might be a trivial, we discuss the important condition to calculate . When the condition is satisfied, the two sources give the consistent results of in each plateau region, while the wall source data has the large error due to the late plateau. From this comparison, we have concluded that the systematic error from higher excited states is negligible in our calculation.
There are several important future works, such as comparing the current result with the one obtained from the generalized eigenvalue problem Luscher:1990c , and investigations of systematic errors in . It is also an important future work to clarify the qualitative difference between the direct calculation and HALQCD method in the point of view of the definitions of the scattering amplitude in quantum field theory and quantum mechanics Yamazaki:2017gjl .
Acknowledgements
Numerical calculations for the present work have been carried out on the FX10 supercomputer system at Information Technology Center of the University of Tokyo, on the COMA cluster system under the “Interdisciplinary Computational Science Program” of Center for Computational Science at University of Tsukuba, on the Oakforest-PACS system of Joint Center for Advanced High Performance Computing, on the computer facilities of the Research Institute for Information Technology of Kyushu University, and on the FX100 and CX400 supercomputer systems at the Information Technology Center of Nagoya University. This research used computational resources of the HPCI system provided by Information Technology Center of the University of Tokyo through the HPCI System Research Project (Project ID: hp160125). We thank the colleagues in the PACS Collaboration for providing us the code used in this work. This work is supported in part by Grants-in-Aid for Scientific Research from the Ministry of Education, Culture, Sports, Science and Technology (No. 16H06002).
References
- (1) T. Yamazaki, Y. Kuramashi, A. Ukawa (PACS-CS Collaboration), Phys. Rev. D81, 111504 (2010)
- (2) T. Yamazaki, Y. Kuramashi, A. Ukawa (PACS-CS Collaboration), Phys. Rev. D84, 054506 (2011)
- (3) S. Beane et al. (NPLQCD Collaboration), Phys. Rev. D85, 054511 (2012)
- (4) S. Beane, E. Chang, S. Cohen, W. Detmold, H. Lin et al. (NPLQCD Collaboration), Phys.Rev. D87, 034506 (2013)
- (5) T. Yamazaki, K.i. Ishikawa, Y. Kuramashi, A. Ukawa, Phys. Rev. D86, 074514 (2012)
- (6) E. Berkowitz, T. Kurth, A. Nicholson, B. Joo, E. Rinaldi, M. Strother, P.M. Vranas, A. Walker-Loud (CalLat Collaboration), Phys. Lett. B765, 285 (2017)
- (7) T. Yamazaki, K.i. Ishikawa, Y. Kuramashi, A. Ukawa, Phys. Rev. D92, 014501 (2015)
- (8) K. Orginos, A. Parreno, M.J. Savage, S.R. Beane, E. Chang, W. Detmold (NPLQCD Collaboration), Phys. Rev. D92, 114512 (2015)
- (9) M.L. Wagman, F. Winter, E. Chang, Z. Davoudi, W. Detmold, K. Orginos, M.J. Savage, P.E. Shanahan (2017), 1706.06550
- (10) T. Iritani et al. (HALQCD Collaboration), JHEP 10, 101 (2016)
- (11) T. Yamazaki, K.I. Ishikawa, Y. Kuramashi, A. Ukawa (PACS), PoS LATTICE2016, 108 (2017)
- (12) A. Ali Khan et al. (CP-PACS Collaboration), Phys. Rev. D65, 054505 (2002)
- (13) T. Iritani, S. Aoki, T. Doi, T. Hatsuda, Y. Ikeda, T. Inoue, N. Ishii, H. Nemura, K. Sasaki, Phys. Rev. D96, 034521 (2017)
- (14) M. Lüscher, Commun. Math. Phys. 105, 153 (1986)
- (15) M. Lüscher, Nucl. Phys. B354, 531 (1991)
- (16) M. Lüscher, U. Wolff, Nucl. Phys. B339, 222 (1990)
- (17) T. Yamazaki, Y. Kuramashi (2017), 1709.09779