Astrophysics (the English translation of Astrofizika), Vol. 59, pp. 475—483,
2016
DOI: 10.1007/s10511-016-9450-9
ORIGIN OF THE BLUE CONTINUUM RADIATION IN THE
FLARE SPECTRA OF dMe STARS111The brief version of this article has been published in the Proceedings of the conference in honor of the 100th birthday of Academician V. V. Sobolev (St. Petersburg, September 21—25, 2015), pp. 219—221.
E. S. Morchenkoa,b
Calculations of the emission spectrum of a homogeneous plane layer of pure hydrogen plasma taking into account nonlinear effects (the influence of bremsstrahlung and recombination radiation of the layer itself on its Menzel factors) [9] show that the blue component of the optical continuum during the impulsive phase of large flares on dMe stars originates from the near-photospheric layers [1]. The gas behind the front of a stationary radiative shock wave propagating in the red dwarf chromosphere toward the photosphere is not capable of generating the blackbody radiation observed at the maximum brightness of the flares.
Keywords: red dwarf stars: flares: models of flares: plane layer: impulsive heating
1. Introduction. Grinin and Sobolev [1]
were the first to show that the optical conti-
nuum
emission during the impulsive phase of large flares on dMe stars
arises in the ‘‘transition region between the chromosphere and the
photosphere.’’ The near-photospheric layers are heated by
beams of high-energy () protons
[2, 3] or/and () electrons
[4]. The initial energy fluxes (‘‘at the upper boundary of the flare
region’’ [2]) in the proton and electron beams are
and
,
respectively.
Katsova et al. [5] and Livshits et al. [6]222In the part examining the nature of the optical continuum of stellar flares, the study [6] gives a brief discussion of work of Katsova et al. [5]. were the first to examine the hydrodynamic response of the chromosphere of a red dwarf to impulsive heating by a high-power beam of accelerated electrons (a low-energy cutoff , a spectral index , ). In solving a single-temperature333, where is the electron temperature and is the ion one. system of gas dynamics equations ‘‘with the given boundary and initial conditions and the calculated loss and heating functions‘‘ [5], they found that two disturbances ‘‘propagate downward and upward‘‘ [5] ‘‘from the formed zone of high pressure‘‘ [6]. The disturbance propagating toward the photosphere (‘‘downward’’ [5]) ‘‘is described in subsequent times by a solution of the type of the second-kind temperature wave [7].‘‘ ‘‘The latter is characterized by a subsonic-velocity propagation of the thermal wave [temperature jump]‘‘ [6], ‘‘in front of which a [non-stationary] shock wave …‘‘ develops [5].
In these papers [5, 6] it was assumed that a region of thickness between the temperature jump and the shock front (referred to below as a chromospheric condensation) is the source of quasi-blackbody radiation at wavelengths around 4500 Å (see Fig. 4 in [5] and identical Fig. 8 in [6]). Katsova et al. [5] and Livshits et al. [6] note (pp. 162—163 in [5] and p. 281 in [6]) that the physical parameters of the chromospheric condensation (, , where is the atom-ion temperature) are in the range of the parameters of a plane layer in the model of Grinin and Sobolev [1] (, , ). Here is equal to the sum of the hydrogen atom and proton concentrations. The chromospheric condensation [5], however, lies at a height of [5, 6] above the level of the quiescent photosphere of a red dwarf, i.e., much higher than the homogeneous plane layer [1].
The non-stationary shock wave [5] propagates in the partially ionized gas of the chromosphere of a red dwarf toward the photosphere at a velocity of up to 100 km/s (see Eqs. (A1), (A2) and Fig. 7 in [6]). The electron and atom-ion components of the chromospheric plasma are heated differently behind the shock front [5],444The velocities of the flow are subsonic for electrons, but supersonic for the ions and atoms [8]. i.e., it is true that the atom-ion temperature of the post-shock gas [5] is considerably higher than its electron temperature:
| (1) |
(with the exception of the dense layers near the photosphere [1]). As a result, the region between the temperature jump and the shock front [5] is, in fact, a two-temperature region .
In [9] the emission spectrum of a two-temperature (, ) motionless homogeneous plane layer of pure hydrogen plasma () has been calculated taking into account the influence of bremsstrahlung and recombination radiation of the layer itself on its Menzel factors. This layer is located behind the front of a stationary plane-parallel radiative shock wave (we use a frame of reference in which the shock front is at rest). In [9] the value of at which the intensity of the continuum spectrum approaches the Planck function was determined.
From the start we have assumed that the optical depth in the resonance transition in the center of the layer, , is approximately equal to . The corresponding layer thickness, , was introduced according to this condition (p. 2 and Eq. (53) in [9]). The transition from a transparent gas to a gas whose continuum emission is close to the Planck function was, however, subsequently examined for the layer of a fixed thickness (see the first paragraph in section 7 in [9]). We have also assumed (the last paragraph in section 8) that radiative cooling of the partially ionized gas heated at the front of a stationary shock wave can create a zone that is responsible for the blue component of the optical continuum of stellar flares.
The present paper shows that the blackbody radiation observed at the maximum brightness of strong flares on dMe stars (the blue component of the optical continuum) originates from the deep (near-photospheric) layers [1]. Various approaches for explaining the spectral observations are analyzed for this purpose: the model of Grinin and Sobolev [1], the model of a second-kind temperature wave [5, 6], and the model of a plane-parallel radiative shock wave propagating with a constant velocity in the red dwarf chromosphere toward the photosphere.
2. Continuous spectrum. We will show that the calculated intensities of continuous radiation from two- [9] and single-temperature [1] homogeneous plane layers are similar if:
(a) the electron temperature lies in the range , and
(b) the optical depth at a resonance transition is
| (2) |
or more. Here is the absorption coefficient at the center of the Doppler core of the line (the value of is defined by Eq. (53) in [9]).
Since , photons leave the plasma in the far wings of the spectral line (p. 6 in [9]). For this reason the mean escape probability, , for a photon of the resonance transition is independent of the atom-ion temperature of the gas:
| (3) |
(see Eqs. (55), (53), and (43) in [9]). Here is the corresponding Stark broadening parameter, is the Holtsmark field strength, and is the Doppler half-width. Thus, the Menzel factors and, therefore, the intensity of the continuous radiation from the layer [9] do not explicitly depend on the atom-ion temperature.555A weak dependence of the Menzel factors on is caused by the parameter in Eq. (56) of study [9].
Solution of the balance equations for the populations of the levels shows [9] that the Menzel factors differ little from unity so that the source function . This result remains true when . Grinin and Sobolev [1] begin with the assumption of thermodynamic equilibrium in the dense gas of a stellar flare: (Eq. (9) in [1]).
Taking into account that the Gaunt factors for bremsstrahlung and photoionization absorption in the optical range are on the order of unity (e.g., [10], pp. 16—18) and that the number of attainable atomic levels is high,666For an electron density , the number of the level defining the boundary of the visible continuum is 13 (the Inglis-Teller relation). we find that the radiation intensities calculated using Eq. (25) in [9] and Eq. (9) in [1] are close, with
| (4) |
where
| (5) |
is the bremsstrahlung absorption coefficient (see Eq. (29a) in [9]). The sum is taken over all levels for which the threshold photoionization frequency ; then .777It is evident that the exponent “39” in Eq. (4) of study [1] should read “-39;” and the temperature should be raised to a power of “-1/2.”
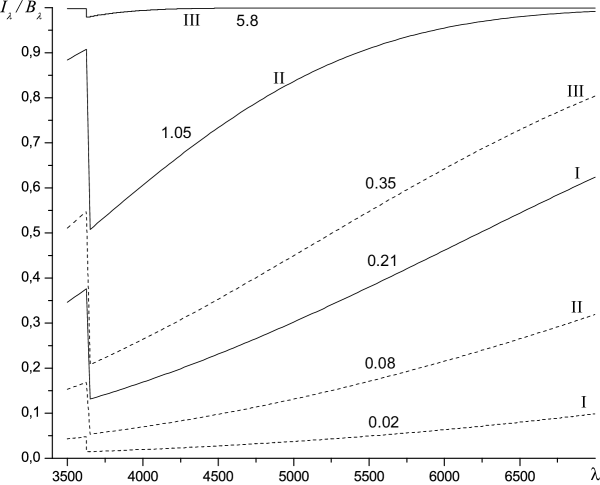
Katsova et al. [5] and Livshits et al. [6] give the following physical parameters of the source of quasi-blackbody radiation at wavelengths around 4500 Å: , , . It is easy to see that the corresponding single-temperature () homogeneous plane layer cannot generate the small Balmer jump (the bottom curve of Fig. 1).888Here, as in [5, 6], we use the model of a homogeneous plane layer to calculate the radiation intensity from the chromospheric condensation [5]. The validity of such approach is not discussed in this paper. Evidently, this layer also cannot explain the blue continuum radiation observed at the maximum brightness of strong flares, since the gas inside the layer [5] is transparent in the continuous spectrum (the optical depth at wavelength is [9]).
On the other hand, emission from a denser gas with the same layer thickness can explain well both the observed color indices of strong flares and the small size of the Balmer jump [1].
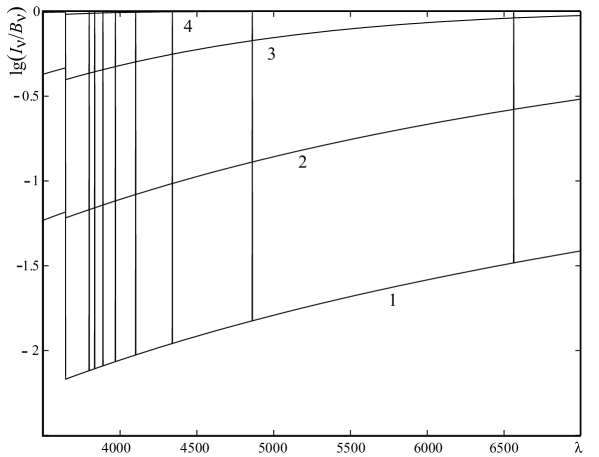
In order to verify these statements, let us calculate the value of for a homogeneous plane layer with . Table 1 shows the results. The equilibrium electron concentration, , is calculated according to the Saha equation. The values of and are obtained from Eq. (12) in [9] and Eq. (5) of the present article, respectively. From this table, it follows that the layer with , generates the blackbody-like continuum in the blue-visible region of the spectrum at .999 .
| 9000 | 10 | 16 | |||
| 9000 | 10 | 15 | |||
| 9000 | 10 | 14 | 0.255 | ||
| 9000 | 10 | 12 | 2.65 |
In the model [5] the formation of the chromospheric condensation with the necessary thickness occurs only when the shock front enough widely separates from the temperature jump (see Fig. 8 in [6]). At earlier times the geometric thickness of the gas layer [5] , since the temperature jump moves at a subsonic velocity. The plane layer with a smaller thickness is still more transparent in the optical continuum.
We note that for the layer with and , a comparatively small Balmer jump can be obtained only for a near-photospheric concentration (see the lower curve labeled III in Fig. I). A slight increase in temperature () leads to a reduction in the required concentration (see the top curve for ).
The homogeneous plane layer with , , and provides the blue continuum radiation from a stellar flare (the top curve in Fig. 1). Fig. 2 also demonstrates that for , , and the layer thickness , the emission lines are entirely ‘‘sunk’’ in the continuous spectrum. These concentrations, temperatures, and thicknesses of the blackbody radiation sources lie within the range of parameters for a pure hydrogen plasma layer in the model of Grinin and Sobolev [1]. In a study of the fine time structure of two flares on AD Leo, Lovkaya [11] has found that at the maximum brightness these two flares radiated as absolute black bodies with temperatures of approximately and . Based on a detailed colorimetric analysis, Zhilyaev et al. [12] have determined a temperature for the blackbody radiation at the peak of a strong flare on the red dwarf EV Lac. The authors [1] have found (p. 354) that the homogeneous plane layer with , , and K generates the energy distribution in the continuum, which is in close agreement with the energy distribution in the continuous spectrum at the maximum brightness of another flare on EV Lac.
Therefore, a homogeneous plane layer with the parameters corresponding to the chromospheric condensation [5] (the model of Katsova et al.), as opposed to a dense layer in the model of Grinin and Sobolev [1], cannot explain the continuous spectrum of stellar flares.101010See also Appendix in the present article.
3. Stationary radiative shock wave. In [9] it was assumed that radiative cooling of the gas behind the front of a stationary plane-parallel shock wave propagating in the red dwarf chromosphere toward the photosphere is capable of creating a zone with near-photospheric concentration (this value corresponds to the value of of the source of the blue continuum radiation at in the framework of the homogeneous plane layer model). Here we clarify the conditions under which this is possible.
Fadeyev and Gillet [13], Bychkov et al. [14] have calculated the profile of a stationary plane-parallel radiative shock wave with detailed accounting for elementary processes in the post-shock plasma: the electron impact ionization, the triple recombination, the electron impact excitation and de-excitation, etc.111111In [14] the numerical calculations have been performed for two-levels atoms and ions. The following parameters were chosen in [14] for the unperturbed gas: the total concentration of ions and atoms , a temperature , and a magnetic field . The magnetic field is oriented perpendicular to the gas velocity [14]. The plasma flows through the discontinuity surface at a velocity of (we use a frame of reference in which the shock front is at rest).
Let us take for the unperturbed chromosphere of a dMe star and retain the other parameters of the gas without modification. Immediately after the discontinuity for the same shock velocity we have: , , , and (the atoms and ions are heated at the shock front along the Rankine-Hugoniot adiabat and the electrons, along the Poisson adiabat). Here the ionization state of the unperturbed gas is calculated via the solution of the system of the Saha equations; the ionization of metals is taken into account (for more details, see pp. 651—653 in [14]). Clearly, (see also paragraph 4 in the introduction to this article). In these calculations we use a reduced value of the pre-shock gas temperature ( instead ). In the present problem, however, the Mach number is quite high (, where is the adiabatic sound speed), so the time ‘‘history’’ of radiative cooling of the post-shock gas should not depend too strongly on the background temperature .
Calculations [14] show that the optical depth in the line in the cooling region of the post-shock gas is ( is reckoned from the discontinuity surface). The authors [9] have shown that depends weakly on the concentration of the hydrogen atoms in the post-shock plasma (see Eqs. (2)—(3) in [9]). Thus, under the conditions of the chromosphere of a red dwarf, we can set in a first approximation (as in section 2 of study [9]).
A two-temperature () plane layer of thickness can be treated as the simplest approximation for the radiative cooling region behind the front of a stationary plane-parallel shock wave. For concreteness we assume that is the optical depth at the point , where is the geometric size of the region where the electron temperature is raised by the elastic collisions of electrons with ions and atoms [13, 14]. Since [13, 14], we will assume that (see also the paragraph six of introduction to the present article).
With increasing in the cooling region of the post-shock plasma, the geometric thickness of the emitting plane layer decreases. In fact, for , , and (an estimate), according to Eq. (2) we obtain that
| (6) |
Here is the hydrogen atom mass, is the electron mass, is the Bohr radius, is the excitation energy of the second level of the hydrogen atom, (the absorption oscillator strength for the transition ), and is the concentration of atoms in the ground state (here, for concreteness, we assume that ). It is clear that , so that a reduction in the atom-ion temperature in Eq. (6) leads to a drop in .
According to study of Lovkaya [11], the linear sizes of the flares on AD Leo at the maximum brightness are approximately (see p. 609 in [11]). Since is much less than , our assumption [9] regarding the origin of the blue continuum radiation is not confirmed.
4. Additional remarks. Sobolev and Grinin [15]131313 The brief version of this article is available via the ADS Article Service in the Proceedings of Cool Stars 9: http://adsabs.harvard.edu/abs/1996ASPC..109..629S. assume that the line spectrum of stellar flares is formed in the chromospheric layers where ‘‘gas-dynamic effects caused by the rapid release of energy play an extremely important role [5].’’ In the present article it has been shown that the homogeneous plane layer of pure hydrogen plasma with the parameters obtained by Katsova et al. [5] is transparent in the optical continuum. This result is in agreement with [15]. Thus, the model [5] can explain (qualitatively) the increased intensity of the hydrogen emission lines in the spectra of stellar flares.
In the gas-dynamic calculations [16, 17] Kowalski has increased the energy flux in the electron beam to (a low-energy cutoff ). The author [17] believes that ‘‘the … optical continuum radiation [during the impulsive phase of stellar flares] originates from the chromospheric condensation with [electron] densities as high as [, ] and from non-moving … dense ( [, ]) layers below the chromospheric condensation’’ [17] (only of the blue continuum radiation is produced in these layers [17]).
The calculations of Grinin et al. [4],141414The full text of the article is available via the ADS Article Service:
http://adsabs.harvard.edu/abs/1993ARep...37..182G,
http://adsabs.harvard.edu/abs/1993ARep...37..187B.
which contradict the viewpoint [16, 17], were not discussed in [16, 17]. As
justification for raising to
, it was pointed
out [16] that ‘‘non-thermal … deka-eV electrons’’ rapidly lose their energy
during interactions with the chromosphere of a red dwarf and, for
this reason, cannot heat the deep layers of the star’s
atmosphere. But in [4]
the energy losses of high-energy electrons through ionization of atoms and Coloumb interactions
with free electrons are taken into account (see Eqs. (1) and (2) in [4]). In addition, is two orders of
magnitude greater than the value of usually used in
gas-dynamic models of solar flares (see Somov et al. [18]).151515Here we have in mind the
problem of return current. At the same time,
with
and the same beam parameters [17], it has not been possible to reproduce
the optical continuum spectrum of stellar flares [17].
Therefore, Kowalski’s conclusion regarding the nature of [17] of the blue continuum radiation is not sufficiently substantiated.
The plasma behind the front of a stationary radiative shock wave moves at a subsonic velocity relative to the discontinuity surface. In addition, as the post-shock plasma radiates, the velocity of the gas flowing out of the discontinuity, , decreases because the gas becomes denser. From the standpoint of a laboratory observer, however, the velocity of the gas, , is equal to . As a result, the line core of the emission line of the post-shock plasma should be shifted as a whole in the direction of motion of the shock front. It is interesting to note that the line profile in the spectrum of a flare on dM5.6e (see Fig. 7a in Eason et al. [19]) has a Doppler core that is shifted to the blue, rather than red (see also subsection 5.3 in [9]). The gas behind the front of a shock wave propagating in the partially ionized chromosphere upward can generate this radiation.
5. Model of a second-kind temperature wave. Katsova et al. [5] and Livshits et al. [6] do not take into account the inequality in the post-shock chromospheric plasma of stellar and solar flares, and this is a fundamental deficiency of their models [5, 6]. As it follows from pp. 3666—3667 and Fig. 1 in [20], Katsova and Livshits do not dispute this statement. (‘‘We apply the two-temperature approximation where the electrons and ions are heated differently behind the shock front’’ (p. 3667 in [20]).161616In order to avoid misunderstandings, we recall that the “opposite” situation occurs in the EUV part of solar and stellar flares; i.e., the electron temperature of the plasma is considerable higher than the ion temperature: (see Somov et al. [18]).)
6. Conclusion. Let us summarize the astrophysical results obtained in this paper.
(a) It has been demonstrated that the blue continuum radiation observed at the maximum brightness of large flares on dMe stars originates from the near-photospheric layers [1].
(b) It has been shown for the first time that the homogeneous plane layer with the parameters corresponding to the chromospheric condensation [5], as opposed to the denser layer in the model [1], cannot explain the optical continuum spectrum of stellar flares.
Our conclusions are based on an analysis of three different approaches to explaining the spectral observations using the model of a homogeneous plane gas layer. In [1] this layer is located in the ‘‘transition region between the chromosphere and the photosphere.’’ In the gas-dynamic calculations [5], a single-temperature () plane layer corresponds to the chromospheric condensation formed by a second-kind temperature wave. Finally, in the model of a stationary plane-parallel shock wave propagating in the partially ionized chromosphere of a red dwarf toward the photosphere, a two-temperature () gas layer is the simplest approximation for the radiative cooling region. We note that this model differs from the models [5, 6]. In fact, Katsova et al. [5] and Livshits et al. [6] introduce a ‘‘system of [partial differential] equations of one-dimensional gravitational gas dynamics’’ [5] taking into account the thermal conductivity (Fourier’s law), while the authors [13, 14] consider a system of ordinary differential equations with detailed accounting for non-stationary radiative cooling in the post-shock plasma.171717The thermal conductivity and the gravitational acceleration are not taken into account.
Acknowledgments. The author thanks the reviewers for constructive critical comments. I am also grateful to T. V. Morchenko for assistance. This work was supported by the Scientific School (project code 1675.2014.2 NSh).
The present article is dedicated to the
memory of my dear physics teacher, Vladimir Mikhailovich Petrusenko
(1948—2016).
Translated from Astrofizika, Vol. 59, pp. 535—545, October—December, 2016. Original article submitted October 9, 2015; resubmitted March 26, 2016; accepted for publication August 24, 2016. This is a revised and extended version.
a Sternberg Astronomical Institute, Lomonosov Moscow State University, Russia;
b Faculty of Physics Lomonosov Moscow State University, Russia.
E-mail: morchenko@physics.msu.ru.
APPENDIX181818This part of the article is published only in astro-ph.SR.
To calculate the radiation intensity from the chromospheric condensation [5], Katsova et al. [5] and Livshits et al. [6] use the modified Eq. (9) from paper by Grinin and Sobolev [1]:
| (7) |
where the value of is equal to
| (8) |
is the electron pressure, ‘‘ is taken in accordance with the tables of [21], is a Lagrangian variable: ’’ [5]. The integration is carried out ‘‘over the complete high-density region for different times’’ (p. 163 in [5]).191919Eq. (7) corresponds to that on p. 281 in [6]; see also Eq. (4) in [6].
Bode’s tables [21] contain data for homogeneous plasma whereas the chromospheric condensation [5] is rather inhomogeneous. Therefore, Eq. (8) is incorrect. Moreover, this Eq. cannot be used in the calculations of the radiation intensity from a plane layer. The solution of this problem is the replacement of in Eq. (7) with (as in Table 1).
The physical parameters of the condensation [5] are close to the parameters of the reversing layer of an A0 star (see Allen [22], § 103). Using the absorption coefficient for such plasma [21], let us calculate the optical depth at wavelength 5000 Å, , at :
| (9) |
Here is the molecular weight of the gas without the electrons and metals ( [22]), is the unified atomic mass unit, is the total number density of atoms ( [22]). One can see that coincides in order of magnitude with (Table 1) at and . Note that the value of inside the chromospheric condensation [5] is strictly less than for all values of (in particular for corresponding to at [5]).
Katsova et al. [5] (p. 163) and Livshits et al. [6] (p. 281) state that the optical radiation from the plane layer with , , provides the color indices, which are ‘‘in a good agreement with the observed blue-white radiation’’ [6] of a stellar flare ( [5, 6]).
In the present article it has been demonstrated that this layer is transparent in the optical continuum. As it follows from [1], the opacity of the gas beyond the Balmer jump is a necessary condition for explaining the color indices at the maximum brightness of large stellar flares. Therefore, the real values of and for the layer [5] are not in the blue-visible region. In addition, the published color indices [5] do not correspond the color indices at the peaks of strong flares: and (p. 300 in [23]202020http://adsabs.harvard.edu/abs/1990IAUS..137..299G.); and (Zhilyaev et al. [12]).
Again, Katsova et al. [5] (p. 163) and Livshits et al. [6] (p. 281) state that the layer [5] provides the value of the Balmer jump (‘‘in accordance with Grinin and Sobolev [1]’’ [6]). Here the value of the Balmer jump ‘‘is determined by the formula
| (10) |
where and are the radiation intensities immediately after and immediately before the jump’’ [1]. In reality, as it follows from Fig. 3,
the value of for the layer with thickness (, ).
References
- 1. V. P. Grinin and V. V. Sobolev, Astrophysics 13, 348 (1977). DOI: 10.1007/BF01006610
- 2. V. P. Grinin and V. V. Sobolev, Astrophysics 28, 208 (1988). DOI: 10.1007/BF01004071
- 3. V. P. Grinin and V. V. Sobolev, Astrophysics 31, 729 (1989). DOI: 10.1007/BF01012732
- 4. V. P. Grinin, V. M. Loskutov, and V. V. Sobolev, Astron. Rep. 37, 182 (1993).
- 5. M. M. Katsova, A. G. Kosovichev, and M. A. Livshits, Astrophysics 17, 156 (1981). DOI: 10.1007/BF01005196
- 6. M. A. Livshits, O. G. Badalyan, A. G. Kosovichev, and M. M. Katsova, Solar Phys. 73, 269 (1981).
- 7. P. P. Volosevich, S. P. Kurdyumov, L. N. Busurina, and V. P. Krus, U.S.S.R. Comput. Math. Math. Phys. 3, 204 (1963). DOI: 10.1016/0041-5553(63)90131-9
- 8. S. B. Pikel’ner, Izv. Krymsk. Astrofiz. Observ. 12, 93 (1954).
- 9. E. Morchenko, K. Bychkov, and M. Livshits, Astrophys. Space Sci. 357, article id. 119 (2015). arXiv:1504.02749.
- 10. V. V. Ivanov, Transfer of Radiation in Spectral Lines. U.S. Department of Commerce, National Bureau of Standards, Washington (1973).
- 11. M. N. Lovkaya, Astron. Rep. 57, 603 (2013). DOI: 10.1134/S1063772913080040
- 12. B. E. Zhilyaev, M. V. Andreev, A. V. Sergeev, et al., Astron. Lett. 38, 793 (2012). DOI: 10.1134/S1063773712120079
- 13. Yu. A. Fadeyev and D. Gillet, Astron. Astrophys. 368, 901 (2001). arXiv:astro-ph/0101165.
- 14. O. M. Belova, K. V. Bychkov, E. S. Morchenko, and B. A. Nizamov, Astron. Rep. 58, 650 (2014).
- 15. V. V. Sobolev and V. P. Grinin, Astrophysics 38, 15 (1995). DOI: 10.1007/BF02113956
- 16. A. F. Kowalski, S. L. Hawley, M. Carlsson, et al., Solar Phys. 290, 3487 (2015).
- 17. A. F. Kowalski, In: A. G. Kosovichev, S. L. Hawley, and P. Heinzel, eds. Solar and Stellar Flares and their Effects on Planets; Proceedings IAU Symposium No. 320, 2015. 259 (2016).
- 18. B. V. Somov, S. I. Syrovatskii, and A. R. Spektor, Solar Phys. 73, 145 (1981).
- 19. E. L. E. Eason, M. S. Giampapa, R. R. Radick, et al., Astron. J. 104, 1161 (1992).
- 20. M. M. Katsova and M. A. Livshits, Solar Phys. 290, 3663 (2015). arXiv:1508.00254.
- 21. G. Bode, Kontinuierliche Absorbtion von Sternatmosphren. Sternwarte, Kiel (1965).
- 22. C. W. Allen, Astrophysical Quantities, 3rd ed. University of London, The Athlone Press, London (1973).
- 23. V. P. Grinin, In: L. V. Mirzoyan et al., eds. Flare Stars in Star Clusters, Associations and the Solar Vicinity; Proceedings IAU Symposium No. 137, 1989. 299 (1990).