Infrared Photometric Properties of 709 Candidate Stellar Bowshock Nebulae
Abstract
Arcuate infrared nebulae are ubiquitous throughout the Galactic Plane and are candidates for partial shells, bubbles, or bowshocks produced by massive runaway stars. We tabulate infrared photometry for 709 such objects using images from the Spitzer Space Telescope (SST), Wide-Field Infrared Explorer (WISE), and Herschel Space Observatory (HSO). Of the 709 objects identified at 24 or 22 m, 422 are detected at the 70 m bandpass. Of these, only 39 are detected at 160 m. The 70 m peak surface brightnesses are 0.5—2.5 Jy . Color temperatures calculated from the 24 m to 70 m ratios range from 80 K to 400 K. Color temperatures from 70 m to 160 m ratios are systematically lower, 40 K to 200 K. Both of these temperature are, on average, 75% higher than the nominal temperatures derived by assuming that dust is in steady-state radiative equilibrium. This may be evidence of stellar wind bowshocks sweeping up and heating — possibly fragmenting but not destroying — interstellar dust. Infrared luminosity correlates with standoff distance, , as predicted by published hydrodynamical models. Infrared spectral energy distributions are consistent with interstellar dust exposed to a either single radiant energy density, — (in more than half of the objects) or a range of radiant energy densities =25 to =103—105 times the mean interstellar value for the remainder. Hence, the central OB stars dominate the energetics, making these enticing laboratories for testing dust models in constrained radiation environments. SEDs are consistent with PAH fractions 1% in most objects.
1 Introduction
Infrared nebulae exhibiting distinctive circular, elliptical, or arc-like morphologies reveal a host of astrophysical phenomena sculpting the Galactic interstellar medium. Massive stars or star clusters may blow wind- and photon-driven bubbles [Castor et al., 1975, Weaver et al., 1977], which may grow to galactic scales if with sufficient energy injection [Heiles, 1979, Mac Low & McCray, 1988]. Individual massive stars or evolved stars ejecting may carve smaller bubbles on few parsec scales. Churchwell et al. [2006, 2007] compiled a catalog of nearly 600 interstellar bubbles discovered in mid-infrared 3.6–8.0 m images of the Galactic Plane obtained during the Spitzer Space Telescope Galactic Legacy Infrared MidPlane Survey Extraordinaire program [GLIMPSE; Benjamin et al., 2003, Churchwell et al., 2009] conducted with the Infrared Array Camera [IRAC; Fazio et al., 2004]. Worldwide volunteers identified hundreds more using these images as part of the Zooniverse Milky Way Project [Simpson et al., 2012] citizen science project. This wealth of identifications has led to the discovery of new star clusters, evolved stars, and better understanding of the structure and evolution of the Milky Way. Bubbles may develop an asymmetric, elliptical, or arcuate appearance in the presence of a density gradient in the ambient medium or a relative motion between the energy source and ISM; in the latter case a stellar bowshock nebula is formed [Wilkin, 1996, 2000].
Infrared nebulae with arcuate morphologies may reveal the presence of a high-velocity massive star when the 1000 km s-1 stellar wind shocks the ambient ISM, generating a distinctive bowshock feature. Gull & Sofia [1979] studied the bowshock (first seen in H) preceding the high-velocity O9.2IV star Oph. Brown & Bomans [2005] discovered eight H bowshocks using modern H sky surveys. However, H, X-ray, and radio free-free emission are expected to be several orders of magnitude fainter than the far-infrared dust emission, making the latter the most observable bowshock signature [Meyer et al., 2014, 2016]. van Buren & McCray [1988] and van Buren et al. [1995] cataloged dozens of far-infrared bright bowshocks associated with known massive and high-proper-motion stars thought to be “runaways” [Blaauw, 1961]. Deliberate searches for bowshock nebulae preceding high-velocity stars yielded a few dozen more candidates [e.g., Gvaramadze & Bomans, 2008, Kobulnicky et al., 2010, Gvaramadze et al., 2013, Peri et al., 2012, Sexton et al., 2015]. Hypervelocity stars [Hills, 1988, Kenyon et al., 2008] populate the extreme end of the runaway spectrum, but such objects may not support bowshocks [Brown et al., 2005, Meyer et al., 2014]. Bowshocks have also been associated with high-mass X-ray binaries [Gvaramadze et al., 2011b], pulsars [Wang et al., 2013], red [Noriega-Crespo et al., 1997, Gvaramadze et al., 2014a] and blue [Gvaramadze et al., 2014b] supergiants, and the A-type star Vel [Gáspár et al., 2008]. Thus, arcuate nebulae appear to be associated with different of types of systems and different physical phenomena. Peri et al. [2012] and Peri et al. [2015] concluded that only 10–15% of high-proper motion massive stars showed evidence of bowshocks in Wide Field Infrared Explorer [; Wright et al., 2010] mid-infrared images. The accumulating evidence suggests that early type stars and high space velocities are neither necessary nor sufficient conditions for the formation of prominent bowshocks at infrared wavelengths. Huthoff & Kaper [2002] compared the velocities and ambient interstellar densities of OB stars producing bowshocks and those lacking bowshocks, concluding that interstellar density likely plays a larger role than space velocity or stellar spectral type in creating an observable nebula. This conclusion is supported by hydrodynamical simulations of Comeron & Kaper [1998] and citetMeyer2016 exploring how a range a range of stellar and ISM properties combine to produce a variety of bowshock morphologies or no visible nebula at all. Mildly supersonic space velocities, strong stellar winds, and high ambient interstellar densities 0.1 cm-3 result in the most pronounced bowshock nebulae.
Kobulnicky et al. [2016] conducted a extensive visual examination covering hundreds of square degrees within the infrared Galactic Plane surveys made by the GLIMPSE and MIPSGAL [Carey et al., 2008] programs, and other wide-area programs including the Legacy Survey of the Cygnus-X Complex [Beerer et al., 2010], and the Mapping of the Outer Galaxy [SMOG; Carey et al., 2008]. Data from the four-band all-sky survey within several degrees of the Plane was also used to cover portions not observed by . They tabulated 709 arcuate nebulae discovered either at the 24 m or 22 m bandpasses along with positional and photometric data on the central prominent star located along the symmetry axis of each object. Figure 2 of Kobulnicky et al. [2016] plots the spatial distribution of the objects along the Galactic Plane. In about 15–25% of the objects the nebulae was located within or pointed toward a nearby H II region, leading the authors to designate a class of “in-situ” bowshock candidates following Povich et al. [2008] where a localized flow of ambient of material impinges upon an otherwise low-velocity massive star. Chick et al. [2017] obtained optical spectra for 60 of the central stars and found that 85% were O- or early B type stars, strengthening the evidence that these nebulae are frequently bowshocks associated with hot stars and likely constitute genuine bowshocks.
In this contribution we present aperture photometry and spectral energy distributions for the 709 bowshock candidates cataloged by Kobulnicky et al. [2016]. Their infrared spectral energy distributions (SEDs) and derived dust temperatures provide insight regarding the heating mechanisms of the nebulae (i.e., shocks versus radiative heating). SEDs can also be used to infer the dust grain size distribution and presence or absence of polycyclic aromatic hydrocarbons (PAHS). Section 2 describes he photometry procedure employed to measure fluxes from the 3.6 m or 3.4 m bandpasses through the Herschel Space Observatory Photoconductor Array Camera and Spectrometer [PACS; Poglitsch et al., 2010] 70 and 160 m bands. This section includes two tables containing the photometric measurements available in machine-readable format. Section 3 presents an analysis of the photometric properties, infrared colors, inferred dust temperatures. Section 4 presents an anlysis of spectral energy distributions in comparison to interstellar dust models. Section 5 compare the sizes and luminosities of the nebulae to published hydronamical simulations of bowshock nebulae, yielding some inferences concerning the densities of the ambient interstellar medium.
2 Aperture Photometry
Datasets for aperture photometry of 709 infrared nebulae
included the 3.6, 4.5, 5.8, and 8.0 m (i.e., the IRAC
I1, I2, I3, I4 bands) mosaics and 24 m
Multiband Imaging Photometer for Spitzer
[MIPS; Rieke et al., 2004] produced by the GLIMPSE team
covering the GLIMPSE, MIPSGAL, SMOG, and Cyg-X survey
regions. The telescope beam size at these bands is
1.66″ 1.72″ 1.88″ 1.98″ and
6″ FWHM,
respectively111http://irsa.ipac.caltech.edu/data/SPITZER/docs/irac/iracinstrumenthandbook,
http://irsa.ipac.caltech.edu/data/SPITZER/docs/mips/mipsinstrumenthandbook.
For targets in the second and third Galactic quadrants not covered by
programs we use the all-sky atlas images at 3.4, 4.6,
12, and 22 m (i.e., W1, W2, W3, W4 bands) which have
beamsizes of 6.1″, 6.4″, 6.5″, and
12.0″ FWHM, respectively. The Hi-Gal [Herschel
Infrared Galactic Plane Survey; Molinari et al., 2016] covered
the entire Plane with the PACS instrument at 70 and 160
m for which the beamsizes are approximately 6″ and 12″, respectively. Additional pointed
observations of individual objects outside the Plane (e.g.,
the prototypical bowshock runaway star Oph
[Gull & Sofia, 1979]) were sometimes available. We assembled
the level 2.5 or higher data processed and mosaicked
(22 degree UNIMAP images) from the Infrared
Science Archive
(IRSA)222http://irsa.ipac.caltech.edu/frontpage/
for analysis. For the level of photometric precision
relevant to this analysis, the different mapping algorithms
(e.g., UNIMAP verus MADmap) and data products available are
indistinguishable.
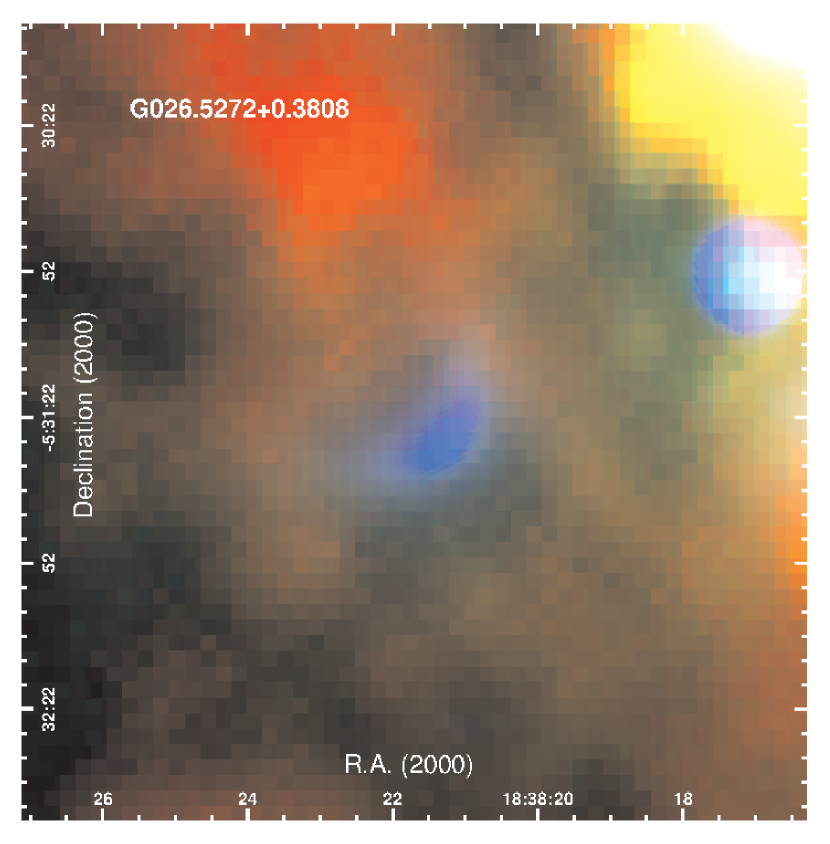
For each object we drew a crescent-shaped polygon encompassing the extent of the infrared nebula as seen in the 24 m images or 22 m images, as these were the bandpasses used to first identify the candidate bowshocks. In just a few cases, 24 m data were not available in regions nominally covered by IRAC and MIPS. In these cases we substituted 22 m photometry. These exceptions are: G018.2660-00.2988, G284.0765-00.4323, G287.4071-00.3593, G287.6131-01.1302, G287.6736-01.0093, G288.1505.00.5059. In seven cases (G0150749-00.6461, G015.0812-00.6570, and G015.1032-00.6489 in the M17 region, and G284.2999-00.3359, G284.3011-00.3712, and G284.3400-00.2827 in the Westerlund 2/RCW49 region, and G287.4389-00.6132) the angular size of the object was too small and the background levels too high to carry out meaningful photometric measurements. Otherwise, apertures were drawn to avoid the bright central stars which are typically prominent at wavelengths 8 m and are occasionally detected at longer wavelengths. We also measured the approximate angular height, , and radius, of each nebula as an indication of its aspect ratio. Figure 1 shows a three-color image of the G026.14730.0420 (object #123 from the catalog of Kobulnicky et al. [2016]) with the source polygon outlined in green along with angular height and radius markers overlaid in white. Blue/green/red depict the 24/70/160 m data from //, respectively. This object shows good morphological similarity at all three pictured wavebands, but is most prominent at 24 and 70 m (blue and green). The complexity of the field surrounding the source and the adjoining bright (unrelated?) 160 m emission to the lower left of the source illustrates the difficulty of determining appropriate source and background regions in within the Galactic Plane. Figure 2 depicts another “typical” object, G026.5272+0.3808, using the same color scheme as Figure 1 but without the marker overlays. This source is detected at 24 and 70 m, which show excellent morphological agreement, but it is not detected at 160 m. A photometric measurement was deemed a detection only if the morphology at a given bandpass showed a close resemblance to that at 24 m. In many cases this was a judgment call on the part of the lead author, as the Galactic Plane exhibits a variety of unrelated structures, especially at 160 m, where fields are heavily confused with foreground and/or background emission.
Defining the shape and extent of the polygonal aperture is unavoidably a subjective process because the nebulae often lie in regions of high, structured background emission that overlap the targets. We also defined a background polygon for each target by displacing the source polygon to an adjacent region judged to best reflect the local background, typically within several arcminutes. Our team transferred the source and background polygons from equatorial J2000.0 coordinates to pixel coordinates on each of the relevant infrared band FITS images using ds9333http://ds9.si.edu/site/Home.html image display and analysis application. We then performed aperture photometry using the IMCNTS task within the Image Reduction Analysis Facility (IRAF) xray.xspatial package. The net counts (source minus background) were converted to Jy using fits header information and supplementary documentation appropriate to each of the three spacecraft observatories.444 atlas images are in Jy pixel-1 so no conversion after summation is needed. images are in MJy sr-1 so the conversion factor is 106 Jy/MJy 206265-2 sr/arcsec2 arcsec2/pixel, where is the pixel size in arcseconds appropriate to each mosaicked image, either 1.2″ or 2.4″. For the conversion from the native units of DN to Jy is specific to each band, as given in the header of WISE atlas images; the conversions used here are 1.93510-6, 2.70510-6,2.90510-6,5.22710-5 for bands W1, W2, W3, W4, respectively. The highly variable and spatially complex infrared structures along the Plane, especially within the star forming regions where some objects lie, make it challenging to define an appropriate background region. In the majority of cases alternative background regions changed the photometric measurement by 20% or more. Typical 1 photometric uncertainties should be taken as 25%; in some cases 50% would be more appropriate.
We did not apply aperture corrections to any of the photometry owing to the irregular aperture shapes and sizes which averaged 10″ in radius but vary from 4″ to as much as 70″. For a 10″ radius circular aperture, the PACS aperture correction is about 25% [Balog et al., 2014], similar to that for MIPS at 24 m 555http://irsa.ipac.caltech.edu/data/SPITZER/docs/mips/mipsinstrumenthandbook/50/, and at 3.4 and 4.6 m; corrections for the 12 and 22 m bandpasses appear to be closer to 40% 666http://wise2.ipac.caltech.edu/docs/release/allsky. We regard the uncertainties on the relative fluxes between infrared bandpasses as small compared to the uncertainties stemming from background subtraction. Absolute fluxes tabulated here can be regarded as 25% low, on average, but the fraction will vary with the size of aperture used. Use of larger apertures was deemed inappropriate because of the increasing errors introduced by inclusion of unrelated background and foreground emission.
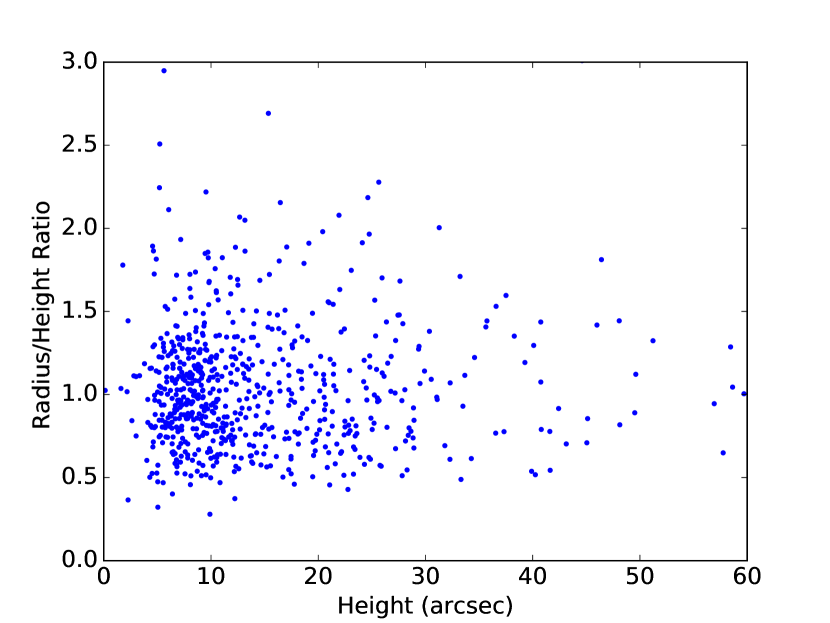
Figure 3 displays the ratio of nebula radius to height (i.e., the aspect ratios) versus height. A small random Gaussian offset with arcsec has been added to each point to prevent overlap of data points at common integer values. Heights range from 3″ in the most compact cases to over 200″ (off scale). Average radius-to-height ratios near unity indicate that most objects are approximately circular, but values range from 0.5 to 2.0. These ratios are consistent with the nebulae being either partial bubbles, partial elongated bubbles, or bowshocks, which would be morphologically indistinguishable from partial non-circular bubbles except under the most favorable signal-to-noise ratios and dynamic range of the image. Additional data, such as infrared SEDs would allow a bowshock to be distinguished from a bubble, given that the latter usually display bright PAH emission in the 8 m or 12 m bandpasses where soft UV radiation from a central star excites large molecules in a surrounding molecular cloud [e.g., Churchwell et al., 2006].
The columns of Table 1 record the identification number for each object (1) using the numeration of Kobulnicky et al. [2016], its generic designation in Galactic coordinates (2), the Right Ascension (3) and Declination(4) of the nominal central star given by Kobulnicky et al. [2016], measured radius (5) and height (6) in arcseconds, as illustrated in Figure 1, fluxes in Jy in the 3.6, 4.5, 5.8, 8.0, and 24 m bandpasses (columns 7–11), the fluxes in Jy in the 70 and 160 m bandpasses (12, 13), and the peak 70 m surface brightness above background levels in Jy arcmin-2 (14). A value of -99.999 indicates that no measurement was available because either the source was not covered by the survey at this bandpass or, in a few cases, the angular size of the source is less than a few arcseconds and is too small for measurement. A -99.9 in column 14 giving peak surface brightness indicates that the source is not detected in the 70 m bandpass. Negative values for fluxes designate 1 times the approximate 1 upper limits for non-detections. Column 15 gives the calculated color temperature as derived from the 24 m and 70 m photometric measurements. Column 16 gives the calculated color temperature as derived from the 70 m and 160 m photometric measurements. The first 20 lines of Table 1 appear in the journal article to provide guidance as to its form and content. The entire contents are available in the electronic edition as a machine-readable table. Table 2 records the same information as Table 1 but for the objects having four-band photometry instead of five-band photometry. The first 20 lines of Table 2 appear in the journal article to provide guidance as to its form and content. The entire contents are online available as a machine-readable table.
Table 3 presents a summary of the detection frequencies for each bandpass for the objects having and photometry.777Objects detected in the surveys are, of course, covered by the all-sky survey as well, but data are used preferentially, if available, owing to the smaller beamsize. The first column of the top row indicates that 617 objects are identified as candidate bowshock nebulae on the basis of 24 m detections.888All but seven of the 709 Kobulnicky et al. [2016] objects are detected at either 24 m or 22 m. Exceptions are #51, #52, #53 — in the M17 star-forming region — #400, $401, #402 — in the RCW 49 star-forming region —, and #408 — in the Carina star-forming region — which are identified on the basis of 8.0 m or shorter wavelength images. The second column the top row indicates that 399 of these also have detections at the 70 m bandpass. The last column of the top row indicates that only 35 of these 339 are further detected in the 160 m bandpass. A detection at 160 m always implies a detection at 70 m. The second row reports detections at the 8.0 m bandpass in conjunction with detections at longer wavelengths. The 106 in the first column gives the number of objects detected at both 24 m and 8.0 m. The 90 in the second column gives the number that are further detected at 70 m. The final column shows that only 20 objects are detected at 8.0 m and all three longer wavelengths. The bottom row of Table 3 reports the number of objects detected at 3.6 m and successively longer wavelengths. Thirty-two objects are detected at 3.6 m and at all longer wavelengths. Only 26 have detections at 3.6 m through 70 m, and only eight are detected at all bandpasses from 3.6 m through 160 m.
Table 4 reports detection frequencies for objects measured in the and survey images. The first column of the top row (85) designates the number of catalog objects detected exclusively in the 22 m data. The second and third columns give the number of objects further detected at 70 m and 160 m (23 and 4, respectively). The middle row lists the number of objects detected at the 12 m bandpass, and successively longer wavelengths. A detection at 22 m is almost always accompanied by a detection in the 12 m bandpass which includes both PAH and hot dust contributions. The bottom row gives the number of detections at the 3.4 m bandpass along longer. Only 12 objects are detected at 3.4 m through 22 m; two of these have 70 m detections, and only one has a 160 m detection.
3 Infrared Color Analysis
Photometric measurements at two or three bandpasses — available for the majority of this sample — enable calculation of the infrared colors and color temperatures. We undertake this type of analysis first in Section 3.1 as a means of characterizing the ensemble properties of a large number of bowshock nebula candidates. For objects where the temperature, radius, and distance of the central illuminating star is known, more sophisticated types of analyses are possible. These include comparisons of the expected steady-state dust temperatures and radiant energy densities in the nebulae to the temperatures and energy densities implied by fitting interstellar dust models to the SEDs. We evaluate these additional diagnostics in Sections 3.2 and 3.3 for a subsample of 20 nebulae having well-characterized central stars.
3.1 IR Colors
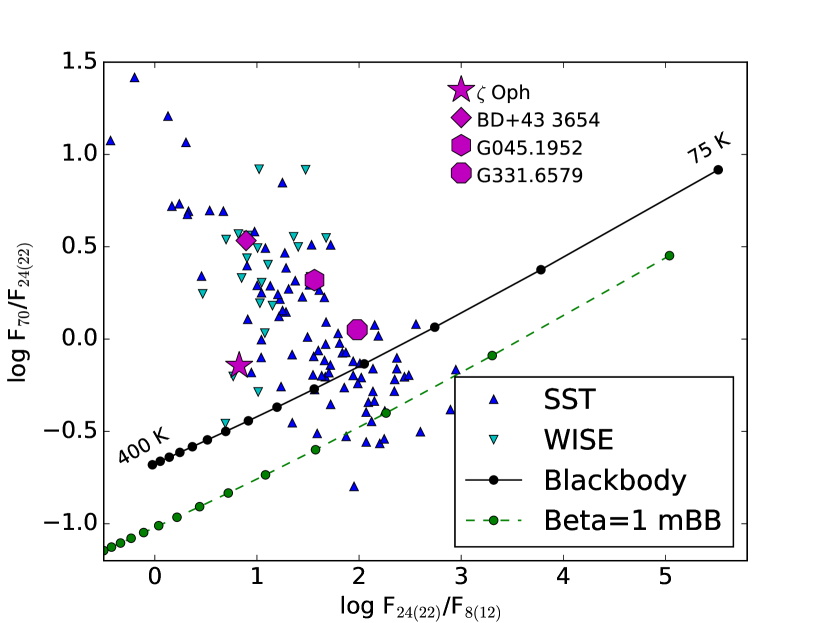
Ratios of infrared fluxes provide constraints on the properties of the emitting material, including dust temperatures. Figure 4 shows a color-color diagram for the 115 nebulae detected at the 70 m band and 24 and 8 m (upward pointing triangles; 92 objects) or 22 and 12 m (downward pointing triangles; 23 objects). and objects exhibit a large degree of overlap, together forming a band that stretches from upper left (high 70/24 m and low 24/8 m ratios) to lower right (low 70/24 m and high 24/8 m ratios). The targets lie preferentially in the upper half of the objects. The solid curve illustrates the colors of a blackbody denoted by filled circles every 25 K from 75 K at upper right to 400 K at lower left. The dashed curve illustrates the colors of a modified blackbody () with over the same range. That the distribution of points runs orthogonal to the blackbody curves is an indication that the objects are not well characterized as single-temperature dust in the majority of cases. If anything, the modified blackbody shows poorer agreement with the data than the simple blackbody. A star and diamond denote the colors of the canonical bowshock nebulae associated with the runaway stars Oph and BD+43 3654. A hexagon and octagon denote colors of G045.1952+00.7420 and G331.6579+00.1308, as indicative of other bright objects in our sample. Typical photometric uncertainties are about 0.2 dex on each axis. Most of the points lie to the upper left of the blackbody curve, indicating that their color temperatures inferred from the / ratios are considerably cooler than those indicated by the / (or /) ratios. This discrepancy may result from a contribution from very large molecules (i.e., PAH’s) or an anomalously large population of small, hot, non-thermally heated grains emitting in the IRAC 8 m and 12 m bandpasses. Such an effect would lower the / ratio and shift points horizontally to the left of the blackbody curve. For this reason, the / ratio is likely to be a more reliable indicator of the dust temperature. However, most points lie several orders of magnitude to the left of the blackbody fiducial, making it unlikely that excess contribution from PAHs is (solely) the cause. Emission from dust at multiple temperatures within an extended dust and gas nebula likely plays a role.
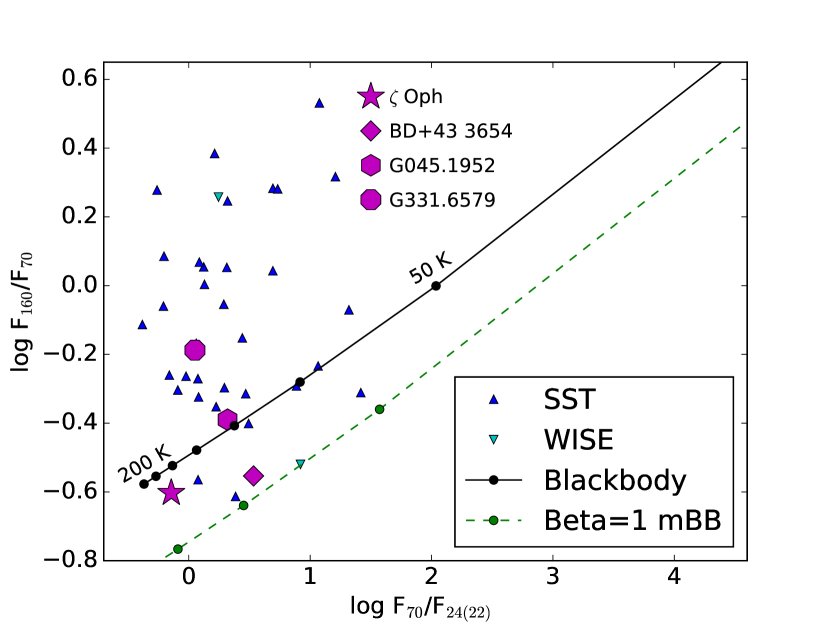
Figure 5 plots the log of the / ratios versus log of the / ratios for the 36 objects and 4 objects having data. Symbols are the same as in Figure 4. As in Figure 4 the majority of points lie to the upper left of the blackbody curve. In these bandpasses PAHs are not present, so another cause is required to explain the distribution in this color space. One possible explanation is, again, an excess of very small non-thermally heated grains that contributes disproportionatly at the 24/22 m bands, shifting points to the left of the blackbody curve. Another possibility is a multi-temperature dust structure. The apparent excess of relative to in Figure 4 and excess of relative to in Figure 5 would be consistent with the majority of sources showing increased contributions from cool dust at longer wavelengths. Infrared morphologies provides some support for this interpretation.
Figure 6 displays four examples of the 160/70/24(22) m morphologies in red/green/blue, respectively, for the four objects plotted with magenta symbols in the preceding color-color diagrams. The upper left panel is the bowshock associated with the O9.2IV star Oph (object #13). It spans more than 10′ on the sky but has high quality measurements from and data owing to its high Galactic latitude (+23°) and, therefore, relative lack of foreground/background contamination. With a HIPPARCOS parallax of 8.91 mas its implied distance of 112 pc makes Oph the nearest known bowshock. Consequently, its nebular appearance is highly resolved into wispy filaments better seen in mid-infrared bandpasses.999E.g., https://www.nasa.gov/missionpages/WISE/news/wise20110124.html. This object, plotted as a magenta star, lies near the blackbody curve in Figures 4 and 5. Somewhat smaller in angular size is the nebulae associated with the O4If star BD+43 3654 (upper right; object #344). This object is prominent at 22 m (blue) but less distinct at the bandpasses. At Galactic latitude +2.3°, it also suffers from less background confusion than a typical Galactic Plane source, but it is located near the extended Cygnus-X star-forming complex at a probable distance of 1.3–1.5 kpc [Kiminki et al., 2015, Rygl et al., 2012] which contributes to unrelated line-of-sight emission. This object, plotted as a diamond, lies far from the blackbody curve in Figure 4 but near the modified blackbody curve in Figure 5. G045.1952+0.7420 (lower left; object #238) illustrates the not-uncommon circumstance where the 24 m arcuate nebula has 70 and 160 m counterparts showing significantly different morphologies. Azimuthal variations in dust temperature and density seem likely in objects such as this. This object, plotted as a hexagon, lies far from the blackbody curve in Figure 4 but very near the blackbody curve in Figure 5. G331.6579+0.1308 (lower right; object #582) exemplifies another pattern noticed in about 10–15% of objects. The prominent 24 m arc is accompanied by 70 and 160 m features that are offset spatially to the exterior of the arc. This object, plotted as a hexagon, lies near the blackbody curve in Figure 4 and somewhat further from the blackbody curve in Figure 5.
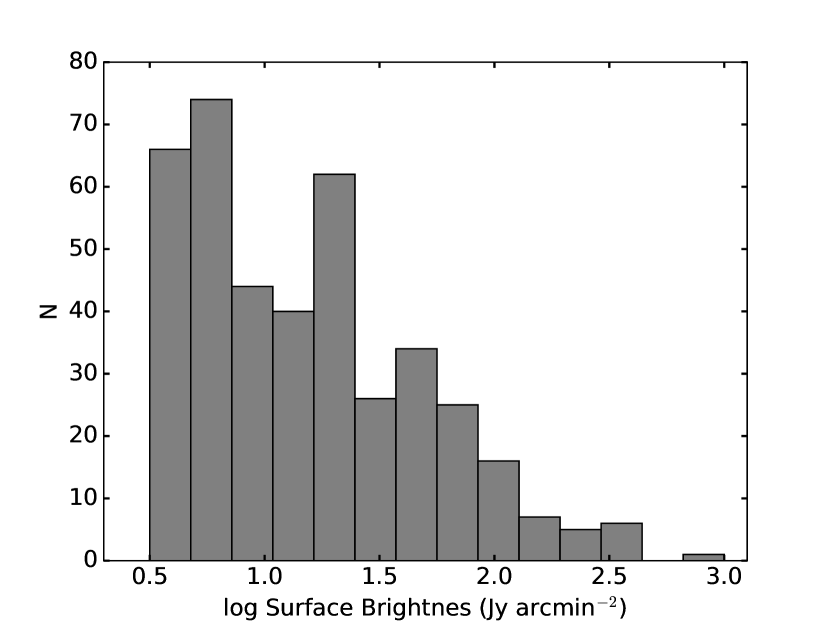
The morphology in the lower right panel of Figure 6 might result if a stellar wind-driven bowshock is encountering a molecular cloud or region of higher density. Such an arrangement provides a possible explanation of why only 10% of runaway stars produce detectable infrared bowshocks [Peri et al., 2015]. Perhaps a sufficiently high dust density or a density gradient is required to produce the requisite surface brightness to be detected amidst the high background levels in the Plane. For example, if Oph, with a peak 70 m surface brightness of 9 Jy arcmin-2 were placed in the Plane where our typical objects have surface brightnesses of tens to hundreds of Jy arcmin-2, it would likely go unnoticed and be undetectable. At 22 m the Oph bowshock nebula has a surface brightness of 1.9 Jy arcmin-2, which may be considered typical of our sample where values range from 0.6 to over 20 Jy arcmin-2. Figure 7 shows a histogram of 70 m surface brightness for our sample. Values range from 3–300 Jy arcmin-2. The limit of detectability is usually around 0.02 Jy pixel-1 or 7 Jy arcmin-2 in the 70 m images, but in some favorable sightlines factors of two lower are possible. For some objects that are just marginally detected, a value of 3.5 Jy arcmin-2 is a typical value, representing a rough lower limit to detectability.
3.2 Dust Temperatures
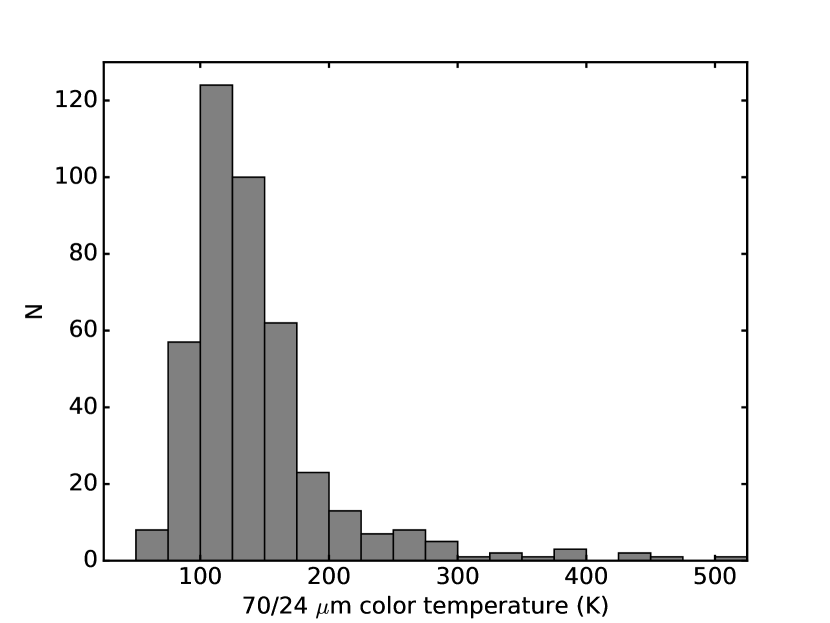
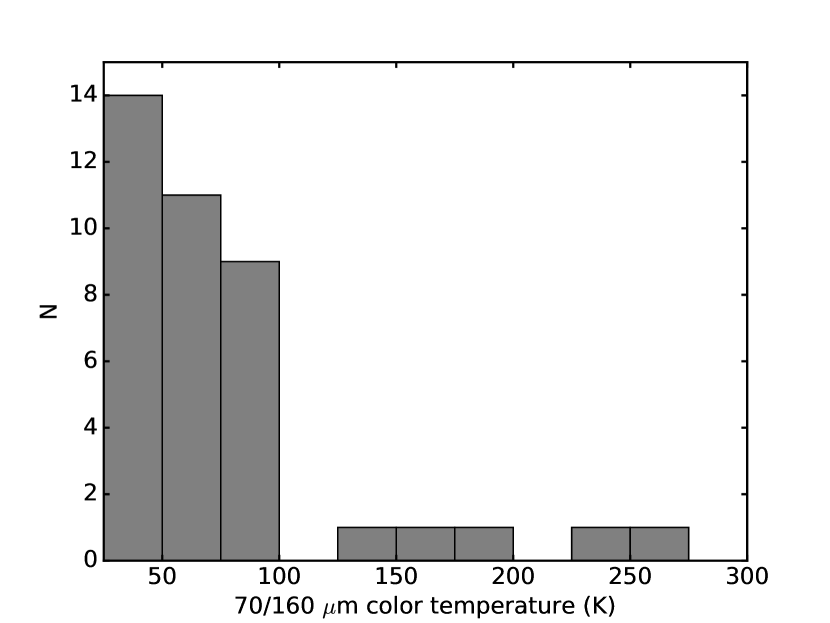
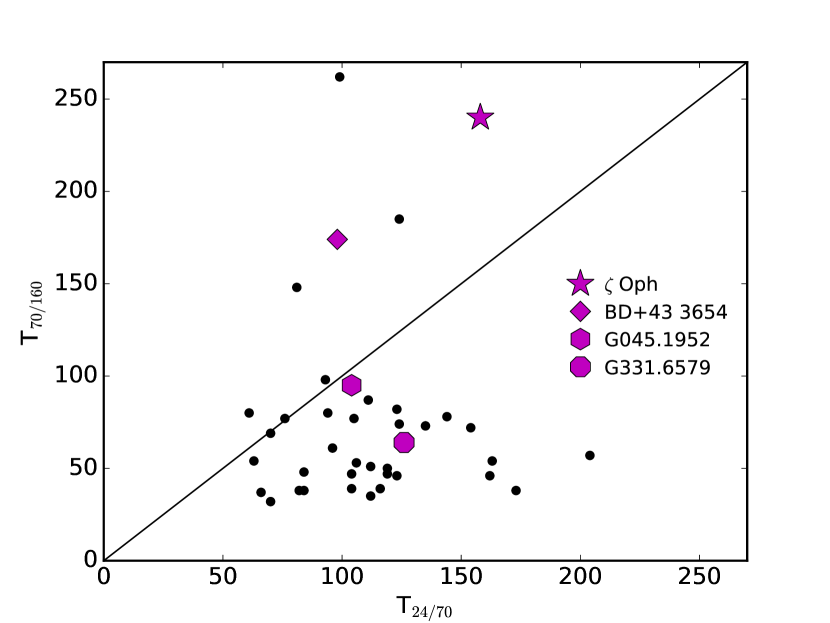
Figure 8 (left panel) shows a histogram of color temperatures calculated by fitting a blackbody to the 24 (or 22) and 70 m data for the 422 objects having measurements at those two bandpasses. The distribution is approximately Gaussian with a mean of 147 K, an rms of 78 K, and a long tail toward higher temperatures as large as 500 K. Figure 8 (right panel) shows a histogram of color temperatures for the 40 objects having both 70 and 160 m measurements. Nearly all the objects cluster between 25 and 100 K, with a few outliers up to 300 K. Figure 9 plots the 70 m/160 m color temperatures versus the 24 m/70 m color temperatures. The vast majority of objects lie to the right of the 1:1 relation, and there is no significant correlation. We interpret this to mean either that the 160 m measurements are unreliable, sampling unrelated foreground or background material, or that the arcuate nebulae are intrinsically multi-temperature structures, as might be expected in the presence of a density gradient such as at the edge of a molecular cloud. This discrepancy could also result from a population of small, hot, semi-stochastically heated grains elevating the 24 m fluxes and skewing the fitted color temperature upward toward higher values; such a scenario would be indistinguishable from the multi-temperature hypothesis on the basis of only three broadband measurements. Images presented above show that the 160 m emission is sometimes offset from the 24 m emission, lending credence to the idea of multiple temperature components. Shocks may also fragment dust grains producing a population of stochasitically heated very small grains radiating strongly in the 24 m band.
The nebula associated with Oph (plotted as a magenta star) has one of the highest 70/160 m color temperatures in the sample. Its 70/160 m color temperature is 240 K versus a 24/70 m temperature of 158 K. We believe this is largely the result of the large angular size of the source (over 400″ in diameter) which makes the photometry, particularly at 160 m, very sensitive to the adopted background level. The BD+43 3654 nebula (magenta diamond) also lies above the 1:1 line, plausibly for similar reasons. Although it is considerably smaller at an angular diameter of about 120″, it lies close to the Plane in a confused region near the Cygnus OB2 star-forming complex. The G045.1952+00.7420 nebula (hexagon) has very similar color temperatures from both diagnostics. The G331.6579+00.1308 nebula lies below the line along with the majority of the objects. It has a 24/70 m temperature of 126 K and 70/160 m temperature of 64 K. As illustrated by the lower right panel of Figure 6, this object has an extended area of 160 m emission just outside the arcuate region defined by 24 m emission. Inclusion of this, perhaps unrelated material, would lower the derived color temperature. The majority of objects in Figure 9 probably are affected by a similar circumstance. We consider the 70/160 color temperatures to be less reliable and/or less diagnostic than the temperatures 24/70 color temperatures, even allowing for the possibility of small stochastically heated grains affecting the 24 m bandpass.
4 SED modeling
Detailed modeling of the spectral energy distributions is possible for a few objects where the properties of the central stars (, ) are known and distances to the objects are also well constrained so that the standoff distance, , between the star and nebula is also known. The star must also have at least two, and preferably three or more photometric measurements. Table 5 lists 20 objects that meet these criteria. Columns 1–3 give the target ID number used in this work and in Kobulnicky et al. [2016] along with the common name and identifier in Galactic coordinates. Column 4 gives the spectral type and luminosity class as listed in the literature or, in a few cases, from our own spectroscopy [Chick et al., 2017]. Column 5 is the adopted effective temperature, , from the assigned spectral type and luminosity class using the theoretical effective temperature scale of Martins et al. [2005]. Column 6 is the corresponding stellar radius, , in solar radii. Column 7 lists the adopted distance, , to each source in kpc. For the majority of the objects in Table 5 distances are estimated through their association with a star cluster or molecular cloud of known distance, measured from main sequence color-magnitude diagram fitting, or from radio very long baseline interferometry parallax measurements toward masers.101010Spectrophotometric distance estimates toward the remainder of our sample are possible but considerably more uncertain owing to difficulties in assessing accurate spectral types and luminosity classes, reddening and binarity. We defer this analysis for a future work. Instances include NGC 6611 at 1.99 kpc [Hillenbrand et al., 1993], the W3/4/5 star forming complex at 2.00 kpc [Xu et al., 2006], the Cygnus X complex/Cygnus OB2 at 1.32 kpc [Kiminki et al., 2015, Rygl et al., 2012], and the Carina star forming complex at 2.3 kpc [Allen & Hillier, 1993]. The remainder are sufficiently close to have optical parallax measurements [HIPPARCOS; Perryman et al., 1997]. Columns 8–9 list the standoff distance of the nebulae, , from the central star in arcsec and pc, respectively. From these data we compute, in Column 10, the radiation density parameter, , at the location of the nebula. is defined in Draine & Li [2007, DL07] as the ratio of the radiant energy density (in erg cm-3) due to the star to the mean interstellar radiant energy density estimated by Mathis et al. [1983, MMP83],
| (1) |
Draine & Li [2007] use this dimensionless ratio, , as a parameter characterizing the radiant energy density in their grid of model dust emissivities. For the objects in Table 5 these values range from several 102 to 2105, indicating that the central stars dominate the radiant energy density at the locations of the nebulae. From these basic data it is straightforward to compute the steady state temperature of dust, , in the nebulae if radiant heating from the central star were the dominant heat source. Adopting Draine [2011] equation 24.19 for the temperture approximation of siliate grains in the size range m,
| (2) |
(where is the grain size, taken to be 0.1 m) for silicate dust.111111, listed in Column 11, becomes 35% larger for graphite dust [Draine, 2011, equation 24.20]. is relatively insensitive to errors in or (derived from the adopted distance), given that scales weakly with both quantities. is actually a lower limit on the star-nebula separation since the inclination angle of the vector from star to nebulae apex is unknown. Nevertheless, the inclination angle is likely to be near 90° owing to selection biases that would work against detection of bowshocks viewed at small inclination angles. Furthermore, most dust within the nebula lies at distances from the star, given the approximately parabolic bowshock shape, making the derived TSS a firm upper limit.
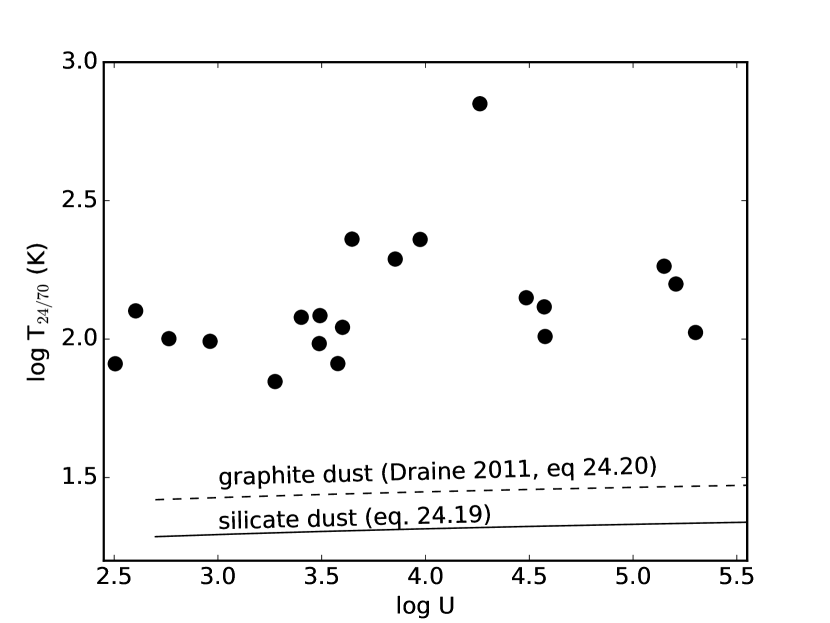
Columns 12 and 13 of Table 5 are the color temperatures derived from the 24/70 or 70/160 m ratios. Figure 10 plots the log of derived 24/70 m color temperatures versus log . The solid line shows the relation predicted by Draine [2011], equation 24.19 appropriate to silicate dust while the dashed line shows the prediction for graphite dust. It is immediately apparent that the predicted steady state dust temperatures are smaller than the measured color temperatures by factors of 1.1–3, with a mean ratio of 1.76. We interpret this as evidence that the infrared nebulae are not merely interstellar material sculpted and heated radiantly by the central star. Evidently, these nebulae require an additional source of heating, such as shock heating from the stellar wind mechanical energy. The discrepancy between the 24/70 m color temperatures and steady state dust temperatures could also be explained by invoking a population of anomalously small grains with , but given the dependency, increasing the dust temperature by 30% would require a large deviation from the interstellar grain size distribution adopted in Draine [2011]. Such a preponderance of small grains, if confirmed, would support the idea of grain fragmentation in the stellar wind bow shocks. Mid-infrared spectroscopy of the nebula in conjunction with dust models including excess populations of small grains could potentially allow confirmation of a variance from the interstellar grain size distribution.
Column 14 of Table 5 contains the total flux, of the nebula (, in erg s-1 cm-2) estimated by integrating a blackbody fit to the 24 (or 22) and 70 m data points over the range 1 m to 300 m. As demonstrated below, a blackbody provides a reasonable fit to the overall SED at wavelengths longer than 22 m in most cases. Column 15 contains the ratio of stellar luminosity to nebular luminosity, . is calculated using the adopted and . Luminosity ratios range from 8 to 5100, with typical values of several hundred. Apparently the dust in the nebulae intercepts and re-radiates a small faction of the stellar luminosity. There is no correlation between and the standoff distance, , as might be expected if larger standoff distances result in the nebulae intercepting and re-radiating a smaller fraction of the star’s luminosity.
4.1 SEDs of Sources with 160 m Detections
Knowledge of the radiation field can be used in conjunction with the Draine & Li [2007] interstellar dust models to infer the properties of dust in the subsample of well-characterized bowshock nebula candidates. The grid of Draine & Li [2007] is parameterized in terms three variables: dust exposed to a minimum radiant energy density , a maximum radiant energy density , and a fraction of PAH molecules by mass . We use the models appropriate to Milky Way dust and metallicity.121212Draine & Li [2007] also consider linear combinations of dust heated by a single and dust heated by a range of , via their parameter, , sspecifying the fraction of dust mass exposed to each radiant energy density. Given the limited number of photometric data points available in our study, we do not include this additional free parameter in our model comparisons. Figure 11 plots the infrared spectral energy distributions for the four objects from Table 5 that have 160 m measurements. Points show photometric data at 12 and 22 m, 24 m, and 70 and 160 m bandpasses. Typical photometric uncertainties are 0.2 dex. Black solid curves are best-fitting blackbodies, with labels in each panel indicating the temperature. The blackbody curves fit the data well in the upper two panels but fail to produce enough flux at the 12 m bandpass in the lower two panels. Dashed red curves are DL07 dust models with a constant , selected to be the nearest model match appropriate to the central star’s luminosity and the nebula’s standoff distance, as listed in Table 5. The model curves are normalized to the 70 m point. The dash-dot green curves are DL07 dust models having a range of radiation energy density between and , again normalized to 70 m. Values of and are labeled on the plots. All models have the minimum PAH fraction of =0.47% by mass. Figure 11 shows that the fixed- models are generally a poor representation of the data compared to the variable- models. The latter, which include a contribution from large molecules (PAHs) provide a better fit to the 12 m data than either the blackbody model or the single- DL07 models. Given that the DL07 models have at least three free parameters (, , and PAH fraction) we do not perform a fit to the data points, but rather we show the model curves as illustrative examples. In these four examples, all of which are hot stars with large implied radiant energy density at the location of the nebula, the SEDs are most consistent with minimal or no PAH content, as might be expected if shocks act efficiently to destroy large molecules.
4.2 SEDs of Sources at Shorter Wavelengths
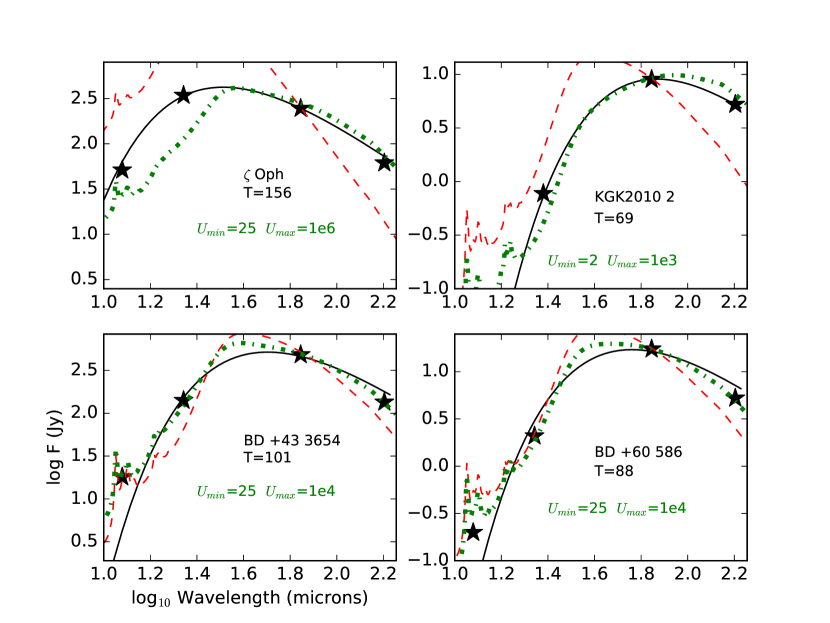
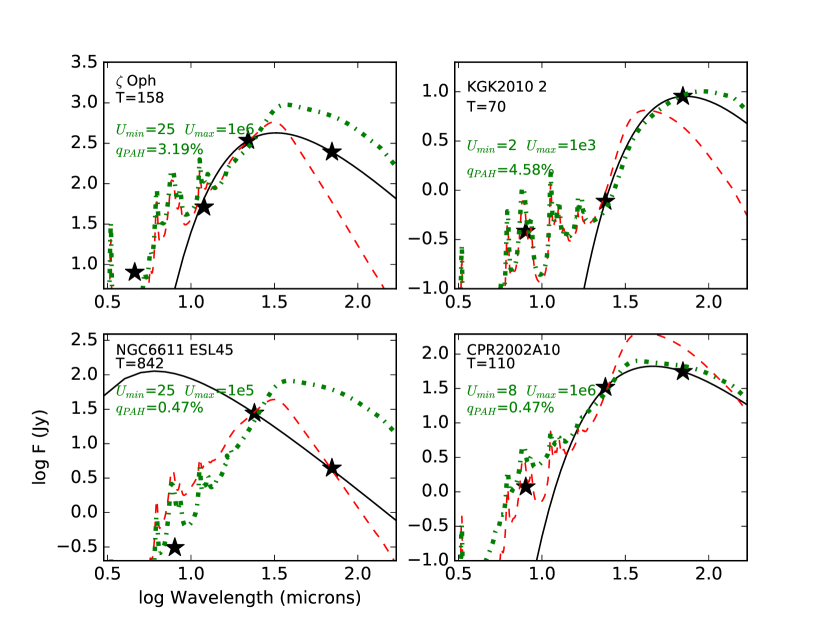
Additional photometric data at shorter wavelengths can further help constrain the dust properties. Figure 12 depicts the spectral energy distributions for four nebulae ( Oph and KGK2010 2, as in Figure 11) plus two additional objects from Table 5. The data points include the 70 m and 24 or 22 m measurements, plus the next two shorter bandpasses, either 5.8 and 8.0 m or 4.5 and 12 m. Models are normalized to the 24 or 22 m data points. Notations follow those in Figure 11. In three of the four cases the single- DL07 dust model of the appropriate from Table 5 (red) cannot simultaneously fit the 70 m data point and the shortest wavelength points. Similarly, the blackbody curve, in three of the four cases, significantly under predicts the flux at the shortest wavelengths, expected to contain PAH or very hot dust contributions. Generally, the variable- models (green) do a better job at matching the short wavelength data while also over-predicting the 70 m flux. Notably, the required PAH contribution for KGK2010 2 (upper right panel) is the maximum included in the DL07 model grid at 4.5%, as evidenced by the large 8.0 to 24 m flux ratio. Oph is also better with with a PAH fraction of =3.19%. The other two objects seemingly require no or minimal PAH contribution. NGC6611 ESL 45 is noteworthy for having the largest 24/70 m ratio in our sample, and correspondingly, the largest implied color temperature at 842 K. The best fitting multi- models typically have =25 and of 103 to 105. For this object, the single- model provides the best fit.
Figure 13 show an additional four SEDs from Table 5 with notation as in Figure 12. The best fitting models are similar, having minimal PAH fraction and =25 and of 103 to 105. The models having a range of radiant intensity do a good job of reproducing the data in three of the four panels. In the two panels in the right column the single- models also reproduce the data as well as the variable- models. In the lower left panel neither of the DL07 models provide a good fit to the data. The simple blackbody fit to the two longest wavelength data points does a reasonable job of approximating the data for all four objects.
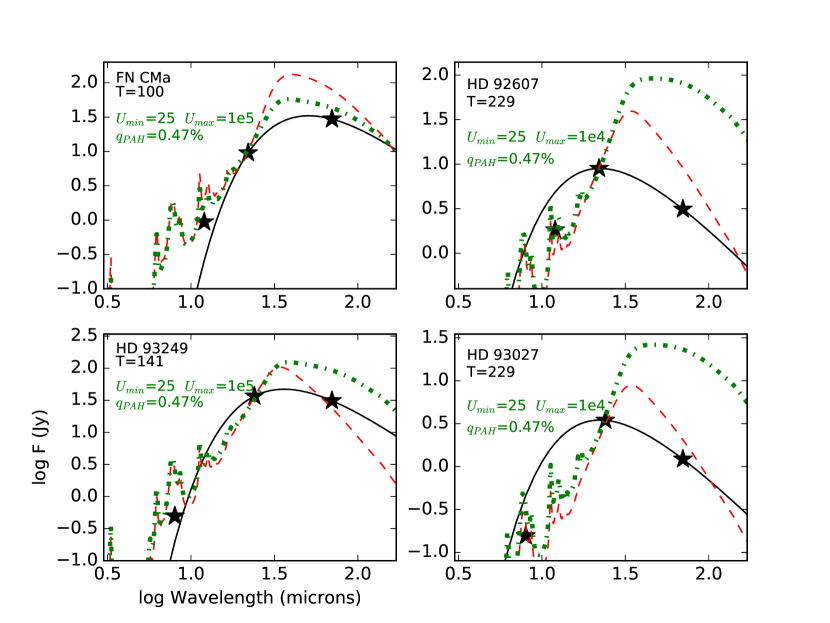
Figure 14 show another four SEDs from Table 5 with notation as in Figure 12. The best fitting variable- models are similar, having minimal PAH fraction and =25 and of 103 to 105. In three of four cases the single- models fit the data better than the variable- models. In general the simple blackbody curves fit to the two longest wavelength data points are also reasonable approximations of the overall SEDs.
4.3 SEDs of Sources with Strong 8 m Detections
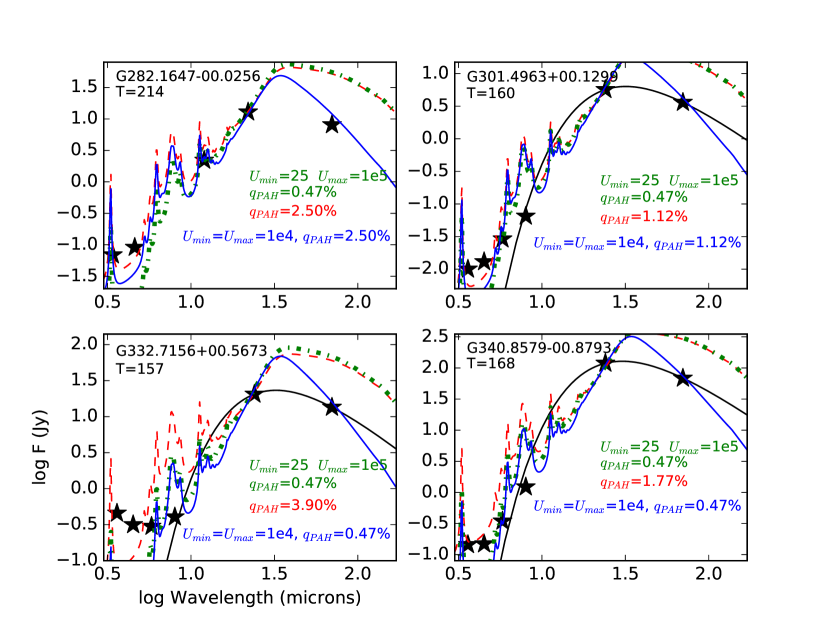
Although most nebulae are not detected at 8 m or shorter, those that have short-wavelength measurements can be used to yield insights regarding the PAH content of the nebula. Figure 15 plots the 3.6, 4.5, 5.8, 8.0, and 24 m measurements and 70 m measurement for four sources having suitable data as black stars. The generic source name and fitted 24/70 m blackbody (solid black line) temperature are labeled in the upper left. As in previous SED figures, the green dotted curve shows a DL07 dust model with a range of radiant energy density and the minimum PAH fraction (0.47%). The SED in the upper right panel is G026.1437-0.0420, pictured in Figure 1. In two of the four panels the green curve fits the long wavelength points reasonably well, while in the other two the blue curve provides a better match to the data. In all but the lower left panel the green curve underpredicts the flux at the shortest two wavebands. The red curve is a model having the same range of but for a larger PAH fraction, as labeled in each panel. In all cases a very small increase in PAH content is sufficient to reproduce the 3.6 and 4.5 m fluxes but begins to overpredict the 8 m fluxes. The blue curve is a model with a single radiant energy density (=1104, as typical of stars described in previous subsections) and a variable PAH content. This model fits the long wavelength data better than the variable- models in two of the four panels. It is similar to the red curve in its ability to predict the short-wavelength data, often overpredicting the 8 m flux once the PAH fraction exceeds 1.12% (the second lowest model available in the DL07 grid). Figure 16 shows SEDs for four additional sources, as in Figure 15. Here, the blue single- curve does a better job of reproducing the long-wavelength data than the variable- models in all four panels. Similar to the four sources in Figure 15, a small PAH fraction of =0–2% does a better job of reproducing the short-wavelength fluxes than the minimum PAH models. PAH fractions larger than this overpredict the 8 m fluxes, and in some cases, even the minimum PAH fraction models overpredict the 8m fluxes. In seven of the eight sources the fluxes are monotonically falling at short wavelengths; only G332.7156+00.5673 shows an upturn, perhaps due to very hot dust or contamination from foreground/background stellar sources along the sightline to the nebula. We conclude that, among nebulae with detections at short wavelengths, single- models fit the data better than models with a range of radiation energy density and models with minimal PAH content are most consistent with the data.
5 Inferences Regarding the Ambient ISM Density
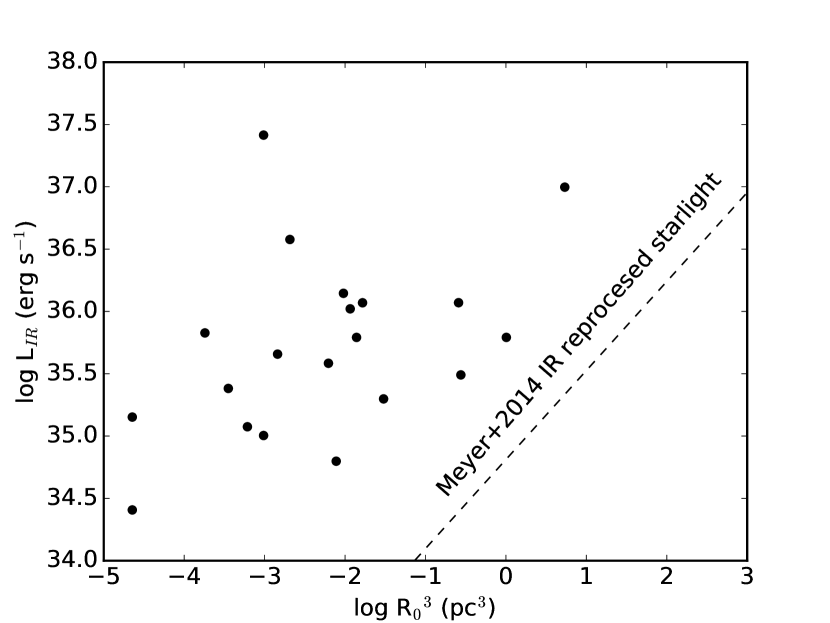
Meyer et al. [2014] conduct a series of hydrodynamical simulations of bowshocks generated by main sequence stars ranging from 10–40 M⊙ and red supergiants from 10–20 M⊙. Their Figure 24 presents the predicted correlation between bowshock luminosity and bowshock volume, in three different tracers, including the infrared continuum most relevant here. Figure 17 plots infrared luminosity versus standoff distance131313 has been corrected by a statistical factor of to account for the effects of the unknown inclination angle on the measured standoff distance. cubed, following Meyer et al. [2014] for the 20 objects in Table 5. The dashed line is that from Meyer et al. [2014] Figure 24 for main sequence star models and infrared luminosity from reprocessed starlight. There is a weak correlation among the data, broadly consistent in slope with the models. The data have similar luminosities to those predicted by Meyer et al. [2014] for 20–40 M⊙ stars, ranging between 1034 and 1037 erg s-1. However, the volumes are about three orders of magnitude smaller, indicative of much smaller standoff distances, , by about a factor of 10. scales as [e.g., Wilkin, 1996],
| (3) |
where is the mass loss rate, is the stellar wind velocity, is the ambient ISM density, and is the star’s space velocity. Generally is is accepted that and are known to factors of two or better. Some combination of smaller and larger are apparently needed to reduce by a factor of 10 required to reconcile the data with the models.
We infer from this discrepancy that the typical ambient interstellar densities in our sample may be as much as factors of 100 larger than the 0.57 used in the Meyer et al. [2014] simulations. ISM densities larger by factors of of 3–5 would be consistent with values of 2–3 determined in a few well-studied bowshock nebulae such as Orionis [Ueta et al., 2008] or Oph [Gull & Sofia, 1979]. These objects are nearby, however, and lie in relatively unconfused regions of the Plane where their bowshocks are more readily visible amidst the unrelated Galactic foreground/background. The majority of our sample lies close to the Plane where higher surface brightnesses are be required for detection, consistent with the requirement of higher ambient ISM densities. An alternative hypothesis requires stellar mass loss rates be factors of 100 lower than those adopted by Meyer et al. [2014], 10-6.2 and 10-7.3 M⊙ yr-1 for 40 and 20 M⊙ stars, respectively [Vink et al., 2001]. Some combination of higher ISM density by factors of up to 100 and lower mass loss rates by factors of up to 100 would reconcile the data and models in Figure 17.
6 Conclusions
This work constitutes the first analysis of the infrared spectral properties for a large sample of arcuate infrared nebulae, presumed to be bowshocks in the majority of cases. Photometry from 3.6 m through 160 m provides a panchromatic characterization of many candidate interstellar bowshock nebulae powered by early type stars.
-
1.
Essentially all nebulae identified at the 22 m bandpass are also detected at the 12 m band. The majority of objects identified at 24/22 m / bandpasses have 70 m detections (422 objects,; 60%), but only a small fraction (39 objects; 6%) are detected at 160 m. This low detection rate is a consequence of being on the Rayleigh-Jeans tail of the blackbody spectrum and the complex emission from foreground/background structures in the Galactic Plane.
-
2.
Only a small fraction (178 objects; 25%) are detected at 8 m, where PAH emission often dominates the emission, or at shorter wavelengths. This suggests that PAH contributions are not generally present in these nebulae, a conclusion supported by comparing ISM dust models to a subset of well-measured objects.
-
3.
Spectral energy distributions peak in the 12–70 m range, in agreement with the hydrodynamical simulations of Meyer et al. [2016].
-
4.
Color temperatures derived from 70/160 m ratios are systematically cooler than those from 24/70 m ratios. We infer from this that either the 160 m measurements are contaminated by unrelated background/foreground emission (appears likely in some cases), that the nebulae are intrinsically multi-temperature dust structures, as might be expected if a bowshock is being driven into a higher density structure such as a molecualr cloud, or that the 24/22 m bandpasses contain disproportionate contribution from very small, stochastically heated dust grains.
-
5.
Among a subset of 20 objects with well-determined distances, sizes, stellar effective temperatures, and stellar radii, we find that the radiant energy density from the star at the location of the nebula is 102 to 105 larger than the ambient interstellar radiation field, indicating that the early type stars dominate the energetics of the nebulae. Both of the infrared color temperatures are hotter, by 76% on average, than the nominal steady state dust temperature if the dust were in radiative equilibrium, consistent with shocks or additional heating sources in these nebulae.
-
6.
Among the 20 well-characterized objects, we find no correlation between the ratio of stellar-to-nebular luminosity and the standoff distance, . There is a weak correlation between infrared luminosity and , as predicted by numerical simulations of Meyer et al. [2014]. However, the data are offset toward smaller compared to the simulations. We infer that ambient ISM densities in the vicinity of bowshocks are are higher by factors of 100 or stellar mass loss rates are lower by factors of 100, or some combination thereof, relative to the values adopted in the simulations.
-
7.
Analysis of the SEDs for 20 well-characterized objects shows that the shortest wavebands (8 or 12 m) rarely have fluxes large enough to require significant PAH contributions. Most SEDs are consistent with DL07 dust spectra having a constant radiant energy density (single- models) or a range of radiant intensity from 25 to or times the ambient interstellar radiation field for a minority of the objects. In about half the cases the single- models provide better fits to the 8–70 m data, while the variable- models appear to provide better fits to the small number of objects having 24–160 m photometry. In nearly all cases, the models with minimal PAH content provide the best fits, indicating that PAH contribution to most candidate bowshock nebulae is small. Even in sources with strong 8 m detections (Figures 15 and 16) a small increase in the PAH fraction to =1–2% appears sufficient to reproduce the short-wavelength 3.6–5.8 m data. This is substantially smaller than the median =4.1% for nearby galaxies [Dale et al., 2017] and does not vary, on average, by more than half a percent as a function of galactocentric radius, with dropping slightly at smaller radii Sandstrom et al. [2013]. Taken together, these trends are consistent with shocks or UV radiation fragmenting large dust grains and large molecules within the nebulae to the point where PAHs are not a dominant component of the infrared SEDs.
Additional spectroscopic observations, both optical and infrared, are needed to characterize the central stars of these nebulae and enable a more comprehensive analysis of the energy balance and physical properties in a large sample of arcuate candidate-bowshock nebulae. Because the radiation field is convincingly dominated by a single hot star, these objects make enticing laboratories for studying the effects of UV radiation on dust properties and for testing models of dust emission against the data. Sensitive optical or infrared spectroscopy may be able to detect diagnostic fine-structure or forbidden lines which could be used as shock tracers or density indicators. Unfortunately the surface brightnesses of the nebulae are all below the detection thresholds of airborne infrared instruments on SOFIA, but some objects are good targets for the new suite of infrared instruments on the upcoming James Webb Space Telescope. Mid-infrared spectra would help constrain the grain size distribution, providing evidence for shock-induced destruction of large grains and PAHs. Spatially resolved infrared spectroscopy has the potential to measure variations in dust temperature, composition, and ionization structure across the putative shock fronts. Our team’s ongoing work will provide more precise characterizations of the central stars driving bowshock nebulae, including improved spectral classifications for a larger sample, measurements of their space velocities relative to the local interstellar medium, and the possible multiplicity among this sample of early type stars.
| ID | Name | R.A. | Decl. | Radius | Height | F3.6 | F4.5 | F5.8 | F8.0 | F24 | F70 | F160 | Peak70 | T24/70 | T70/160 |
|---|---|---|---|---|---|---|---|---|---|---|---|---|---|---|---|
| (2000) | (2000) | (arcsec) | (arcsec) | (Jy) | (Jy) | (Jy) | (Jy) | (Jy) | (Jy) | (Jy) | (Jy arcmin-2) | (K) | (K) | ||
| (1) | (2) | (3) | (4) | (5) | (6) | (7) | (8) | (9) | (10) | (11) | (12) | (13) | (14) | (15) | (16) |
| 1 | G000.1169-00.5703 | 17 48 07.70 | -29 07 55.5 | 38 | 44 | -0.074 | -0.150 | -0.086 | 0.255 | 8.730 | 28.300 | -22.000 | 126.5 | 92 | -99 |
| 2 | G000.3100-01.0495 | 17 50 27.59 | -29 12 46.8 | 16 | 25 | -0.258 | -0.149 | -0.114 | 0.041 | 0.453 | 0.450 | -2.000 | 24.6 | 132 | -99 |
| 3 | G001.0563-00.1499 | 17 48 41.78 | -28 06 37.8 | 13 | 21 | -0.139 | -0.120 | -0.230 | 0.710 | 13.305 | 39.000 | -20.000 | 372.6 | 95 | -99 |
| 4 | G001.2588-00.0780 | 17 48 53.40 | -27 53 59.7 | 17 | 19 | -0.065 | -0.375 | -0.062 | 0.108 | 1.023 | 3.910 | -7.000 | 355.0 | 89 | -99 |
| 5 | G003.5118-00.0470 | 17 53 56.10 | -25 56 50.3 | 12 | 23 | -0.055 | -0.038 | -0.020 | -0.010 | 0.273 | -0.400 | -3.800 | -99.9 | -99 | -99 |
| 6 | G003.7391+00.1425 | 17 53 43.26 | -25 39 19.2 | 11 | 17 | -0.086 | -0.061 | -0.059 | -0.025 | 0.370 | 1.300 | -6.400 | 56.2 | 90 | -99 |
| 7 | G003.8417-01.0440 | 17 58 30.64 | -26 09 49.1 | 13 | 13 | 0.103 | 0.106 | 0.496 | 1.311 | 0.830 | 21.700 | 10.600 | 179.3 | 61 | 80 |
| 8 | G004.3087+00.2222 | 17 54 41.61 | -25 07 25.6 | 10 | 12 | -0.083 | -0.250 | -0.056 | -0.093 | 0.609 | 4.700 | 2.400 | 59.8 | 76 | 77 |
| 9 | G004.7315-00.3875 | 17 57 57.62 | -25 03 53.6 | 9 | 10 | -0.017 | -0.015 | -0.017 | -0.015 | 0.391 | 3.300 | -4.800 | 45.7 | 75 | -99 |
| 10 | G004.8449-00.9309 | 18 00 17.51 | -25 14 14.7 | 9 | 13 | -0.195 | -0.114 | -0.079 | 0.054 | 0.259 | -0.100 | -2.300 | -99.9 | -99 | -99 |
| 11 | G005.5941+00.7335 | 17 55 36.25 | -23 45 21.8 | 9 | 11 | -0.116 | -0.076 | -0.032 | 0.086 | 0.758 | 0.500 | -0.200 | 14.1 | 158 | -99 |
| 12 | G005.6985-00.6350 | 18 01 06.15 | -24 21 34.4 | 16 | 19 | -0.048 | -0.030 | -0.052 | -0.116 | 1.795 | -1.100 | -3.300 | -99.9 | -99 | -99 |
| 14 | G006.2977-00.2012 | 18 00 40.59 | -23 36 50.7 | 17 | 15 | -0.089 | -0.064 | -0.029 | 0.060 | 1.065 | 7.500 | -1.100 | 123.0 | 77 | -99 |
| 15 | G006.3600-00.1846 | 18 00 44.92 | -23 33 06.3 | 7 | 10 | -0.034 | -0.188 | -0.024 | -0.054 | 0.318 | -5.700 | -1.000 | -99.9 | -99 | -99 |
| 16 | G006.8933+00.0743 | 18 00 55.27 | -22 57 36.9 | 14 | 12 | -0.080 | -0.053 | -0.101 | -0.122 | 2.274 | 7.100 | -1.000 | 80.8 | 93 | -99 |
| 17 | G007.5265-00.2652 | 18 03 33.49 | -22 34 38.3 | 4 | 6 | -0.109 | -0.072 | -0.024 | -0.019 | 0.266 | -0.400 | -1.300 | -99.9 | -99 | -99 |
| 18 | G008.3690+00.0239 | 18 04 15.53 | -21 42 05.3 | 27 | 16 | -0.164 | -0.131 | -0.131 | 0.189 | 3.254 | 1.800 | -6.400 | 112.5 | 172 | -99 |
| 19 | G009.0177+00.1410 | 18 05 11.21 | -21 04 43.3 | 15 | 17 | -0.052 | -0.033 | -0.030 | -0.005 | 0.226 | -0.330 | -2.000 | -99.9 | -99 | -99 |
| 20 | G009.6852-00.2025 | 18 07 51.86 | -20 39 48.8 | 7 | 10 | -0.026 | -0.017 | -0.010 | -0.027 | 0.111 | -0.070 | -0.700 | -99.9 | -99 | -99 |
| 21 | G010.1395-00.0350 | 18 08 10.89 | -20 11 06.4 | 21 | 17 | -0.038 | -0.033 | -0.157 | -0.496 | 1.137 | 3.700 | -1.900 | 84.4 | 92 | -99 |
Note. — Typical flux uncertainties are 25% in each band. Negative flux values indicate non-detections with 1 upper limits given by -1 the listed value. (1) ID from Kobulnicky et al. [2016]; (2) generic identifier by Galactic coordinates; (3) Right Ascension; (4) Declination; (5) nebula angular radius in arcsec; (6) nebula angular height in arcsec; (7–11) flux in Jy at 3.6/4.5/5.8/8.0/24 m bands; (12–13) flux in Jy at 70/160 m bands; (14) peak surface brightness above local background at 70 m in Jy arcmin-2; (15–16) color temperature derived from the 24/70 m and 70/160 m measurements, respectively.
| ID | Name | R.A. | Decl. | Radius | Height | F3.4 | F4.6 | F12 | F22 | F70 | F160 | Peak70 | T22/70 | T70/160 |
|---|---|---|---|---|---|---|---|---|---|---|---|---|---|---|
| (2000) | (2000) | (arcsec) | (arcsec) | (Jy) | (Jy) | (Jy) | (Jy) | (Jy) | (Jy) | (Jy arcsec-2) | (K) | (K) | ||
| (1) | (2) | (3) | (4) | (5) | (6) | (7) | (8) | (9) | (10) | (11) | (12) | (13) | (14) | (15) |
| 13 | G006.2812+23.5877 | 16 37 09.54 | -10 34 01.5 | 173 | 404 | 6.250 | 7.995 | 51.320 | 343.77 | 246.700 | 61.550 | 9.8 | 158 | 240 |
| 39 | G013.4900+01.6618 | 18 08 46.51 | -16 25 56.9 | 108 | 92 | -0.675 | -0.677 | 3.406 | 21.43 | -99.999 | -99.999 | -99.9 | -99 | -99 |
| 54 | G015.0813-00.6570 | 18 05 58.84 | -14 11 53.0 | 101 | 91 | -0.113 | -0.472 | 3.298 | 28.89 | -99.999 | -99.999 | -99.9 | -99 | -99 |
| 64 | G016.8993-01.1152 | 18 25 38.90 | -14 45 05.7 | 53 | 39 | -0.265 | -0.403 | 4.194 | 20.76 | -99.999 | -99.999 | -99.9 | -99 | -99 |
| 66 | G016.9848+01.7482 | 18 15 23.97 | -13 19 35.3 | 102 | 127 | 0.368 | 0.509 | 9.384 | 52.45 | -99.999 | -99.999 | -99.9 | -99 | -99 |
| 154 | G031.1096+03.6457 | 18 35 08.21 | +00 02 34.8 | 30 | 28 | 0.053 | 0.048 | 0.184 | 0.79 | -99.999 | -99.999 | -99.9 | -99 | -99 |
| 240 | G045.9397+03.2506 | 19 03 40.72 | +13 03 11.5 | 17 | 18 | -0.010 | -0.005 | -0.005 | 0.01 | -99.999 | -99.999 | -99.9 | -99 | -99 |
| 272 | G050.9339+03.0747 | 19 13 48.34 | +17 24 15.5 | 16 | 21 | -0.008 | -0.004 | -0.005 | 0.03 | -99.999 | -99.999 | -99.9 | -99 | -99 |
| 298 | G059.9225-01.9671 | 19 51 08.28 | +22 49 53.9 | 13 | 13 | 0.024 | 0.020 | 0.037 | 0.14 | -99.999 | -99.999 | -99.9 | -99 | -99 |
| 310 | G061.8355+02.9452 | 19 36 31.44 | +26 56 30.2 | 25 | 25 | -0.015 | -0.008 | -0.001 | 0.06 | -99.999 | -99.999 | -99.9 | -99 | -99 |
| 313 | G063.5153-01.4433 | 19 57 17.76 | +26 10 49.2 | 13 | 23 | -0.007 | -0.004 | 0.035 | 0.02 | -99.999 | -99.999 | -99.9 | -99 | -99 |
| 315 | G064.0602+01.6348 | 19 46 39.32 | +28 13 23.2 | 35 | 73 | -0.077 | -0.009 | -0.007 | 0.25 | -99.999 | -99.999 | -99.9 | -99 | -99 |
| 316 | G064.7582+00.2889 | 19 53 30.15 | +28 08 20.1 | 8 | 10 | -0.001 | -0.003 | -0.008 | 0.06 | -99.999 | -99.999 | -99.9 | -99 | -99 |
| 317 | G067.1370-00.6744 | 20 02 57.58 | +29 39 49.9 | 29 | 24 | -0.008 | -0.005 | 0.031 | 0.03 | -99.999 | -99.999 | -99.9 | -99 | -99 |
| 318 | G073.2946-01.6939 | 20 22 58.66 | +34 14 20.3 | 21 | 19 | -0.001 | -0.002 | 0.016 | 0.01 | -99.999 | -99.999 | -99.9 | -99 | -99 |
| 319 | G073.3536+02.5872 | 20 05 38.06 | +36 39 37.3 | 5 | 151 | -0.002 | -0.002 | -0.020 | 0.13 | -99.999 | -99.999 | -99.9 | -99 | -99 |
| 320 | G073.6200+01.8522 | 20 09 25.91 | +36 29 19.1 | 37 | 24 | -0.056 | -0.065 | 0.089 | 2.98 | 6.480 | -2.610 | 7.0 | 110 | -99 |
| 321 | G074.1929+00.9964 | 20 14 33.30 | +36 29 48.6 | 8 | 9 | -0.001 | -0.020 | 0.021 | 0.12 | -99.999 | -99.999 | -99.9 | -99 | -99 |
| 322 | G074.3117+01.0041 | 20 14 51.09 | +36 35 59.7 | 21 | 25 | -0.002 | -0.001 | 0.020 | 0.51 | 1.600 | -1.020 | 3.5 | 100 | -99 |
| 323 | G075.1730-00.5964 | 20 23 50.71 | +36 24 26.4 | 13 | 7 | 0.023 | 0.031 | 0.155 | 0.89 | -99.999 | -99.999 | -99.9 | -99 | -99 |
Note. — Typical flux uncertainties are 25% in each band. Negative flux values indicate non-detections with 1 upper limits given by -1 the listed value. (1) ID from Kobulnicky et al. [2016]; (2) generic identifier by Galactic coordinates; (3) Right Ascension; (4) Declination; (5) nebula angular radius in arcsec; (6) nebula angular height in arcsec; (7–10) flux in Jy at 3.4/4.6/12/22 m bands; (11–12) flux in Jy at 70/160 m bands; (13) peak surface brightness above local background at 70 m in Jy arcmin-2; (14–15) color temperature derived from the 22/70 m and 70/160 m measurements, respectively.
| Band | 24 | 70 | 160 |
|---|---|---|---|
| 24 | 617 | 399 | 35 |
| 8 | 106 | 90 | 20 |
| 3.6 | 32 | 26 | 8 |
| Band | 22 | 70 | 160 |
|---|---|---|---|
| 22 | 85 | 23 | 4 |
| 12 | 72 | 23 | 4 |
| 3.4 | 12 | 2 | 1 |
| ID | Name | Alt. name | Sp.T. | Teff | R∗ | D | ||||||||
|---|---|---|---|---|---|---|---|---|---|---|---|---|---|---|
| (K) | () | (kpc) | (″) | (pc) | (K) | (K) | (K) | (erg s-1 cm-2) | ||||||
| (1) | (2) | (3) | (4) | (5) | (6) | (7) | (8) | (9) | (10) | (11) | (12) | (13) | (14) | (15) |
| 13 | Oph | G006.2812+23.5877 | O9.2IV | 31000 | 7.2 | 0.14 | 29 | 0.02 | 1.7 | 123 | 158 | 240 | 6.4 | 1110 |
| 67 | NGC 6611 ESL 45 | G017.0826+00.9744 | O9V | 31500 | 7.7 | 1.99 | 7.5 | 0.07 | 1.6 | 82 | 842 | 5.8 | 8.4 | |
| 329 | KGK 2010 10 | G077.050500.6094 | O7V | 35500 | 9.3 | 1.32 | 10 | 0.06 | 4.6 | 98 | 131 | 5.1 | 4400 | |
| 331 | LS II +39 53 | G078.2869+00.7780 | O7V | 35500 | 9.3 | 1.32 | 25 | 0.18 | 7.3 | 72 | 195 | 5.3 | 430 | |
| 338 | CPR2002A10 | G078.8223+00.0959 | O9V | 31500 | 7.7 | 1.32 | 23 | 0.15 | 3.8 | 65 | 110 | 6.9 | 160 | |
| 339 | CPR2002A37 | G080.2400+00.1354 | O5V | 41500 | 11.1 | 1.32 | 70 | 0.45 | 2.6 | 61 | 120 | 6.0 | 1100 | |
| 341 | KGK2010 1 | G080.8621+00.9749 | B2V | 20900 | 5.4 | 1.32 | 20 | 0.13 | 4.7 | 46 | 126 | 1.9 | 43 | |
| 342 | KGK2010 2 | G080.9020+00.9828 | B2V | 20900 | 5.4 | 1.32 | 10 | 0.06 | 1.9 | 58 | 70 | 69 | 6.0 | 140 |
| 344 | BD +43 3654 | G082.4100+02.3254 | O4If | 40700 | 19 | 1.32 | 193 | 1.24 | 9.1 | 51 | 98 | 174 | 5.0 | 350 |
| 368 | KM Cas | G134.3552+00.8182 | O9.5V | 30500 | 7.4 | 2.00 | 14 | 0.13 | 3.7 | 64 | 96 | 1.4 | 2400 | |
| 369 | BD +60 586 | G137.4203+01.2792 | O7.5V/O8III | 34400 | 8.9 | 2.00 | 73 | 0.71 | 3.2 | 43 | 81 | 148 | 1.4 | 640 |
| 380 | HD 53367 | G223.709201.9008 | B0IVe | 30000 | 7.4 | 0.26 | 15 | 0.02 | 1.8 | 124 | 183 | 3.3 | 5400 | |
| 381 | HD 54662 | G224.168500.7784 | O7V | 35500 | 9.4 | 0.63 | 71 | 0.22 | 4.2 | 66 | 82 | 4.4 | 2300 | |
| 382 | FN CMa | G224.709601.7938 | B2Ia | 17600 | 30 | 0.93 | 101 | 0.45 | 5.8 | 47 | 100 | 3.2 | 980 | |
| 406 | HD 92607 | G287.114801.0236 | O8V+O9V | 33400 | 8.5 | 2.30 | 16 | 0.18 | 4.1 | 66 | 230 | 1.9 | 300 | |
| 407 | HD 93249 | G287.407100.3593 | O9III | 33400 | 13.6 | 2.30 | 7.8 | 0.09 | 3.1 | 92 | 141 | 6.3 | 160 | |
| 409 | HD 93027 | G287.613101.1302 | O9.5IV | 30500 | 7.4 | 2.30 | 7.4 | 0.08 | 9.9 | 76 | 229 | 7.6 | 330 | |
| 410 | HD 305536 | G287.673601.0093 | O9.5V+? | 30500 | 7.4 | 2.30 | 3.7 | 0.04 | 3.9 | 96 | 102 | 1.1 | 220 | |
| 411 | HD 305599 | G288.150500.5059 | B0Ib | 25000 | 30 | 2.30 | 4.2 | 0.05 | 2.3 | 128 | 106 | 4.0 | 5100 | |
| 413 | HD 93683 | G288.313801.3085 | O9V | 31500 | 7.7 | 2.30 | 15 | 0.17 | 2.9 | 62 | 123 | 1.0 | 360 |


References
- Allen & Hillier [1993] Allen, D. A., & Hillier, D. J. 1993, Proceedings of the Astronomical Society of Australia, 10, 338
- Balog et al. [2014] Balog, Z., Müller, T., Nielbock, M., et al. 2014, Experimental Astronomy, 37, 129
- Beerer et al. [2010] Beerer, I. M., Koenig, X. P., Hora, J. L., et al. 2010, ApJ, 720, 679
- Benjamin et al. [2003] Benjamin, R., et. al 2003, PASP 115, 953
- Blaauw [1961] Blaauw, A. 1961, Bulletin of the Astronomical Institutes of the Netherlands, 15, 265
- Brown & Bomans [2005] Brown, D., & Bomans, D. J. 2005, A&A, 439, 183
- Brown et al. [2005] Brown, W. R., Geller, M. J., Kenyon, S. J., Kurtz, M. J. 2005, ApJ, 622, L33
- Carey et al. [2008] Carey, S., etal. 2008, Spitzer Proposal ID #50398
- Castor et al. [1975] Castor, J., McCray, R., & Weaver, R. 1975, ApJ, 200, L107
- Chick et al. [2017] Chick, W. T., Kobulnicky, H. A., Schurhammer, D., et al. 2017, ApJ, in press
- Churchwell et al. [2006] Churchwell, E., Povich, M. S., Allen, D., et al. 2006, ApJ, 649, 759
- Churchwell et al. [2007] Churchwell, E., Watson, D. F., Povich, M. S., et al. 2007, ApJ, 670, 428
- Churchwell et al. [2009] Churchwell, E., Babler, B. L., Meade, M. R., et al. 2009, PASP, 121, 213
- Comeron & Kaper [1998] Comeron, F., & Kaper, L. 1998, A&A, 338, 273
- Dale et al. [2017] Dale, D. A., Cook, D. O., Roussel, H., et al. 2017, ApJ, 837, 90
- Draine [2011] Draine, B. T. 2011, Physics of the Interstellar and Intergalactic Medium by Bruce T. Draine. Princeton University Press, 2011. ISBN: 978-0-691-12214-4,
- Draine & Li [2007] Draine, B. T., & Li, A. 2007, ApJ, 657, 810
- Lee & Draine [1985] Lee, H. M., & Draine, B. T. 1985, ApJ, 290, 211
- Fazio et al. [2004] Fazio, G. G., Hora, J. L., Allen, L. E., et al. 2004, ApJS, 154, 10
- Gáspár et al. [2008] Gáspár, A., Su, K. Y. L., Rieke, G. H., et al. 2008, ApJ, 672, 974
- Gvaramadze & Bomans [2008] Gvaramadze, V. V., & Bomans, D. J. 2008, A&A, 490, 1071
- Gvaramadze et al. [2011b] Gvaramadze, V. V., Röser, S., Scholz, R.-D., Schilbach, E. 2011b, A&A, 529, 14
- Gvaramadze et al. [2013] Gvaramadze, V. V., Kniazev, A. Y., Chené A.-N., Schnurr, O. 2013, MNRAS, 430, L20
- Gvaramadze et al. [2014a] Gvaramadze, V. V., Menten, K. M., Kniazev, A. Y., et al. 2014a, MNRAS, 437, 843
- Gvaramadze et al. [2014b] Gvaramadze, V. V., Miroshnichenko, A. S., Castro, N., Langer, N., Zharikov, S. V. 2014b, MNRAS, 437, 2761
- Gull & Sofia [1979] Gull, T. R. & Sofia, S. 1979, ApJ, 230, 782
- Heiles [1979] Heiles, C. 1979, ApJ, 229, 533
- Hillenbrand et al. [1993] Hillenbrand, L. A., Massey, P., Strom, S. E., & Merrill, K. M. 1993, AJ, 106, 1906
- Hills [1988] Hills, J. G. 1988, Nature, 331, 687
- Huthoff & Kaper [2002] Huthoff, F., & Kaper, L. 2002, A&A, 383, 999
- Kenyon et al. [2008] Kenyon S. J., Bromley, B. C., Geller, M. J., Brown, W. R. 2008, ApJ, 680, 312
- Kiminki et al. [2015] Kiminki, D. C., Kobulnicky, H. A., Vargas Álvarez, C. A., Alexander, M. J., & Lundquist, M. J. 2015, ApJ, 811, 85
- Kobulnicky et al. [2010] Kobulnicky, H. A, Gilbert, I. J., & Kiminki, D. C. 2010, ApJ, 710, 549
- Kobulnicky et al. [2016] Kobulnicky, H. A., Chick, W. T., Schurhammer, D. P., et al. 2016, ApJS, 227, 18
- Lang [1999] Lang, K. R. 1999, Astrophysical formulae / K.R. Lang. New York : Springer, 1999. (Astronomy and astrophysics library,ISSN0941-7834)
- Mac Low & McCray [1988] Mac Low, M.-M., & McCray, R. 1988, ApJ, 324, 776
- Meyer et al. [2014] Meyer, D. M.-A., Mackey, J., Langer, N., et al. 2014, MNRAS, 444, 2754
- Meyer et al. [2016] Meyer, D. M.-A., van Marle, A.-J., Kuiper, R., & Kley, W. 2016, MNRAS, 459, 1146
- Martins et al. [2005] Martins, F., Schaerer, D., & Hillier, D. J. 2005, A&A, 436, 1049
- Mathis et al. [1983] Mathis, J. S., Mezger, P. G., & Panagia, N. 1983, A&A, 128, 212
- Molinari et al. [2016] Molinari, S., Schisano, E., Elia, D., et al. 2016, A&A, 591, A149
- Noriega-Crespo et al. [1997] Noriega-Crespo, A., van Buren, D., & Dgani, R. 1997, AJ, 113, 780
- Peri et al. [2012] Peri, C. S., Benaglia, P., Brookes, D. P., Stevens, I. R., & Isequilla, N. L. 2012, A&A, 538, A108
- Peri et al. [2015] Peri, C. S., Benaglia, P., & Isequilla, N. L. 2015, A&A, 578, A45
- Perryman et al. [1997] Perryman, M. A. C., Lindegren, L., Kovalevsky, J., et al. 1997, A&A, 323,
- Poglitsch et al. [2010] Poglitsch, A., Waelkens, C., Geis, N., et al. 2010, A&A, 518, L2
- Povich et al. [2008] Povich, M. S., Benjamin, R. A., Whitney, B. A., et al. 2008, ApJ, 689, 242-248
- Rieke et al. [2004] Rieke, G. H., Young, E. T., Engelbracht, C. W., et al. 2004, ApJS, 154, 25
- Rygl et al. [2012] Rygl, K. L. J., Brunthaler, A., Sanna, A., et al. 2012, A&A, 539, A79
- Sandstrom et al. [2013] Sandstrom, K. M., Leroy, A. K., Walter, F., et al. 2013, ApJ, 777, 5
- Sexton et al. [2015] Sexton, R. O., Povich, M. S., Smith, N., et al. 2015, MNRAS, 446, 1047
- Simpson et al. [2012] Simpson, R. J., Povich, M. S., Kendrew, S., et al. 2012, MNRAS, 424, 2442
- Ueta et al. [2008] Ueta, T., Izumiura, H., Yamamura, I., et al. 2008, PASJ, 60, S407
- van Buren & McCray [1988] van Buren, D., & McCray, R. 1988, ApJ, 329, L93
- van Buren et al. [1995] van Buren, D., Noriega-Crespo, A., & Dgani, R. 1995, AJ, 110, 2914
- Vink et al. [2001] Vink, J. S., de Koter, A., & Lamers, H. J. G. L. M. 2001, A&A, 369, 574
- Wang et al. [2013] Wang, Z., Kaplan, D. L., Slane, P., Morrell, N., Kaspi, V. M. 2013, ApJ, 769, 122
- Weaver et al. [1977] Weaver, R., McCray, R., Castor, J., Shapiro, P., & Moore, R. 1977, ApJ, 218, 377
- Wilkin [1996] Wilkin, F. P. 1996, ApJ, 459, L31
- Wilkin [2000] Wilkin, F. P. 2000, ApJ, 532, 400
- Wright et al. [2010] Wright, E. L., Eisenhardt, P. R. M., Mainzer, A. K., et al. 2010, AJ, 140, 1868-1881
- Xu et al. [2006] Xu, Y., Reid, M. J., Zheng, X. W., & Menten, K. M. 2006, Science, 311, 54