Isotope Shifts in the 7s8s Transition of Francium: Measurements and Comparison to ab initio Theory
Abstract
We observe the electric-dipole forbidden transition in the francium isotopes 208-211Fr and 213Fr using a two-photon excitation scheme. We collect the atoms online from an accelerator and confine them in a magneto optical trap for the measurements. In combination with previous measurements of the transition we perform a King Plot analysis. We compare the thus determined ratio of the field shift constants (1.230 0.019) to results obtained from new ab initio calculations (1.234 0.010) and find excellent agreement.
pacs:
Valid PACS appear hereI Introduction
The isotope shift in the transition energies of an atom arises due to a combination of nuclear and atomic effects. It is an important benchmark, as it can provide information about the nuclear charge distribution and its change as more neutrons are added; the shift also depends on electron correlations. The FrPNC collaboration at TRIUMF has been studying francium with the ultimate goal of measuring atomic parity non-conservation (APNC) Gwinner et al. (2007); Gomez et al. (2007). Others have also proposed to use francium for APNC studies Atutov et al. (2004), and to search for time reversal violation through the existence of a permanent electric dipole moment (EDM) of the electron Wundt et al. (2012); Inoue et al. (2015). These proposals require quantitative understanding of the atomic and nuclear structure, and in particular the overlap of the electronic wave functions with the nucleus. This overlap can be tested by comparing the measurements of hyperfine structure and isotope shift in chains of isotopes to the ab initio calculations King (1984).
Testing the accuracy of the ab initio theory for field shifts in heavy atoms is also crucial for extraction of the change of nuclear radii in superheavy elements Laatiaoui et al. (2016). Combining theoretical and experimental isotope shift values allows the extraction of the differences in the nuclear radii of these atoms and provides an insight into their nuclear structure. Studies of isotope shift of superheavy elements are also of interest for astrophysics Dzuba et al. (2017). All of these projects require reliable benchmarks of theoretical calculations in order to verify their theory uncertainties. Measurements of the field shift ratios for different atomic transitions are of particular interest owing to the recently found disagreement of the Ca+ D1/D2 field shift measurement with all theoretical predictions Shi et al. (2017). Isotope shift measurements have also been proposed as a new method to probe new light force-mediators Berengut et al. (2017).
Here, we report the observation of the electric dipole forbidden atomic transition in the francium isotopes 208-211Fr and 213Fr using a single-frequency two-photon excitation scheme, its isotope shift and the comparison to ab initio theory. This transition in francium is of particular interest for APNC experiments, as it is electric-dipole forbidden by electromagnetism but slightly allowed by the weak interaction. The landmark APNC experiments in cesium performed in Paris and Boulder used the equivalent transition in cesium Bennett and Wieman (1999); Wood et al. (1999); Bouchiat et al. (1982). Our isotope shift measurements are complementary to hyperfine splitting measurements, which also depend on the electronic wave functions at the nucleus. Together with the information obtained from the change in the nuclear magnetization from the measurements of hyperfine anomalies allows to create a better picture of the nuclear structure Grossman et al. (1999); Zhang et al. (2015). In contrast, measurements of the electronic dipole matrix elements (obtained from lifetime measurements of excited atomic states) probe the wave functions predominantly at large distances from the nucleus E. Gomez and Sprouse (2005).
We divide this paper into the following sections: In section II we briefly discuss the general theory relevant to the measured isotope shifts, in section III we present the theoretical calculations of the field shift, in section IV we describe the experimental details, in section V we discuss our experimental results, section VI contains a King Plot analysis and the comparison with the theoretical predictions, closing with conclusions in section VII.
II Theory
Single-photon electronic transitions between states of same parity in atoms are forbidden by electric-dipole selection rules; however, a two-photon transition is allowed between states of the same parity. The selection rules for a two-photon transition where both photons are far off resonance from any intermediate states are and Cagnac and Biraben (1973).
Using two-photon spectroscopy in our set-up and previously measured hyperfine splittings of the and states we obtain the center of gravity (C.O.G) of the transition in five different isotopes of francium that we collect online from an accelerator and capture in a magneto-optical trap (MOT). From these measurements we deduce the isotope shifts and perform a King Plot analysis King (1963). Optical isotope shifts are discussed in detail in Refs. Heilig and Steudel (1974); King (1984). Here we briefly review the theory that is relevant to the measurements reported in this paper.
For heavy elements the optical isotope shift , between isotopes with mass number and and nuclear mass and respectively, can be written as111In the relativistic case, is replaced by , where Dzuba et al. (2017).
| (1) |
is the normal mass shift (NMS) constant, and is the specific mass shift (SMS) constant that stems from the changing mass of the nucleus between isotopes. The contribution of the normal mass shift to the frequency of an optical transition can be written in the non-relativistic limit as
| (2) |
where is the mass of the electron and is the transition frequency of an isotope with mass number .
The specific mass shift is hard to calculate accurately owing to poor convergence of the perturbation theory for this quantity. This issue has been discussed in detail in Safronova and Johnson (2008). However, the contribution of the mass shift (both normal and specific) is small for heavy atoms and simple estimations should be sufficient. Moreover, an earlier study of francium isotope shifts has demonstrated that NMS and SMS strongly cancel each other and the residual is at the level of the accuracy of the theoretical field shift calculations Safronova and Johnson (2008).
In the traditional approach, is the field shift constant that takes into account the modification of the Coulomb potential of a point-charge by that of the finite size of a nucleus. However, also depends on the nuclear radius, and this dependence may be large for heavy atoms. Nevertheless, if we consider neighbouring isotopes with small differences between mass numbers, the dependence of on the nuclear radius between these isotopes can be neglected. We check this for the francium isotopes considered in this work.
is a relatively simple single-electron scalar operator. Unlike , which is a two-electron operator of rank one, the field shift can be more easily included into the available, accurate, ab initio atomic methods. In this work, we use two completely different theory methods that we describe in Sec. III and compare the results for the field shift values to evaluate the theoretical uncertainty.
The values of the quantities , and as defined are specific to a particular electronic transition in an atom. In our experiment, we obtain the total isotope shift for the transition as expressed by Eq. 1.
III Theoretical calculations of the field shifts
III.1 The all-order method
We use a linearized variant of the relativistic coupled-cluster method with single, double, and partial triple excitations Safronova and Johnson (2008), which is referred to as the all-order method. The exact many-body wave function in the coupled-cluster method is represented in the form Coester and Kümmel (1960)
| (3) |
where is the lowest-order atomic state vector. The operator for an N-electron atom consists of “cluster” contributions from one-electron, two-electron, , N-electron excitations of the lowest-order state vector . Expanding the exponential in Eq. (3) in terms of the -body excitations , and limiting the expansion to terms linear in single, double, and valence triple contribution, we get the wave function of a monovalent atom in state :
| (4) | |||
| (5) |
where is the lowest-order atomic state vector. In Eq. (5), and are creation and annihilation operators for an electron state , the indices and range over all possible virtual states while indices and range over all occupied core states. The quantities are excitation coefficients. The single double (SD) method is the linearized coupled-cluster method restricted to single and double excitations only. The all-order singles-doubles-partial triples (SDpT) method is an extension of the SD method in which the dominant part of is treated perturbatively. A detailed description of the SDpT method is given in Ref. Safronova and Johnson (2008).
To derive equations for the excitation coefficients, the wave function is substituted into the many-body Schrödinger equation and terms on the left- and right-hand sides are matched, based on the number and type of operators they contain, giving the equations for the excitation coefficients. The Dirac-Hartree-Fock (DHF) starting potential with the inclusion of the Breit interaction is used to produce a finite basis set of the orbitals for all subsequent calculations. The equations for the excitation coefficients are solved iteratively until the valence correlation energy converges to a specified numerical accuracy. This procedure effectively sums the series of the dominant many-body perturbation theory (MBPT) terms, with each iteration picking up a new order of MBPT. Thus, the method includes dominant correlation corrections to all orders of MBPT.
III.2 Field-shift calculations: Method I
If we describe the nucleus as a uniformly charged ball of radius , the change in the nuclear potential induced by a change in the nuclear radius , is given by
| (6) |
. Re-writing this result in terms of the mean square radius , we define a field-shift operator as Johnson (2007)
| (7) |
| (8) | |||||
When we use a more elaborate Fermi distribution to describe the nucleus
| (9) |
where is the 50% fall-off radius of the density, and is related to the 90%-10% fall-off distance by , we find negligible differences with the results obtained using the formula for a simple uniform ball for the field-shift operator and a variant that uses the Fermi distribution.
In our first method we use the all-order approach and we calculate the field shift constant as an expectation value of the field-shift operator given by
| (10) |
where and are given by the expansion (5) limited to single and double excitations. The resulting expression for the numerator of Eq. (10) consists of the sum of the DHF matrix element and twenty other terms that are linear or quadratic functions of the excitation coefficients.
| Method | Approximation | () | () | () | () | |
|---|---|---|---|---|---|---|
| I | DHF | -14239 | -3649 | -485 | 0 | 1.299 |
| I | All-order SD | -22522 | -4677 | -683 | 348 | 1.224 |
| I | All-order SDpT | -21268 | -4554 | -674 | 304 | 1.232 |
| I | All-order SD | -21647 | -4602 | -670 | 333 | 1.231 |
| I | All-order SDpT | -21618 | -4603 | -687 | 312 | 1.230 |
| II | MBPT 2 | -22480 | -4732 | -695 | 311 | 1.227 |
| II | MBPT 3 | -19441 | -4359 | -455 | 449 | 1.259 |
| II | BO+fit | -20947 | -4381 | -670 | 310 | 1.224 |
| II | All-order SD | -21236 | -4436 | -675 | 333 | 1.224 |
| II | All-order SD+E3 | -20181 | -4322 | -599 | 371 | 1.235 |
| II | All-order SDpT | -20582 | -4421 | -635 | 338 | 1.234 |
| II | Final | -20580(650) | -4420(100) | -635(40) | 338(33) | 1.234(10) |
III.3 Field-shift calculations: method II
In the second method, we use an all-order finite-field approach Dzuba et al. (2005). Calculations of the field shift are done for the reference isotope A with a nuclear charge radius by replacing a nuclear potential by
| (11) |
where is a scaling parameter
| (12) |
The Fermi distribution is used for the charge distribution and the derivative is calculated numerically. The value of is chosen in such a way that the corresponding change in the nuclear potential is sufficiently small for the final energy to be a linear function of but much larger than the numerical uncertainty of the calculations. The calculations are carried out for several values of and the field shift constant for an atomic state is calculated as a derivative
| (13) |
Therefore, the calculation of the field shift constants reduces to the calculation of the energy in this method.
III.4 Theory results and discussion
The results for the field shift constants of francium levels calculated using both methods are given in Table 1. is the ratio of the field shift constants for the and transitions:
| (14) |
Results obtained in several approximations are given for both methods. The DHF lowest order matrix elements are given to show the size of the correlation corrections. The all-order single-double (SD) and partial triple (SDpT) results are listed in the SD and SDpT rows. In method I, some classes of omitted contributions from higher excitations may be estimated by the scaling procedure described in Safronova and Johnson (2008), these results are listed with the subscript “sc”. For method II, we also include the field shift constants obtained using the second- and third-order MBPT energy calculations to show the size of the third and higher-order corrections. The energy in the SD approximation is missing a part of the third-order contribution, which is restored in the results in the “SD+E3” row. The SDpT energies include a complete third-order contribution and do not need to be corrected. We also carried out other calculation using Brueckner orbitals (BO) with fitting of the correlation potential to the experimental energies, described in Dzuba et al. (2005). The results are listed in the row labelled “BO+fit”. We take the ab initio method II SDpT results as final. The uncertainties are estimated from the spread of the all-order results. We note that the uncertainty of the field shift constant was underestimated in Dzuba et al. (2005). The relative uncertainty in the ratio is smaller than the uncertainties in the field shift constants for each level as correlation corrections to the and states are similar, and the field shift for the level is small in comparison to the field shifts of the and levels.
IV Experimental details
We use francium ions produced at the Isotope Separator and Accelerator (ISAC) facility at TRIUMF. The ions are delivered to our experiment at the rate of 4107s to 2109s, and we collect them online on a zirconium foil neutralizer of area 19 12 mm2 and of thickness 0.03 mm. Typically, we collect the ions on the foil for 20 s before rotating the foil by 90 and electrically heating it for 1 s to release neutral francium atoms from the heated foil (with maximum efficiency of 30). We collect the released atoms first in a MOT inside a coated glass cell (collection chamber), then we transfer the atoms to another MOT inside a stainless steel vacuum chamber (science chamber, with maximum transfer efficiency of 20 for this work), by pushing them with a pulse of laser light resonant with the D2 line in francium at 718 nm Zhang et al. (2016). The MOT in the science chamber is located at 0.7 m, directly below the MOT in the collection chamber. We operate both MOTs on the D2 line of francium and they share two Ti:Sapphire lasers. We use one laser (MSquared SolsTIS) for trapping, and we use the other laser (Coherent 899-21) for re-pumping the atoms. We maintain a pressure of 2 10-10 Torr in the science chamber. A detailed description of the francium trapping facility (FTF) can be found in Refs. Tandecki et al. (2013); Zhang et al. (2016). We can operate our apparatus with a range of isotopes (206-213,221Fr) by adjusting our trap and re-pump laser frequencies, and requesting a specific isotope from ISAC Collister et al. (2014).
We perform two-photon spectroscopy using atoms confined in the MOT in the science chamber. We use a third Ti:Sapphire laser (MSquared SolsTIS) at 1012 nm as our spectroscopy laser, in order to excite the transition, where is the upper(lower) hyperfine manifold of the levels.
We lock the frequencies of all three lasers to a stabilized HeNe laser (Melles-Griot 05-STP-901) using a computer-controlled feedback system Zhao et al. (1998).
The linearly polarized spectroscopy laser beam of 350 mW power is focused to 1/ (intensity) diameter of 0.015 cm, using an achromatic lens of 30 cm focal length. The lens is mounted on a translational stage to fine-tune the overlap of the laser beam with the atom cloud. In order to increase the average intensity of the spectroscopy beam across the atom cloud, the beam is re-collimated and re-focused back on itself in a double-pass scheme using a second 30 cm focal length lens and a mirror. An optical isolator (LINOS, FI-980-TI) is necessary to reduce optical feedback into the laser.
We apply a frequency offset between the beam pick off for locking and the spectroscopy laser beam directed at the atom cloud by using an acousto-optic modulator (AOM) in double-pass configuration. We ramp the offset by 18.86 MHz over 12 s (a 37.72 MHz scan across the 7s8s resonance).
We detect the resonance of the transition by collecting 817 nm photons resulting from the decay of atoms from the state to the ground state (D1 line of francium and about 100 nm away from the the D2 line as shown in Fig.1).
We direct the 817 nm photons onto a photomultiplier tube (PMT, Hamamatsu H7422 operated in photon counting mode) using a double-relay optical system. To reduce background counts from the trap beams at 718 nm, we place an edge filter (Semrock LP02-785RU) and a longpass coloured glass filter (Thorlabs FGL780M) in front of the PMT. The 718 nm light scattered by the MOT does not contribute significantly to our background counts. We save PMT data as a function of time for later analysis. The beginning of the offset frequency scan and the beginning of PMT data collection is synchronized using a digital trigger. During the scans, the trap light is cycled on and off with a 2 ms period (50% duty cycle) and with an extinction ratio of 1000:1, while the repumper and spectroscopy light remain on continuously. We collect data when the trap light is off to suppress the ac Stark shift that it produces, as well as to minimize background counts. During each MOT collection-transfer cycle, we perform a single offset frequency scan of the spectroscopy laser.

V Results
The hyperfine interaction splits the states into two hyperfine levels. We measure transition frequencies from the upper hyperfine level of the ground state to the upper hyperfine level of the excited state (Fig. 1) in five different isotopes of francium: 208Fr (radioactive half-life T1/2 = 59 s), 209Fr (50 s), 210Fr (192 s), 211Fr (186 s) and 213Fr (35 s). Fig. 2 shows typical 817 nm fluorescence for scan of the two photon excitation in the isotope 211Fr. 10 scans of 12 s duration each are used to generate this plot. The separation between bins is 157 kHz.
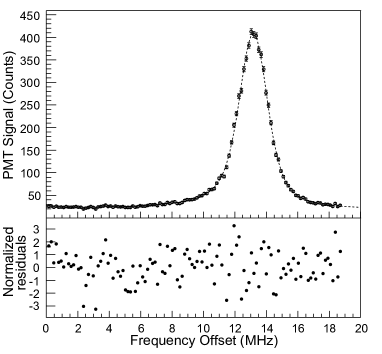
In order to locate the fluorescence peak, we fit the data to a product of an exponentially decaying function and a Voigt function using a computer program that utilizes the ROOT analysis framework. The exponential decay takes into account the exponential rate of loss of atoms from the trap (the 1/ lifetime of the atoms in the trap can be as long as 14 3 s) during the laser scans. The program uses the “MINUIT” function minimization package to find the best parameters that minimize the of the fit Brun and Rademakers (1997). We float the following fit parameters: peak position, background level, width (Lorentzian and Gaussian), decay constant, and peak height. Over the five isotopes, the /(degree of freedom) for the fits varies from 1.2 to 1.8.
The 7 transition energy is given by the relation , where is the offset frequency of the peak from the fit and is the probe laser frequency at the beginning of a scan, i.e. for zero offset frequency, as measured with our wavemeter (Angstrom WS-U-10). The factor of two is due to the two-photon nature of the transition that we excite. We correct the wavemeter reading by comparing it to a diode laser referenced by saturated absorption to the transition of 87Rb Ye et al. (1996).
Using 7 transition energies from our measurements and previously published measurements of the hyperfine splittings of the state of the isotopes Coc et al. (1985), and the hyperfine splitting of the state in 210Fr Simsarian et al. (1999) and considering that the ratio of the hyperfine splittings of the and the states are same across the isotopes (because the difference in hyperfine anomaly is negligible for states with different quantum number), we determine the C.O.G. of the transition in the five isotopes. We obtain the isotope shifts of the transition by subtracting the C.O.G. of the transition in the isotopes from the C.O.G. of the same transition in 213Fr.
We find the 1 error in the peak position obtained from the fitting program to be less than one bin. We assign a conservative estimate of 157 kHz (frequency separation between bins) to the error in the peak position obtained from the fit.
From our data we estimate the uncertainty in the peak position () obtained from the scans to be 1 MHz. For this analysis, we start each laser scan with a similar laser frequency as measured by our wavemeter with 1 MHz resolution. We assign 2 MHz uncertainty to the isotope shift measurements due to non reproducibility of the scans.
The ac Stark shift due to the trap light at 718 nm is reduced by dimming the trap light by a factor of 1000 during data collection yielding a negligible contribution to the uncertainty.
The ac Stark shift of the 1012 nm light that we use to drive the transition was theoretically studied in Ref. Dammalapati et al. (2016). For our typical 1012 nm laser power of 350 mW and beam diameter of 150 m, the estimated shift is 50 kHz. The laser power is typically stable at the 5% level, and the error on our measurements due to this effect is negligible.
The energy levels involved in the transition have similar factors and hence similar Zeeman effects. There is no linear shift in the measured transition frequency due to the magnetic field gradient of 10 G/cm of our MOT (this is due to the selection rule). The cold atom cloud has a diameter of about 1 mm and resides close to the zero of the magnetic field. We do not include any error or systematic shift on the the isotope shift measurements due to magnetic fields.
We add all these errors in quadrature to estimate the uncertainty on our measurements of the transition frequencies of the transition in the five isotopes. In order to determine the error in our calculation of the C.O.G., we use the reported errors in the measurements of the hyperfine constants of the and states from Ref. Coc et al. (1985) and Ref. Simsarian et al. (1999). The results from our measurements and the isotope shifts in the D1 line of francium from Ref. Collister et al. (2014) are shown in Table V. The isotope shifts in the D1 line are calculated for this analysis from data reported in Ref. Collister et al. (2014), using 213Fr as the reference isotope.
| This work | Ref. Collister et al. (2014) | |||
|---|---|---|---|---|
| Isotope | Nuclear spin | |||
| C.O.G. | ||||
| (MHz) | ||||
| 208 | 7 | 19732.58581(18) | -5123(6) | -6341(5) |
| 209 | 9/2 | 19732.53758(15) | -3678(6) | -4563(4) |
| 210 | 6 | 19732.52411(15) | -3274(6) | -4058(4) |
| 211 | 9/2 | 19732.48021(15) | -1958(6) | -2431(4) |
| 213 | 9/2 | 19732.41489(15) | 0 | 0 |
VI King Plot analysis
In order to perform the King Plot analysis, we plot the modified isotope shifts of the D1 line against the modified isotope shift of the transition. This gives a straight line King (1963) according to the relationship
| (15) | ||||
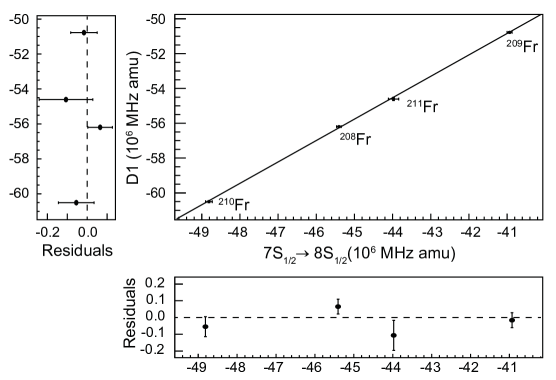
where (), () and () are the normal mass shift, specific mass shift, and the field shift of the D1( ) transition, with as the mass of the reference isotope. The resulting King Plot is shown in Fig.3.
We fit the data obtained from the King Plot to a straight line using a computer program that utilizes the ROOT analysis framework. The program minimizes of the fit using “MINUIT”, taking into account errors in both the horizontal and the vertical axes Press et al. (2007). Fig. 3 shows the fitted straight line to the data. We find the value of /(degree of freedom) from the fit to be 0.54. This corresponds to a P value of 0.58 for our straight line fit to the data. The slope is equal to the ratio of the field shift constants of the D1 transition and of the transition according to Eq. 15. This represents the ratio of the change in electron densities at the nucleus during the corresponding transitions. Since an electron has a larger probability density at the nucleus compared to a electron, the ratio of the field shift constants is expected to be greater than 1. From the fit we find = 1.230 0.019. We compare this result to the theoretical value of (Eq. 14) of 1.234 0.010 from Table 1 and find excellent agreement. From the intercept of the straight line, we find = (0.41 0.85)106 MHz amu. The errors reported here for the slope and the intercept are the 1 errors obtained from the fit. The normal mass shift constant for the D1 transition is = 201 GHz amu, and the normal mass shift constant for the transition is = 325 GHz amu. From this we find : = 214(847) GHz amu.
VII Conclusion
We have observed the electric dipole forbidden transition using two-photon excitation in five different isotopes of francium towards our efforts to perform APNC experiment in this rare alkali atom. Combining our measurements with previous measurements of the transition we have performed a King Plot analysis and extracted the ratio of field shift constants. Our measurements provide benchmarks for theoretical calculations necessary to interpret results of future APNC experiments. Towards this we find excellent agreement between ab initio theory and experiment for the ratio of field shift constants.
VIII Acknowledgements
We thank the ISAC staff at TRIUMF for developing the francium beam and Mikhail Kozlov for helpful discussions. The francium experiment is operated with NSERC (Canada) and NSF PHY-1307536 (USA) grants and was established with equipment funds by DOE (USA) and NSERC (Canada). TRIUMF receives federal funding through a contribution agreement with the National Research Council of Canada. M.S.S. is supported by NSF grant PHY-1620687 (USA) and the UNSW group by the Australian Research Council. M.S.S. thanks the School of Physics at UNSW, Sydney, Australia for hospitality and acknowledges support from the Gordon Godfrey Fellowship program, UNSW. S.A. acknowledges support from Fulbright Canada, and E.G. from CONACYT (Mexico). A.C.dH and M.J.K. were supported in part via the University of Manitoba GETS program.
References
- Gwinner et al. (2007) G. Gwinner, E. Gomez, L. A. Orozco, A. Perez Galvan, D. Sheng, Y. Zhao, G. D. Sprouse, J. A. Behr, K. P. Jackson, M. R. Pearson, S. Aubin, and V. V. Flambaum, “Fundamental symmetries studies with cold trapped francium atoms at ISAC,” in TCP 2006: Proceedings of the 4th International Conference on Trapped Charged Particles and Fundamental Physics (TCP 2006) held in Parksville, Canada, 3–8 September, 2006, edited by J. Dilling, M. Comyn, J. Thompson, and G. Gwinner (Springer Berlin Heidelberg, Berlin, Heidelberg, 2007) pp. 45–51.
- Gomez et al. (2007) E. Gomez, S. Aubin, G. D. Sprouse, L. A. Orozco, and D. P. DeMille, “Measurement method for the nuclear anapole moment of laser-trapped alkali-metal atoms,” Phys. Rev. A 75, 033418 (2007).
- Atutov et al. (2004) S.N. Atutov, V. Biancalana, A. Burchianti, R. Calabrese, L. Corradi, A. Dainelli, V. Guidi, A. Khanbekyan, B. Mai, C. Marinelli, E. Mariotti, L. Moi, S. Sanguinetti, G. Stancari, L. Tomassetti, and S. Veronesi, “Production and trapping of francium atoms,” Nuclear Physics A 746, 421 – 424 (2004).
- Wundt et al. (2012) B. J. Wundt, C. T. Munger, and U. D. Jentschura, “Quantum dynamics in atomic-fountain experiments for measuring the electric dipole moment of the electron with improved sensitivity,” Phys. Rev. X 2, 041009 (2012).
- Inoue et al. (2015) T. Inoue, S. Ando, T. Aoki, H. Arikawa, S. Ezure, K. Harada, T. Hayamizu, T. Ishikawa, M. Itoh, K. Kato, H. Kawamura, A. Uchiyama, T. Aoki, K. Asahi, T. Furukawa, A. Hatakeyama, K. Hatanaka, K. Imai, T. Murakami, H. S. Nataraj, T. Sato, Y. Shimizu, T. Wakasa, H. P. Yoshida, A. Yoshimi, and Y. Sakemi, “Experimental search for the electron electric dipole moment with laser cooled francium atoms,” Hyperfine Interactions 231, 157–162 (2015).
- King (1984) W. H. King, Isotope Shifts in Atomic Spectra, Physics of Atoms and Molecules (Plenum, New York,, 1984).
- Laatiaoui et al. (2016) M. Laatiaoui, W. Lauth, H. Backe, M. Block, D. Ackermann, B. Cheal, P. Chhetri, C. E. Düllmann, P. van Duppen, J. Even, R. Ferrer, F. Giacoppo, S. Götz, F. P. Heßberger, M. Huyse, O. Kaleja, J. Khuyagbaatar, P. Kunz, F. Lautenschläger, A. K. Mistry, S. Raeder, E. M. Ramirez, T. Walther, C. Wraith, and A. Yakushev, “Atom-at-a-time laser resonance ionization spectroscopy of nobelium,” Nature (London) 538, 495 (2016).
- Dzuba et al. (2017) V. A. Dzuba, V. V. Flambaum, and J. K. Webb, “Isotope shift and search for metastable superheavy elements in astrophysical data,” Phys. Rev. A 95, 062515 (2017).
- Shi et al. (2017) C. Shi, F. Gebert, C. Gorges, S. Kaufmann, W. Nörtershäuser, B. K. Sahoo, A. Surzhykov, V. A. Yerokhin, J. C. Berengut, F. Wolf, J. C. Heip, and P. O. Schmidt, “Unexpectedly large difference of the electron density at the nucleus in the fine-structure doublet of Ca+,” Appl. Phys. B 123, 2 (2017).
- Berengut et al. (2017) J. C. Berengut, D. Budker, C. Delaunay, V. V. Flambaum, C. Frugiuele, E. Fuchs, C. Grojean, R. Harnik, R. Ozeri, G. Perez, and Y. Soreq, “Probing new light force-mediators by isotope shift spectroscopy,” ArXiv e-prints (2017), arXiv:1704.05068 [hep-ph] .
- Bennett and Wieman (1999) S. C. Bennett and C. E. Wieman, “Measurement of the transition polarizability in atomic cesium and an improved test of the standard model,” Phys. Rev. Lett. 82, 2484–2487 (1999).
- Wood et al. (1999) C S Wood, S C Bennett, J L Roberts, D Cho, and C E Wieman, “Precision measurement of parity nonconservation in cesium,” Canadian Journal of Physics 77, 7–75 (1999).
- Bouchiat et al. (1982) M.A. Bouchiat, J. Guena, L. Hunter, and L. Pottier, “Observation of a parity violation in cesium,” Physics Letters B 117, 358 – 364 (1982).
- Grossman et al. (1999) J. S. Grossman, L. A. Orozco, M. R. Pearson, J. E. Simsarian, G. D. Sprouse, and W. Z. Zhao, “Hyperfine anomaly measurements in francium isotopes and the radial distribution of neutrons,” Phys. Rev. Lett. 83, 935–938 (1999).
- Zhang et al. (2015) J. Zhang, M. Tandecki, R. Collister, S. Aubin, J. A. Behr, E. Gomez, G. Gwinner, L. A. Orozco, M. R. Pearson, and G. D. Sprouse (FrPNC collaboration), “Hyperfine anomalies in fr: Boundaries of the spherical single particle model,” Phys. Rev. Lett. 115, 042501 (2015).
- E. Gomez and Sprouse (2005) L. A. Orozco E. Gomez and G. D. Sprouse, “Spectroscopy with trapped francium: advances and perspectives for weak interaction studies,” Reports on Progress in Physics 69 (2005).
- Cagnac and Biraben (1973) G. Cagnac, B. Grynberg and F. Biraben, J. Physique 34, 845 (1973).
- King (1963) W. H. King, “Comments on the article “peculiarities of the isotope shift in the samarium spectrum”,” J. Opt. Soc. Am. 53, 638–639 (1963).
- Heilig and Steudel (1974) K. Heilig and A. Steudel, “Changes in mean-square nuclear charge radii from optical isotope shifts,” Atomic Data and Nuclear Data Tables 14, 613 – 638 (1974).
- Safronova and Johnson (2008) M. S. Safronova and W. R. Johnson, “All-Order Methods for Relativistic Atomic Structure Calculations,” Advances in Atomic Molecular and Optical Physics 55, 191 (2008).
- Coester and Kümmel (1960) F. Coester and H. Kümmel, Nucl. Phys. 17, 477 (1960).
- Johnson (2007) W. R. Johnson, Atomic structure theory: Lectures on Atomic Physics (Springer-Verlag, Berlin, Heidelberg, New York, 2007).
- Dzuba et al. (2005) V. A. Dzuba, W. R. Johnson, and M. S. Safronova, “Calculation of isotope shifts for cesium and francium,” Phys. Rev. A 72, 022503 (2005), physics/0504103 .
- Zhang et al. (2016) J. Zhang, R. Collister, K. Shiells, M. Tandecki, S. Aubin, J. A. Behr, E. Gomez, A. Gorelov, G. Gwinner, L. A. Orozco, M. R. Pearson, and Y. Zhao, “Efficient inter-trap transfer of cold francium atoms,” Hyperfine Interactions 237, 150 (2016).
- Tandecki et al. (2013) M. Tandecki, J. Zhang, R. Collister, S. Aubin, J. A. Behr, E. Gomez, G. Gwinner, L. A. Orozco, and M R Pearson, “Commissioning of the francium trapping facility at TRIUMF,” Journal of Instrumentation 8, P12006 (2013).
- Collister et al. (2014) R. Collister, G. Gwinner, M. Tandecki, J. A. Behr, M. R. Pearson, J. Zhang, L. A. Orozco, S. Aubin, and E. Gomez (FrPNC Collaboration), “Isotope shifts in francium isotopes and ,” Phys. Rev. A 90, 052502 (2014).
- Zhao et al. (1998) W. Z. Zhao, J. E. Simsarian, L. A. Orozco, and G. D. Sprouse, “A computer-based digital feedback control of frequency drift of multiple lasers,” Review of Scientific Instruments 69, 3737–3740 (1998).
- Brun and Rademakers (1997) Rene Brun and Fons Rademakers, “Root an object oriented data analysis framework,” Nuclear Instruments and Methods in Physics Research Section A: Accelerators, Spectrometers, Detectors and Associated Equipment 389, 81 – 86 (1997).
- Ye et al. (1996) Jun Ye, Steve Swartz, Peter Jungner, and John L. Hall, “Hyperfine structure and absolute frequency of the 87Rb 5P3/2 state,” Opt. Lett. 21, 1280–1282 (1996).
- Coc et al. (1985) A. Coc, C. Thibault, F. Touchard, H.T. Duong, P. Juncar, S. Liberman, J. Pinard, J. Lermé, J.L. Vialle, S. Büttgenbach, A.C. Mueller, and A. Pesnelle, “Hyperfine structures and isotope shifts of 207-213,220-228Fr; possible evidence of octupolar deformation,” Physics Letters B 163, 66 – 70 (1985).
- Simsarian et al. (1999) J. E. Simsarian, W. Z. Zhao, L. A. Orozco, and G. D. Sprouse, “Two-photon spectroscopy of the francium level,” Phys. Rev. A 59, 195–199 (1999).
- Dammalapati et al. (2016) U. Dammalapati, K. Harada, and Y. Sakemi, “Magic and tune-out wavelengths for atomic francium,” Phys. Rev. A 93, 043407 (2016).
- Coursey et al. (2015) J.S. Coursey, D.J. Schwab, J.J. Tsai, and R.A. Dragoset, Atomic Weights and Isotopic Compositions (version 4.1). [Online] Available: http://physics.nist.gov/Comp [2017,04, 07] (National Institute of Standards and Technology, Gaithersburg, MD, 2015).
- Press et al. (2007) William H. Press, Saul A. Teukolsky, William T. Vetterling, and Brian P. Flannery, Numerical Recipes 3rd Edition: The Art of Scientific Computing, 3rd ed. (Cambridge University Press, New York, NY, USA, 2007).