The Circum-Galactic Medium of MASsive Spirals II: Probing the Nature of Hot Gaseous Halo around the Most Massive Isolated Spiral Galaxies
Abstract
We present the analysis of the XMM-Newton data of the Circum-Galactic Medium of MASsive Spirals (CGM-MASS) sample of six extremely massive spiral galaxies in the local Universe. All the CGM-MASS galaxies have diffuse X-ray emission from hot gas detected above the background extending from the galactic center. This doubles the existing detection of such extended hot CGM around massive spiral galaxies. The radial soft X-ray intensity profile of hot gas can be fitted with a -function with the slope typically in the range of . This range, as well as those values measured for other massive spiral galaxies, including the Milky Way (MW), are in general consistent with X-ray luminous elliptical galaxies of similar hot gas luminosity and temperature, and with those predicted from a hydrostatic isothermal gaseous halo. Hot gas in such massive spiral galaxy tends to have temperature comparable to its virial value, indicating the importance of gravitational heating. This is in contrast to lower mass galaxies where hot gas temperature tends to be systematically higher than the virial one. The ratio of the radiative cooling to free fall timescales of hot gas is much larger than the critical value of throughout the entire halos of all the CGM-MASS galaxies, indicating the inefficiency of gas cooling and precipitation in the CGM. The hot CGM in these massive spiral galaxies is thus most likely in a hydrostatic state, with the feedback material mixed with the CGM, instead of escaping out of the halo or falling back to the disk. We also homogenize and compare the halo X-ray luminosity measured for the CGM-MASS galaxies and other galaxy samples and discuss the “missing” galactic feedback detected in these massive spiral galaxies.
Subject headings:
(galaxies:) intergalactic medium — X-rays: galaxies — galaxies: haloes — galaxies: spiral — galaxies: evolution — galaxies: fundamental parameters.1. Introduction
Isolated spiral galaxies are expected to host hot gaseous halos which can be produced either by various types of galactic feedback or by the accretion and gravitational compression of external gas. Feedback from AGN, supernovae (SNe), or massive stellar winds can produce strong X-ray emission in the halos of galaxies with a broad range of mass (e.g., Strickland04; Tullmann06; Li13a). On the other hand, external gas accreted onto the galaxies can only be heated gravitationally to the virial temperature of the dark matter halo in massive galaxies (via hot mode accretion, e.g., Keres09). Since the radiative cooling curve of typical circum-galactic medium (CGM) peaks at where far-UV lines of highly ionized ions emit efficiently (e.g., Sutherland93), only gas at X-ray emitting temperatures above this peak of the cooling curve are expected to be stable in the halo. Therefore, only in a galaxy with mass comparable to or greater than that of the Milky Way (MW) Galaxy (with a rotational velocity of and a virial temperature of ) do we expect to find a hydrostatic, volume-filling, X-ray-emitting gaseous halo.
In addition to the instability of the gravitationally heated gas in low- or intermediate-mass halos, another problem preventing us from finding the accreted hot gas is the contamination from feedback material. Archival X-ray observations are often biased to galaxies with high star formation rates (SFRs); only a few observations were available for quiescent ones. These actively star forming galaxies eject chemically enriched gas into their halos, which dominates the X-ray emission around galactic disks (typically within 10-20 kpc). In this case, the accreted gas, although significant in the mass budget, can only radiate in X-ray efficiently after they well mix with the metal enriched feedback material (e.g., Crain13). Therefore, in order to study the effect of gravitational heating of the diffuse X-ray emitting halo gas, we prefer galaxies with low SFR.
Extended X-ray emitting halos have been detected around various types of galaxies (see a review in Wang10). The X-ray luminosity of the halo gas is typically linearly dependent on the disk SFR and is thought to be mostly produced by galactic SNe feedback (e.g., Strickland04; Tullmann06; Li08; Li13b; Wang16), although sometimes Type Ia SNe from quiescent galaxies may play an important role (e.g., Li09; Li15). Comparison with numerical simulations indicates that models could in general reproduce the X-ray luminosity of galaxies (e.g., Crain10; Li14).
On the other hand, the picture is much less clear for spiral galaxies significantly more massive than the MW. Although the hot CGM produced by gravitationally heated externally accreted gas has been predicted many years ago (e.g., Benson00; Toft02), there are just a few deep X-ray observations of massive enough spiral galaxies whose virial temperature is in the X-ray range (e.g., Li06; Li07; Rasmussen09; Anderson11; Anderson16; Dai12; Bogdan13; Bogdan15) and some of them do not have an extended X-ray emitting halo detected significantly beyond the galactic disk and bulge.
We have conducted deep XMM-Newton observations of a sample of five (six by adding the archival observation of UGC 12591) massive isolated spiral galaxies in the local Universe [The Circum-Galactic Medium of MASsive Spirals (CGM-MASS) project]. All these galaxies have low SFRs compared to their large stellar masses (Table 1). An introduction of the sample selection criteria and detailed data reduction procedures, as well as an initial case study of NGC 5908, are presented in Li16b (Paper I). Particularly interesting is that the ratio of this massive isolated spiral galaxy is not significantly higher than those of lower mass non-starburst galaxies.
Here we present results from the analysis of the XMM-Newton data of the whole CGM-MASS sample, including the archival data of UGC 12591 (Dai12). The reanalysis of this archival data is to make sure that the data reduction and analysis processes are uniform for all the galaxies, which is a key for statistical analysis. The paper is organized as follows: In §2, we present the results from analyzing the XMM-Newton data of the sample galaxies, including both the spatial and spectral analysis and the derivation of other physical parameters of the hot gas. Some additional details of data analysis, as well as the properties of the prominent extended and point-like X-ray sources in the XMM-Newton field of view (FOV), are presented in Appendix LABEL:Appsection:DataReduction. We then introduce other galaxy samples used for comparison in §LABEL:sec:OtherSample. We perform statistical analysis comparing the CGM-MASS galaxies to other samples in §LABEL:sec:Statistical and discuss the scientific implications of the results in §LABEL:section:discussion. Our main results and conclusions are summarized in §LABEL:section:Summary. Spatial and spectral analysis based on the stacked data of the whole sample and discussions on the baryon budget will be presented in Li17 (Paper III). Errors are quoted at 1 confidence level throughout the paper unless specifically noted.
2. Data Analysis of the CGM-MASS Galaxies
2.1. Multi-wavelength galaxy properties
We first update a few parameters of our sample galaxies (Table 1). In Paper I, the stellar mass of each galaxies () is estimated from its total K-band magnitude listed in the 2MASS extended source catalog (Skrutskie06). This magnitude includes the contribution from the galactic nucleus. In the present paper, we exclude the nuclear point-like source and fit the remaining intensity profile along the major axis of the galaxy with an exponential model. The integrated K-band luminosity of this exponential model is then converted to the stellar mass using the same method as adopted in Paper I. We consider the best estimate as the integration extrapolated into the center. We assume the stellar mass estimated without excluding the nuclear source as the upper limit and the integration without extrapolating on to the center as the lower limit of the estimate. All the stellar mass and its upper and lower limits are calculated within an elliptical region for which the semi-major and semi-minor axis are at the isophotal level of .
In Paper I, the SFR of a galaxy is estimated from its IRAS total IR luminosity. We herein update this estimate based on the spatially resolved WISE W4 (22 ) image, using a similar method as adopted in Wang16.
We caution that the estimate of the stellar mass and SFR may be affected by some systematical biases caused by the enhanced extinction in the edge-on case. Although the CGM-MASS galaxies have low SFRs and cold gas contents so a relatively low extinction especially in IR (Li et al. 2018, in prep), the extinction may not be negligible even in the WISE W4 band, as discussed in Li16a. Therefore, we do not adopt stellar mass and SFR measurements in shorter wavelength (e.g., Maraston13; Vargas et al. 2017, submitted), which are in general more reliable in face-on cases.
We also obtain the total baryonic mass of the galaxy () from the rotation velocity (; Table 1 of Paper I) using the baryonic Tully-Fisher relation (Bell01). is a measurement of the gravitational mass, similar as the dark matter halo mass, and is listed here for the ease of comparison with other samples (e.g., Li13a; §LABEL:subsec:EnergyBudget).
| Galaxy | Scale | SFR | |||
|---|---|---|---|---|---|
| kpc/arcm | |||||
| UGC 12591 | 27.45 | 0.773 | |||
| NGC 669 | 22.63 | 0.893 | 5.32 | ||
| ESO142-G019 | 18.78 | 1.137 | |||
| NGC 5908 | 15.10 | 0.842 | |||
| UGCA 145 | 20.17 | 0.595 | 4.03 | ||
| NGC 550 | 27.09 | 0.773 |
Updated parameters from Paper I: the stellar mass, , measured from the 2MASS K-band luminosity and the K-band mass-to-light ratio () of the galaxies; is estimated from the inclination, redshift, and Galactic extinction corrected B-V color, except for UGCA 145, for which the corrected B-R color is used (§2.1); SFR estimated from the WISE 22 luminosity (§2.1); the total baryon mass, , estimated from the inclination corrected rotation velocity and the baryonic Tully-Fisher relation (Bell01), and is used to produced Fig. LABEL:fig:Ebudgetb. Some other parameters of the sample galaxies, such as the distance (94.4 Mpc for UGC 12591), ( for UGC 12591), ( for UGC 12591), and (601 kpc for UGC 12591), are listed in Paper I.
2.2. Spatial analysis of the diffuse X-ray emission
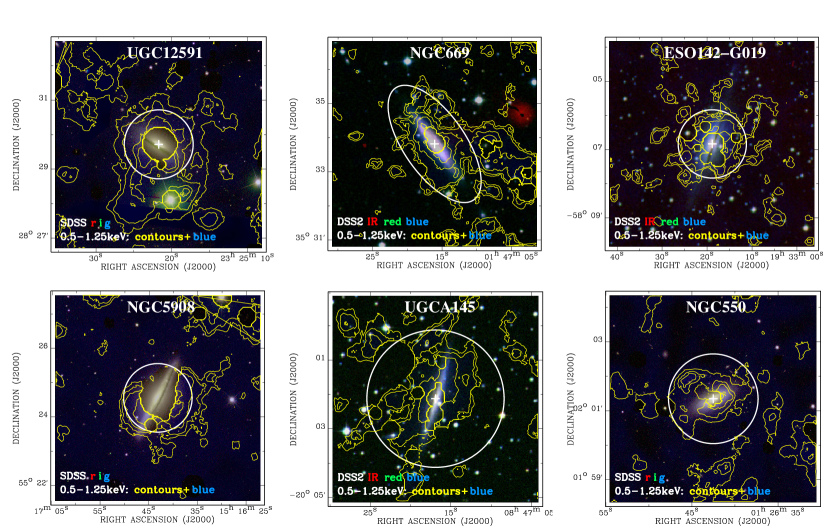
We present additional information on the XMM-Newton data reduction and the results on the prominent extended or point-like sources in Appendix LABEL:Appsection:DataReduction. We present the major results on the diffuse hot gas emission in the following sections. In Fig. 1, we present the point source removed, soft proton and quiescent particle background (QPB) subtracted, exposure corrected, and adaptively smoothed 0.5-1.25 keV XMM-Newton image in the central of the CGM-MASS galaxies, in order to show how the diffuse X-ray emission may be associated with the target galaxies.
We present QPB-subtracted, exposure corrected 0.5-1.25 keV radial intensity profiles around the centers of the target galaxies in Fig. 2. X-ray emission in this band has the largest contribution from hot gas and is not seriously affected by the strong instrumental lines (especially the strong Al-K and Si-K lines; Fig. LABEL:fig:bckspec). The profiles are extracted from the unsmoothed images. We have removed all the detected X-ray point sources and extended X-ray emissions not associated with the target galaxies when creating these radial intensity profiles. Prominent removed extended and point-like features are described in Appendix LABEL:subsection:XMMImages and LABEL:subsection:Xpointsrc, and the masks used to remove them are presented in Fig. LABEL:fig:SourceDiffuseMask. The intensity profiles are also regrouped to a signal-to-noise ratio of for each bin, where the noise includes the contributions from the removed QPB.
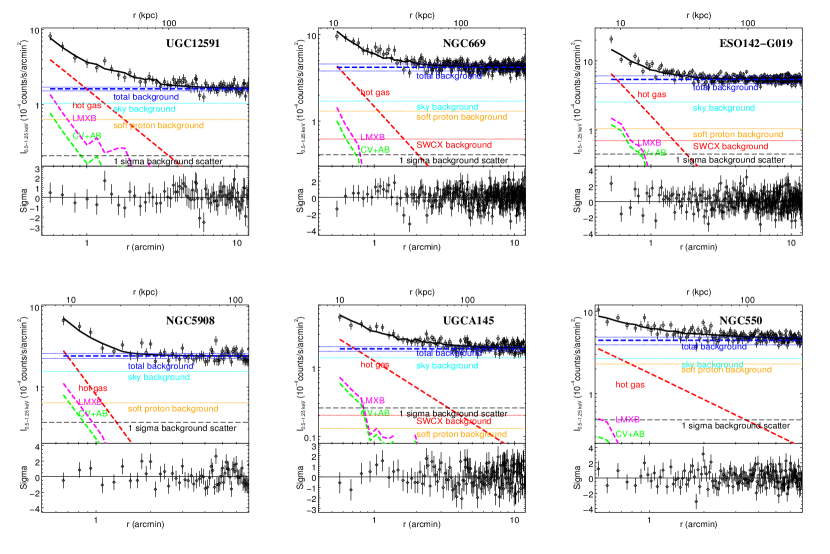
We fit the soft X-ray intensity profile with a -function plus various stellar and background components. For all the CGM-MASS galaxies, the deep XMM-Newton observations reach a 0.3-7.2 keV point source detection limit of (UGC 12591 has a higher value of ; Table LABEL:table:IdentifiedSources), allowing us to remove the brightest X-ray sources from the diffuse emission. Below this detection limit, there are still contributions from individually X-ray faint stellar sources, including Low Mass X-ray Binaries (LMXBs) and Cataclysmic Variables plus coronal Active Binaries (CVs+ABs). We scale both the LMXB and CV+AB components to the near-IR (K-band) intensity profile tracing the radiation of old stellar population, using the calibrated ratios from Gilfanov04 and Revnivtsev08 and a similar procedure adopted in the study of some quiescent early-type disk galaxies Li09; Li11. No contributions from young stellar sources are considered in this paper, which is typically less important at large radii for these quiescent galaxies (see also discussions in §2.3).
After subtracting the QPB, the residual X-ray background typically includes two components: the cosmic X-ray background produced by the local hot bubble, the Milky Way halo, and distant AGN (e.g., Li08), and the residual soft proton contribution (e.g., Kuntz08). For some galaxies, we also add a background component from SWCX. Detailed background analysis of the sample galaxies are presented in §LABEL:subsection:SWCX and Fig. LABEL:fig:bckspec. In analysis of the radial intensity profile, we directly fit the background with a constant level. This best-fit background level is in general consistent with expected from the summation of different background components (sky, soft proton, and sometimes SWCX). However, there may be some systematical uncertainties of the background, such as the intrinsic uncertainties of different stellar and background components, which are difficult to quantify. We roughly characterize this systematical uncertainty using the standard deviation of the total background level estimated in three different ways: (1) the direct fit with the stellar components fixed as presented in Fig. 2; (2) fit with the stellar components allowed to vary for 50%; (3) the summation of the rescaled sky, soft proton, and SWCX background components from spectral analysis (also marked in Fig. 2). The systematical uncertainty estimated this way is typically comparable to or larger than the 1 statistical error. The total systematical and statistical uncertainties of the background are plotted in Fig. 2, in comparison with the 1 background fluctuation.
The best-fit models of the radial intensity profiles are presented in Fig. 2. The hot gas component is fitted with a -function:
| (1) |
where is the X-ray intensity at . As shown in Fig. 2, due to the presence of X-ray bright sources in the nuclear region, the radial intensity profiles are extracted typically at . Therefore, the core radius of the -function is poorly constrained and only affect (not ) of the -function. We then fix at which is much smaller than the radius of the removed nuclear region of the AGN. The best fit values of (depends on the assumed ) and are listed in Table 2. Extended diffuse soft X-ray emission can typically be detected above the 1 scatter of the background to around individual galaxies (Fig. 2). The slope of the radial intensity profile is typically , with NGC 5908 studied in Paper I has the steepest radial intensity distribution (). For these quiescent galaxies, there is no significant evidence of the variation of the slope of the radial intensity profile at . We will discuss the radial distribution of hot gas based on the stacked X-ray intensity profile in Paper III.
2.3. Spectral analysis of the diffuse X-ray emission
We extract diffuse X-ray spectra of individual CGM-MASS galaxies after subtracting the detected X-ray point-like sources and the unrelated prominent diffuse X-ray features from the circular or elliptical regions shown in Fig. 1. These spectral analysis regions enclose the most prominent diffuse X-ray features associated with the galaxy.
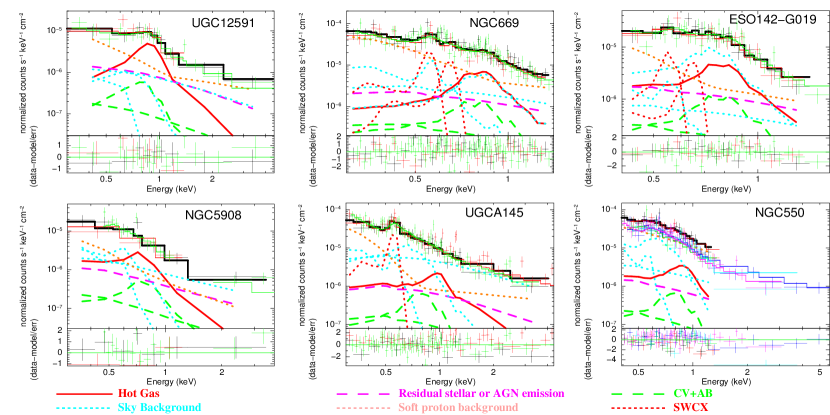
We rescale all the background model components (according to the area scale of the spectral analysis regions), as well as the LMXB and the CV+AB components (according to the K-band luminosity enclosed by the spectral analysis regions), and add them to the model of the source spectra. Model parameters of different background and stellar components are discussed in Appendix LABEL:subsection:SWCX and Paper I. In particular, we adopt a power law to model the LMXB component, and a thermal plasma plus a power law to model the CV+AB component. The normalization of these model components are computed with the stellar mass enclosed by the spectral analysis regions. Young stellar contributions, such as high mass X-ray binaries (HMXBs), are difficult to quantify, because they mainly distribute in the galactic disk or nuclear regions, which are largely removed in spectral analysis and highly absorbed in edge-on cases. Using a similar procedure as Paper I and adopting the new estimates of SFRs (Table 1), we can compute the upper limits of HMXB contributions (without considering the removed regions or the additional absorption by the cool gas in the galactic disk), which is in 0.5-2 keV for the CGM-MASS galaxies. This luminosity is typically of the diffuse hot gas emission (Table 2). We therefore do not consider an additional component describing the young stellar contribution in these extremely quiescent galaxies. All parameters of the background and stellar components discussed above are fixed.
We model the hot gas emission with an “APEC” model, which is subjected to absorption at a column density of the Galactic foreground value (listed in Table 1 of Paper I). The metallicity of hot gas is poorly constrained, so we fix it at , which is consistent with some recent estimates (e.g., Bogdan13; Anderson16). We also add a gain correction to the response file of the PN spectrum (“GAIN” model in XSpec), in order to account for the deficiency in the low-energy calibration of the PN camera (Dennerl04). Such a gain correction has been proved to be important in analyzing the XMM-Newton data taken in recent years (e.g., Li15b; Li16c). The slope of the GAIN is fixed at 1 and the offset is set free. Finally, there are only three free parameters: the temperature and normalization (or X-ray luminosity) of APEC and the offset of GAIN. The fitted spectra of each galaxy are presented in Fig. 3 and the best-fit hot gas temperature and 0.5-2.0 keV luminosity () are summarized in Table 2.
We also analyze the diffuse X-ray spectra extracted from larger radii, but the hot gas emission is too weak compared to various background components (see Fig. 2 for their levels) and the counting statistic is also poor. The measured hot gas properties are largely uncertain. Therefore, in the following discussions, we assume constant hot gas temperature and metallicity, and estimate the X-ray emission of hot gas based on extrapolation of the best-fit radial intensity profile.
In the next few sections, we will statistically compare the X-ray luminosity of the hot halo measured at small and large radii to other samples. However, X-ray emission of the CGM-MASS galaxies are only directly detected to ( for the CGM-MASS galaxies; Paper I). We therefore need to rescale the directly measured hot gas luminosity in the spectral analysis region using the best-fit -function of the radial intensity profiles (Equ. 1). By doing such rescaling, we have assumed Equ. 1 can be extrapolated to both smaller and larger radii, which further means there is no significant contribution from young stellar sources within the galactic disk and the hot gas within the entire halo follows the same slope of radial distribution as the gas close to the galaxy’s stellar content. These assumptions will be further discussed in Paper III. The rescaled at , , and are also listed in Table 2.
2.4. Derived hot gas properties
We estimate the hot gas properties at a given radius, based on the results from the above spatial (§2.2) and spectral analyses (§2.3), and following a similar procedure as described in Ge16. Assuming spherical symmetric distribution of the hot halo gas which also follows a -model in radial distribution, the deprojected hydrogen density profile can be written as:
| (2) |
where and are the same as in Equ. 1, and is the hydrogen number density at . Assuming the temperature and metallicity of hot gas do not change with the galactocentric radius, can be expressed with the parameters of the radial intensity profile and the spectral models (, , , , ) in the following form (converted from Equ. 10 of Ge16):
| (3) |
where is the gamma function; is in unit of ; in , in Mpc, and are obtained from fitting the radial intensity profile; is the electron to hydrogen number density ratio at a given metallicity, assuming all the elements are fully ionized; is the conversion factor from the normalization of the APEC model to the counts rate (0.5-1.25 keV, scaled to MOS-2 with a medium filter) in unit of . and depend on the spectral model. They are calculated from the best-fit APEC model describing the hot gas emission of each galaxy and are assumed to be constant at different radii.
The thermal pressure of hot gas at a given radius can be expressed as:
| (4) |
where is the total particle number density including both ions and electrons, is the Boltzmann constant and is the temperature of the hot gas. Similar as , also depends on the spectral model. The thermal pressure at can be expressed with as:
| (5) |
We also calculate the radiative cooling timescale of the hot gas based on the density profile:
| (6) |
where, is the internal energy of the hot gas, is the normalized radiative cooling rate in unit of . We adopt for the , thermal plasma from Sutherland93. The radiative cooling timescale at can be expressed as:
| (7) |
Using Equ. 6, we can derive the cooling radius which is defined as the galactocentric radius at which the radiative cooling timescale equals to the Hubble time . can be expressed as:
| (8) |
We also derive the column density of hot gas at a given projected distance from the galactic center:
| (9) |
where is the column density along the sightline through the galactic center, and can be expressed as (Ge16):
| (10) |
where is in unit of and in Mpc. Equ. 10 is valid for (Ge16).
By integrating the density and energy density profiles (differs from the pressure profile by a factor of ) of the hot gas, we can obtain the total mass and thermal energy of hot gas within a given radius:
| (11) |
| (12) |
where . The integral part containing the dimensionless parameter can be computed with numerical integration.
We can also compute the radiative cooling rate of the hot gas, which is defined as: . can be computed with:
| (13) |
We list , , , (calculated assuming ), , as well as and calculated at and calculated at in Table LABEL:table:LXRadii. We have adopted and which are calculated assuming 0.2 solar metallicity of the hot gas. We do not account for the error of when computing the error of , , and using the integration term.
| Galaxy | ||||||||
|---|---|---|---|---|---|---|---|---|
| arcmin | keV | |||||||
| UGC 12591 | 1.0 | |||||||
| NGC 669 | ||||||||
| ESO142-G019 | 1.0 | |||||||
| NGC 5908 | 1.0 | |||||||
| UGCA 145 | 2.0 | |||||||
| NGC 550 | 1.3 |
and are parameters of the -function used to fit the radial intensity distribution of the hot gas component (Equ. 1), where is fixed at . is the outer radius (or the major and minor radius of the elliptical region of NGC 669) of the spectral analysis regions as plotted in Fig. 1. is the hot gas temperature measured within the spectral analysis region. is measured in 0.5-2.0 keV after correcting the Galactic foreground extinction. is directly measured within the spectral analysis regions, while , , and have been rescaled to different galactocentric radii, assuming the best-fit -function of the radial intensity profile, after correcting for the removed point sources or extended features.