Spectral analysis of four surprisingly similar hot hydrogen-rich subdwarf O stars
Abstract
Context. Post-extreme horizontal branch stars (post-EHB) are helium-shell burning objects evolving away from the EHB and contracting directly towards the white dwarf regime. While the stars forming the EHB have been extensively studied in the past, their hotter and more evolved progeny are not so well characterized.
Aims. We perform a comprehensive spectroscopic analysis of four such bright sdO stars, namely Feige 34, Feige 67, AGK$+$81$°$266, and LS II$+$18$°$9, among which the first three are used as standard stars for flux calibration. Our goal is to determine their atmospheric parameters, chemical properties, and evolutionary status to better understand this class of stars that are en route to become white dwarfs.
Methods. We used non-local thermodynamic equilibrium model atmospheres in combination with high quality optical and UV spectra. Photometric data were also used to compute the spectroscopic distances of our stars and to characterize the companion responsible for the infrared excess of Feige 34.
Results. The four bright sdO stars have very similar atmospheric parameters with between 60 000 and 63 000 K and log (cm s-2) in the range 5.9 to 6.1. This places these objects right on the theoretical post-EHB evolutionary tracks. The UV spectra are dominated by strong iron and nickel lines and suggest abundances that are enriched with respect to those of the Sun by factors of 25 and 60. On the other hand, the lighter elements, C, N, O, Mg, Si, P, and S, are depleted. The stars have very similar abundances, although AGK$+$81$°$266 shows differences in its light element abundances. For instance, the helium abundance of this object is 10 times lower than that observed in the other three stars. All our stars show UV spectral lines that require additional line broadening that is consistent with a rotational velocity of about 25 km s-1. The infrared excess of Feige 34 is well reproduced by a M0 main-sequence companion and the surface area ratio of the two stars suggests that the system is a physical binary. However, the lack of radial velocity variations points towards a low inclination and/or long orbital period. Spectroscopic and Hipparcos distances are in good agreement for our three brightest stars.
Conclusions. We performed a spectroscopic analysis of four hot sdO stars that are very similar in terms of atmospheric parameters and chemical compositions. The rotation velocities of our stars are significantly higher than what is observed in their immediate progenitors on the EHB, suggesting that angular momentum may be conserved as the stars evolve away from the EHB.
Key Words.:
Stars: atmospheres – Stars: fundamental parameters – Stars: abundances – subdwarfs1 Introduction
Hot subluminous stars of spectral type B and O (sdB and sdO) form the blue extension of the horizontal branch (EHB) in the Hertzsprung-Russell diagram. These stars represent the helium burning stage of low mass main-sequence stars (1.0 ) that lost almost all of their hydrogen envelope during the red giant phase (Heber 2009, 2016). The sdO spectral type includes stars that have effective temperatures above 38 000 K and surface gravities in the range 4.6 log 6.4. As for their helium abundance, it varies from one hundredth to a thousand times solar. Given this large spread the sdOs are usually divided into the He-rich and H-rich subclasses with the majority of sdOs belonging to the He-rich class. Indeed among the 58 sdOs analysed by Stroeer et al. (2007), two-thirds had helium-rich atmospheres (He-sdOs) and between 40 and 50 kK, while the remaining one-third had hydrogen-rich atmospheres (H-sdOs) and were evenly distributed across the temperature range. A similar pattern was also found by Németh et al. (2012). In addition, the He-sdOs usually have an atmosphere that is also enriched in carbon and/or nitrogen. The different characteristics of the two spectral classes of sdO are explained by their different origins (Napiwotzki 2008). The H-rich sdOs are believed to be directly linked to sdBs. They represent the He-shell burning phase, usually referred to as the post-EHB phase, directly following the He-core burning stage that occurs on the EHB (Dorman et al. 1993; Han et al. 2003). H-sdOs and sdBs are also naturally linked by the fact that they both have atmospheres depleted in helium. On the other hand, He-sdOs are not believed to be evolutionarily linked to the sdBs, but have their own evolutionary channels, such as late flashers or white dwarf mergers (D’Cruz et al. 1996; Miller Bertolami et al. 2008; Zhang & Jeffery 2012).
While many sdB stars have been studied in detail for abundance analyses based on UV (Blanchette et al. 2008; O’Toole & Heber 2006) and optical spectroscopy (Geier 2013), very few studies have looked at the chemical composition of their hotter sdO progeny. Because of their relatively cool effective temperatures, sdB spectra can be analysed with model atmospheres assuming local thermodynamic equilibrium (LTE), which are rather fast and simple to compute. However the LTE approximation no longer holds at the high temperature of sdO stars, and more sophisticated and time consuming non-LTE (NLTE) modelling is required. In addition, the hottest sdOs show very few metal lines in their optical spectrum, thus scarcely revealing information concerning their atmospheric composition. This mostly explains why only a handful of spectroscopic analyses of H-rich sdO stars have been performed. Up to now three such stars have been studied in detail: AA Dor, Feige 110, and BD$+$28$°$4211 (Fleig et al. 2008; Klepp & Rauch 2011; Rauch et al. 2014; Latour et al. 2013).
In this work we add four additional stars to the, as yet, rather small sample of thoroughly analysed H-sdOs, namely Feige 34, Feige 67, AGK$+$81$°$266, and LS II$+$18$°$9. For these four targets we used high quality optical spectra, UV data from FUSE111Far Ultraviolet Spectroscopic Explorer and IUE222International Ultraviolet Explorer and photometry to perform our comprehensive spectroscopic analysis. In Sect. 2 we present these four stars by summarising current literature information about the stars. We then describe the optical and UV data used in our work in Sect. 3. This is followed by our determination of the atmospheric parameters and chemical abundances in Sect. 4 and 5. In Sect. 6 we use photometric data to derive spectroscopic distances and characterize the infrared excess of Feige 34. Finally we discuss our results in Sect. 7 and briefly conclude in Sect. 8.
2 The quartet: Feige 34, Feige 67, AGK$+$81$°$266, and LS II$+$18$°$9
Despite the relative brightness of our four stars and the status of optical and UV spectrophotometric standard stars for the three stars Feige 34, Feige 67 and AGK$+$81$°$266 (Oke 1990; Turnshek et al. 1990), information regarding their fundamental parameters and elemental abundances is rather scarce. In this section we briefly present the stars included in our analysis.
With a magnitude of 11.14, Feige 34 is the brightest star in our sample. Thejll et al. (1991) first adopted 80 000 K and log = 5.0 by comparing its optical spectrum with that of BD$+$28$°$4211. The main goal of their study was to characterize the infrared excess of the star, which they found to be most likely originating from a cooler main-sequence companion. The surface gravity of the star was then increased to log = 6.8, based on photometric fitting and the parallax value (Thejll et al. 1995). The temperature of the star was revised by Haas (1997) to 60 000 K using the ionization equilibrium of iron and nickel lines present in the IUE spectrum and line-blanketed non-LTE model atmospheres of the star (Haas et al. 1996; Werner et al. 1998). He also quantified the overabundance of these elements to be 10 and 70 times solar, respectively, and reported the extreme similarity between the IUE spectra of Feige 34 and those of two other hot sdO stars, Feige 67 and LS II$+$18$°$9. Given the nearly identical UV spectra of the three stars, Haas (1997) concluded that their fundamental parameters and their iron and nickel abundances must be essentially the same. More recently, La Palombara et al. (2014) reported the detection of X-ray emission from Feige 34. This emission could be intrinsic to the star, originating from the companion, or possibly both. Valyavin et al. (2006) observed weak polarization in the Hα line of Feige 34, indicating the presence of a weak variable magnetic field ( 10 kG). However, Landstreet et al. (2012) reported that most of the magnetic field detections (via polarimetry) in hot subdwarfs were later on shown to be spurious and no secure detections could be claimed. Additional spectropolarimetric observations of Feige 34 would be needed to clarify the issue.
Feige 67 was included in the sample of sdO stars analysed by Bauer & Husfeld (1995). These authors derived = 75 000 5000 K, log = 5.2 0.2, and log (He)/(H)= 1.27 0.25 based on optical spectroscopy. Using the IUE spectrum, they also measured a nitrogen abundance and upper limits for C and Si. The star was also examined by Becker & Butler (1995a, b, c) during the development of their NLTE nickel and iron model atoms and found these elements to be enriched in the star by at least a factor of 10 with respect to the solar value. Deetjen (2000) further analysed ORFEUS ii and IUE spectra of the star and confirmed the overabundance of iron and nickel.
AGK$+$81$°$266 was first classified as an sdO by Berger & Fringant (1978). This star is a spectrophotometric flux standard for Hubble Space Telescope (HST) and for the Gaia mission (Bohlin et al. 2001; Pancino et al. 2012). Besides good photometric data, there is little other literature on the star itself. We did not find information concerning its fundamental parameters.
LS II$+$18$°$9 is our faintest object (V=12.34) and its effective temperature was first estimated to be 60 000 K by Schönberner & Drilling (1984) based on the UV (IUE) continuum slope. Its IUE spectrum was further analysed by Deleuil & Viton (1992) who did a comparative study of the abundance pattern of LS II$+$18$°$9 and the hot subdwarf component of the CPD71172 binary system. Although their analysis is very detailed, it remained mostly qualitative and no abundances were derived. The authors emphasized the similarity of both stars’ UV spectra.
Since Feige 34, Feige 67, and AGK$+$81$°$266 are among the 46 primary spectrophotometric standard candidates for Gaia (Pancino et al. 2012), all three were observed for photometric variations and validated against short-term variability to a precision level of 4 mmag (Marinoni et al. 2016). In addition, Feige 67 and LS II$+$18$°$9 were observed to detect short-period pulsations, but nothing was detected above 4, corresponding to 0.08% of the mean brightness (Johnson et al. 2014).
3 Observations
3.1 Optical spectroscopy
We collected a variety of low and medium resolution spectra that are most useful to derive atmospheric parameters. The four stars have been observed multiple times by one of us (E.M.G.) as part of her spectroscopic programmes in recent years (Green et al. 2008). A detailed description of the three instrumental set-ups can be found in Latour et al. (2015), hence we only describe the main characteristics of the spectra obtained. For each star we have low ( = 8.7 Å) and medium (1.3 Å) resolution spectra taken at the Steward Observatory 2.3 m Bok Telescope on Kitt Peak. The low resolution set-up (400/mm grating, 2.5″ slit) allows for complete coverage of the Balmer series, from 3620 to 6900 Å, while the medium resolution spectra (832/mm grating, 2nd, 1.5″ slit) cover a bluer wavelength range of 36754520 Å. For Feige 34, we also have spectra taken with the MMT blue spectrograph (832/mm grating, 2nd, 1.0″ slit) covering the 40004950 Å range at a resolution of 1.0 Å with much higher signal-to-noise ratio (S/N) than the Bok spectra.
For each set-up described above, the individual spectra were first cross-correlated against the spectrum with the highest S/N to determine initial values for the relative radial velocities (RVs). Next, the individual velocity-corrected spectra were combined to produce a better high-S/N cross-correlation template, which yielded improved relative RVs. The process was repeated until the RVs for all the individual stars converged, resulting in a final, optimally combined, high sensitivity spectrum (see also Green et al. 2008). Additional details about the derived radial velocities are provided in the Appendix A.
For Feige 34 we also have one additional spectrum taken with the blue arm of the intermediate dispersion spectrograph and imaging system (ISIS) at the William Herschel Telescope333http://www.ing.iac.es/astronomy/instruments/isis/. The R600B grating combined with a 1′′ slit width provided a resolution of 2.0 Å over the 38005250 Å range.
AGK$+$81$°$266 and LS II$+$18$°$9 were observed with the Calar Alto Faint Object Spectrograph (CAFOS) on the 2.2 m telescope at Calar Alto. Spectra were obtained with the blue100 and red100 grisms and the slit width of 100 m provided a resolution of 5.0 Å. The blue and red spectra cover the 36009000 Å range.
All the spectra were reduced and extracted using standard IRAF routines for long-slit spectroscopy.
3.2 UV spectroscopy
| Telescope | Star | Dataset | Exp. Time (s) | Obs. date |
| IUE | Feige 34 | SWP17349 | 7200 | 03/07/1982 |
| SWP20125 | 4200 | 02/06/1983 | ||
| Feige 67 | SWP20488 | 10800 | 20/07/1982 | |
| AGK$+$81$°$266 | SWP17344 | 9000 | 03/07/1982 | |
| LS II$+$18$°$9 | SWP18069 | 13800 | 23/09/1982 | |
| SWP51580 | 15000 | 19/08/1994 | ||
| SWP52064 | 14520 | 08/09/1994 | ||
| FUSE | Feige 34 | M1052201000 | 5590 | 21/03/2003 |
| M1080302000 | 1847 | 03/05/2000 | ||
| P2040701000 | 6307 | 10/02/2001 | ||
| Feige 67 | M1080701000 | 5140 | 29/04/2000 | |
| AGK$+$81$°$266 | M1080501000 | 6864 | 27/11/2000 | |
| M1052103000 | 5087 | 21/01/2003 | ||
| M1052104000 | 6029 | 08/02/2003 | ||
| LS II$+$18$°$9 | P2051501000 | 3525 | 29/05/2004 |
All of our stars have been observed with the short-wavelength prime (SWP) camera in the high-dispersion mode on board the IUE satellite. The spectra cover a wavelength range of 1150 to 2000 Å with a resolution of 0.15 Å. The spectra retrieved from the Barbara A. Mikulski Archive for Space Telescopes (MAST) are listed in Table 1. When multiple observations were available for one star, we combined the spectra and merged the orders using the routines provided in the IUEDAC software libraries.
The stars were also observed by the FUSE satellite, which offers a complementary wavelength range (9051187 Å) to the IUE spectra and a higher resolution ( 0.06 Å). We retrieved the observations available from the archive (see Table 1) that were taken through the LWRS (30 30′′) aperture and recorded in histogram mode. The only exception is LS II$+$18$°$9, which has only a MDRS (4 20′′) observation. Each observation consists of multiple exposures. We used the fully calibrated and extracted spectra provided in the archive for each exposure and detector segment. The different exposures were cross-correlated and co-added for the eight segments. This way we obtained a combined spectrum for each segment. At this stage we did not include individual exposures if they had a discrepant flux level; this could happen, for example, if the target was not well centred in the aperture. The LiF1B spectra show a depression of flux between 1130 Å and 1170 Å, that is more or less important depending on the observation. For this reason, we only kept the region longward of 1170 Å for this segment. Given that there is significant overlap in the wavelength covered by the different segments and that their wavelength calibration can slightly differ, we considered the segments with the best S/N over a given wavelength range to obtain our final FUSE spectra. This way we avoided smearing that would be produced by co-adding more than one segment over a wide wavelength interval. For example, the final co-added FUSE spectrum of Feige 34 was obtained by considering and merging the following spectral regions: SiC1B (910990 Å), LiF1A (9901080 Å), SiC1A (10801089 Å), LiF2A (10891180 Å), and LiF1B (11751187 Å).
4 Atmospheric parameters
We estimated the fundamental parameters ( and log ) and helium abundance by simultaneously fitting the optical H and He lines. We used a minimization procedure that relies on the method of Levenberg-Marquardt (Bergeron et al. 1992). Normalized lines of both the observed and model spectra are thus compared. This is a standard method used to estimate fundamental parameters of hot subdwarfs. In the case of hot sdOs, such as those analysed here, both NLTE effects and line blanketing by heavy elements have to be taken into account to derive reliable temperatures and resolve the Balmer line problem (Bergeron et al. 1993; Werner 1996). Latour et al. (2015) showed that stellar atmosphere models with enhanced individual metal abundances (10 times solar) are required to solve the Balmer line problem observed in the hot sdO star BD$+$28$°$4211. The increased abundances compensate for missing opacities in the models.
For this work we used similar NLTE line-blanketed model atmospheres computed with the public codes TLUSTY and SYNSPEC (Lanz & Hubeny 1995, 2003). We computed a model grid covering the following parameter range: 50 000 K 68 000 K by 2000 K steps, 4.8 log 6.4 by 0.2 dex steps, and 4.0 log (He)/(H) 0.0 by 0.5 dex steps. The models include line blanketing from the following elements: H, He, C, N, O, Mg, Si, S, Fe, and Ni.
| Star | Spectrum | (K) | log | log (He)/(H) |
|---|---|---|---|---|
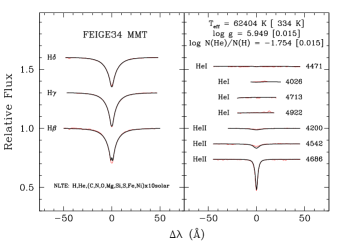
| Feige 34 | MMT 1.0Å | 62 400 330 | 5.949 0.015 | 1.754 0.015 |
| BOK 1.3Å | 62 317 300 | 6.032 0.012 | 1.8a𝑎aa𝑎aBecause of the absence of visible He lines in the Bok 1.3Å spectral range, the abundance was kept fixed. | |
| ISIS 2.0Å | 61 974 304 | 5.980 0.013 | 1.765 0.021 | |
| BOK 8.7Å | 63 510 820 | 5.984 0.035 | 1.842 0.039 | |
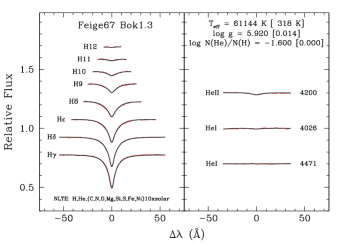
| Feige 67 | BOK 1.3Å | 61 114 318 | 5.920 0.014 | 1.6a𝑎aa𝑎aBecause of the absence of visible He lines in the Bok 1.3Å spectral range, the abundance was kept fixed. |
| BOK 8.7Å | 61 000 723 | 5.981 0.041 | 1.594 0.038 | |
| AGK$+$81$°$266 | BOK 1.3Å | 62 590 538 | 6.067 0.021 | 2.9a𝑎aa𝑎aBecause of the absence of visible He lines in the Bok 1.3Å spectral range, the abundance was kept fixed. |
| CAFOS 5.5Å | 60 859 1182 | 6.093 0.063 | 2.986 0.200 | |
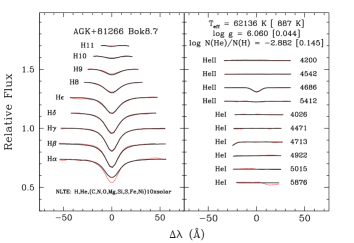
| BOK 8.7Å | 62 136 900 | 6.060 0.044 | 2.882 0.140 | |
| LS II$+$18$°$9 | BOK 1.3Å | 61 390 350 | 5.992 0.015 | 1.9a𝑎aa𝑎aBecause of the absence of visible He lines in the Bok 1.3Å spectral range, the abundance was kept fixed. |
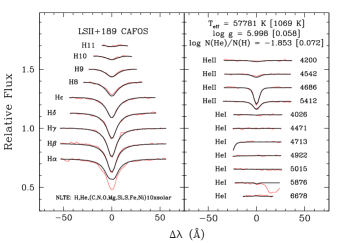
| CAFOS 5.5Å | 57 767 1067 | 5.996 0.058 | 1.851 0.071 | |
| BOK 8.7Å | 60 884 996 | 6.024 0.056 | 1.890 0.056 |
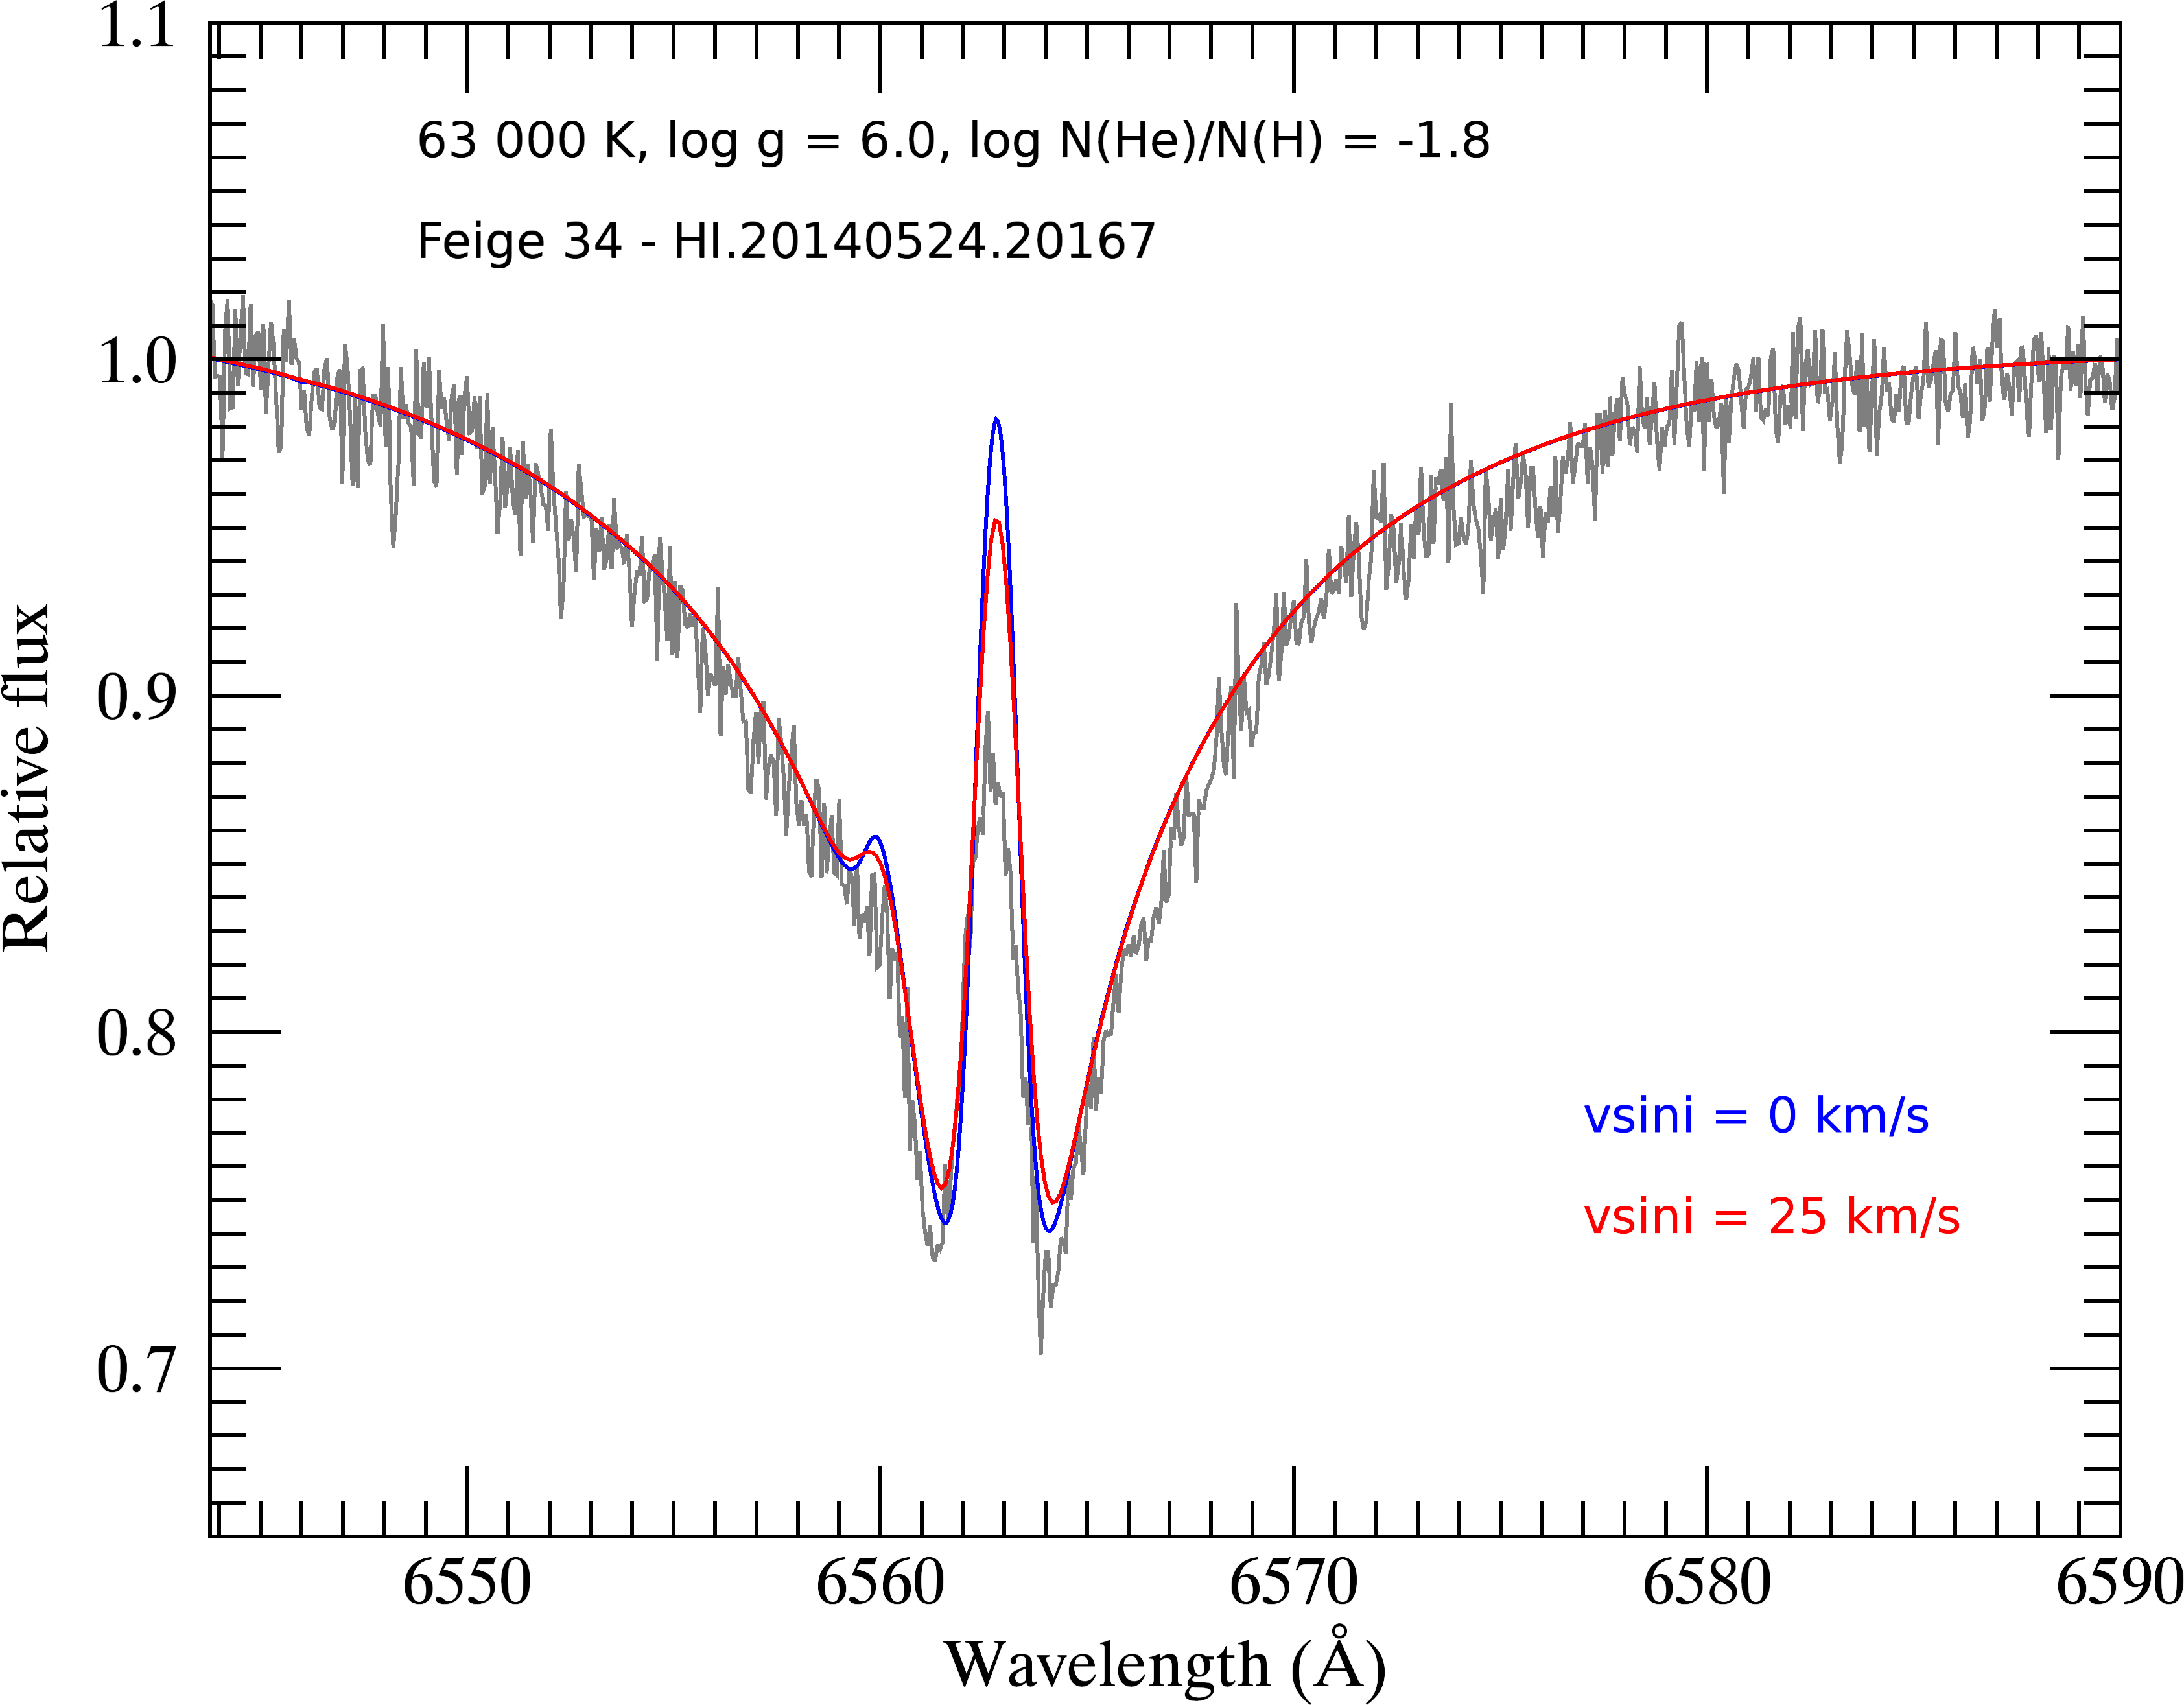
Fig. 1 shows examples of our best fits to the Balmer and helium lines and Table 2 summarizes our results. The uncertainties are statistical and mostly reflect the S/N of the spectra. For instance, our CAFOS lower S/N spectra fits resulted in higher uncertainties. An additional source of uncertainties can arise from various resolutions and wavelength coverage of the fitted spectra. However, the parameters we determined from the different spectra are remarkably consistent. The four spectra of Feige 34 give temperature values consistent within 1600 K.
Our results confirm Haas’ 1997 analysis that Feige 34, Feige 67, and LS II$+$18$°$9 have very similar atmospheric parameters. The helium abundances are also similar and vary by less than 0.3 dex. To this group of stars we now add AGK$+$81$°$266, which shares equally comparable and log . As yet, the star only differs by its helium abundance, which is about 10 times lower.
The optical spectral lines are well reproduced by our best fitting models with the exception of the cores of the lowest Balmer lines, i.e. H and H. At such high temperatures the cores of these lines turn into emission, but the low resolution of our spectra smears out these features. To inspect the observed line profiles we retrieved some HIRES spectra of Feige 34 from the Keck Observatory Archive555http://www2.keck.hawaii.edu/koa/public/koa.php. A comparison between our models and the high resolution observations showed that the models predict NLTE emission cores to be stronger than the observed cores (see Fig. 9). At lower resolution, the smearing out of the emission features leads to shallower line profiles, thus explaining the discrepancies observed in our fits for H and H.
The parameters we derived for our stars are in good agreement with the values stated in the literature. The temperatures match well that derived by Haas (1997) and our surface gravities are between the value (log = 5.2) determined by Bauer & Husfeld (1995) for Feige 67 and the higher value (log = 6.8) estimated by Thejll et al. (1995) for Feige 34.
5 Abundance analysis
5.1 Rotational broadening
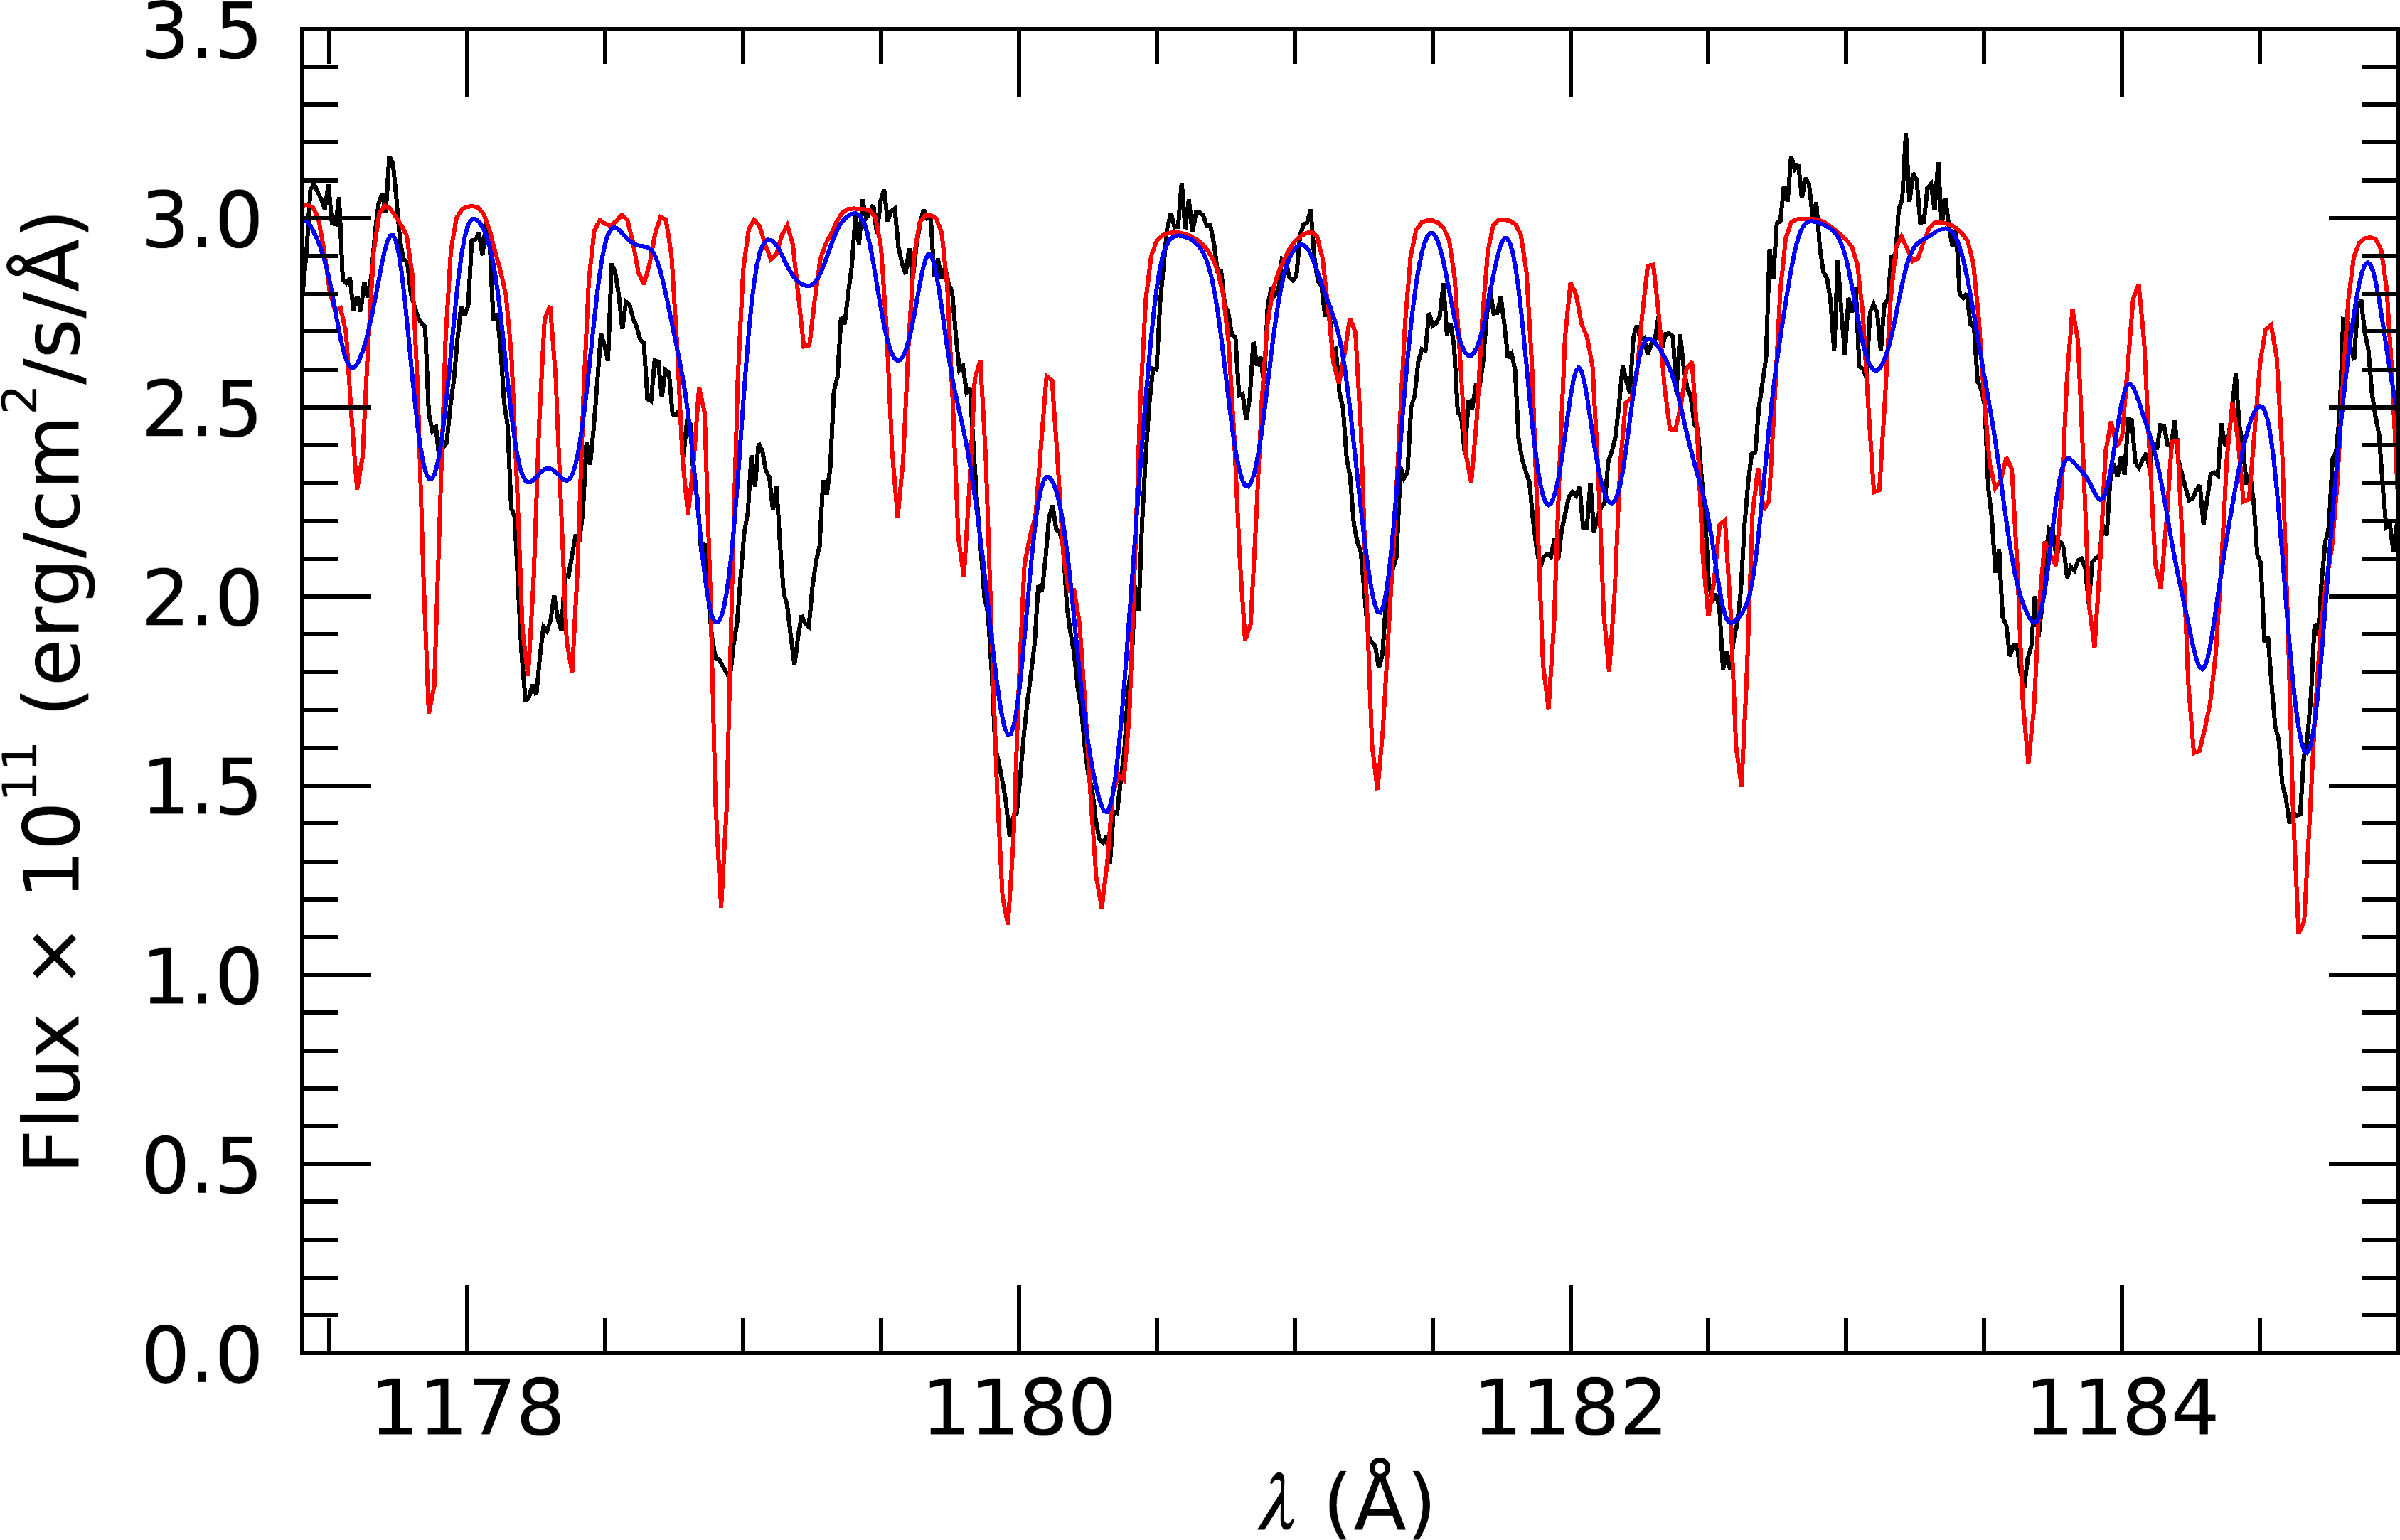
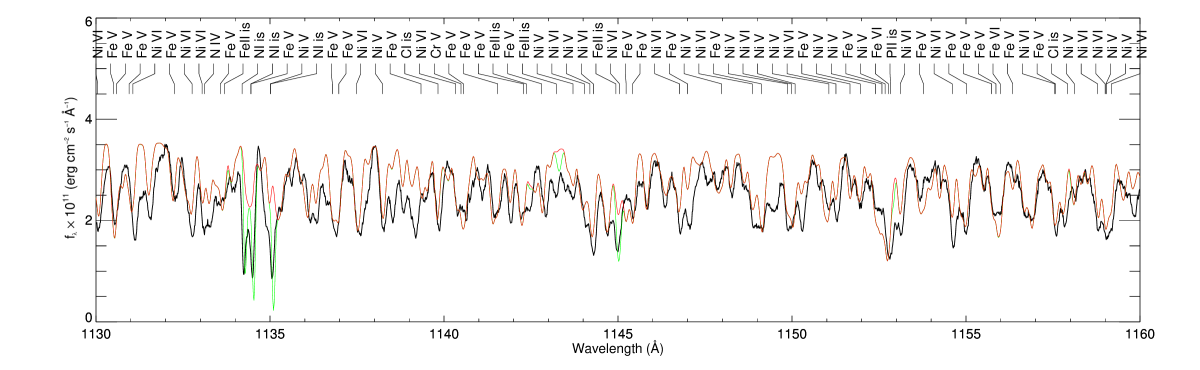
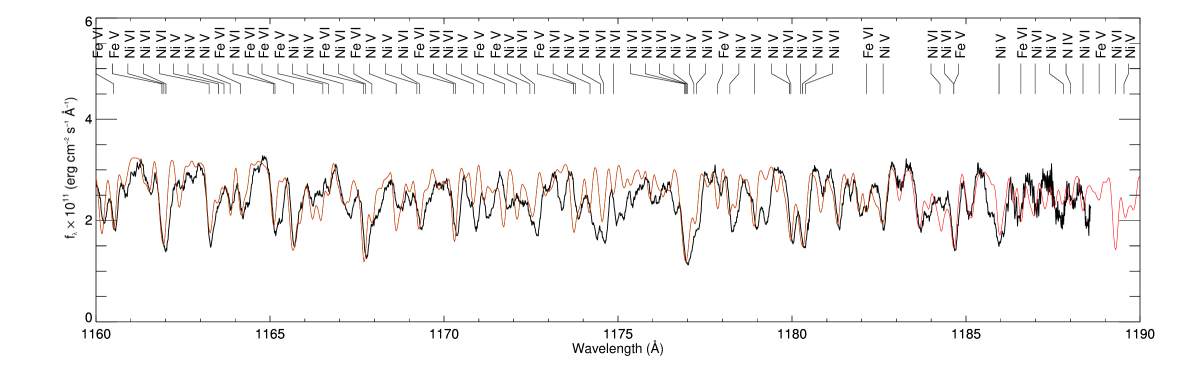
A comparison of the Feige 34 FUSE spectrum with model spectra readily provided indications of line broadening; the modelled lines had systematically sharper cores than the observed lines. Because the metal lines in the FUSE spectrum are heavily blended, it is not straightforward to use well-defined and isolated lines for measuring the rotational broadening. Instead we selected a wavelength range (11651185 Å) for which most of the observed lines were present in our models. This range is covered by two of the FUSE segments (LiF2A and LiF2B) and the IUE spectrum and is mostly dominated by Ni VVI lines. We performed a fit of this region using a model grid in which the nickel abundance and rotation velocity were varied666The synthetic spectra are convolved with a Gaussian to match the FUSE (0.06 Å) and IUE (0.15Å) instrumental resolution., and we obtained sin values between 25 and 30 km s-1 for the different spectra. We repeated the fitting exercise for the three other stars, which also show signs of additional broadening. Consistent with the remarkably similar nature of the FUSE spectra of our stars, we obtained values of sin between 20 and 35 km s-1 for all four stars and their different spectra (FUSE and IUE). Figure 2 shows part of the fitted range for the LiF1B segment of Feige 34 along with synthetic spectra that have sin = 25 km s-1 and no rotational broadening.
Rotational broadening has not been reported in most of the previous work on these stars. However the work of Deleuil & Viton (1992) reported the presence of line broadening in LS II$+$18$°$9 and CPD71172B. These authors were able to distinguish the effect with the Fourier filtering technique they applied to the IUE data to optimally remove the noise. They concluded that it could be explained either by stellar rotation or a high microturbulence. Becker & Butler (1995a) also mentioned the presence of rotational broadening in the IUE spectrum of Feige 67.
To explore the possibility of microturbulence, we fit four nickel lines that are observed in the FUSE and IUE spectra of Feige 34. These lines– the Ni VI lines at 1179.920, 1179.966, 1180.300, and 1180.388 Å–are not blended with any other metal lines. Although the transitions start from energy levels above 300,000 cm-1, they have strong oscillator strengths that range from log gf = 0.033 to 0.467. The best fit between the observed data and model was determined by considering the microturbulent velocity () and the nickel abundance as free parameters. The microturbulent velocity is only considered in the calculations of the synthetic spectra (SYNSPEC), while the nickel abundance is considered explicitly in the calculations of the stellar atmosphere models (TLUSTY). A grid of synthetic spectra was computed by considering microturbulent velocities in the range of 0 22 km s-1, in steps of 2 km s-1, and nickel abundances in the range of , in steps of 0.3 dex. The microturbulent velocity is assumed constant throughout the atmosphere. We estimated that if we considered the microturbulence as an additional broadening in SYNSPEC only, we could overestimate the nickel abundance by 0.2 dex and underestimate the microturbulent velocity by 1.1 km s-1.
The best fit of the FUSE and IUE data gives = 18 2 km s-1 and log (Ni)/(H) = 4.7 0.1. The uncertainties are given by the standard deviation of the measurements. The lower nickel abundance is explained by the fact that the nickel lines are saturated and because the effect of the microturbulence widens the wavelength range covered by the absorption lines and reduces the saturation. A lower nickel abundance is then needed to reproduce the lines. Given that the microturbulent velocity that we measured for Feige 34 is very high and implausible for such a compact star, we favour the rotational broadening option. For our abundance analysis, we adopted a value of sin = 25 km s-1 for all the stars and have not included any microturbulent velocity.
5.2 Chemical composition
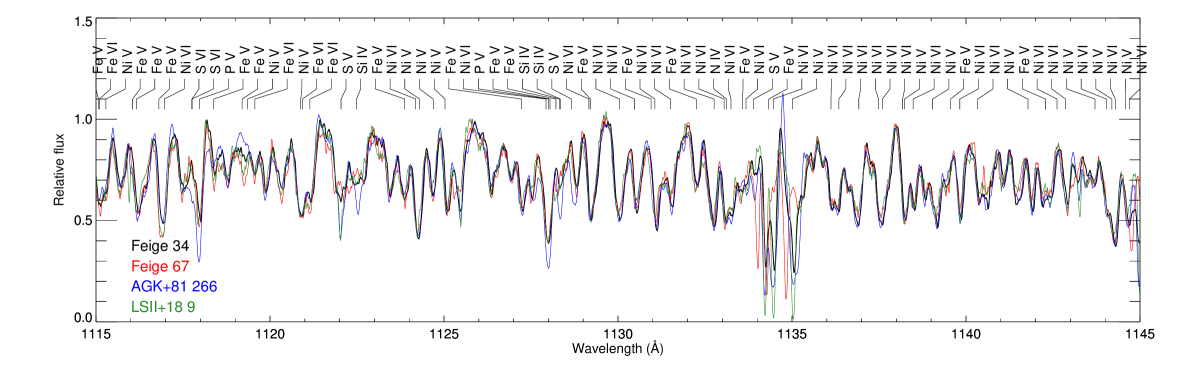
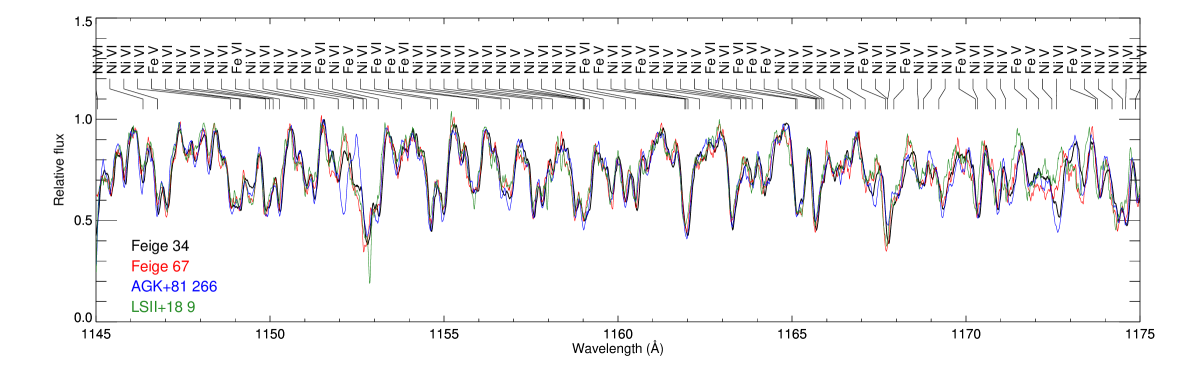
The UV spectral range is dominated by many strong iron and nickel (mostly v and vi) lines. As outlined by Haas (1997), the IUE spectra of Feige 34, Feige 67, and LS II$+$18$°$9 are extremely similar, as is the spectrum of AGK$+$81$°$266, which shows the same strong features of iron and nickel. The resemblance is even more striking when comparing the FUSE spectra of our stars with their better resolution and S/N, many features clearly appear to be identical in all the stars.
While absorption from iron and nickel dominates the spectra of our stars, the absorption lines from lighter elements such as carbon, oxygen, and nitrogen are much more discreet, suggesting that these lighter elements are depleted. It is with respect to these lighter elements that AGK$+$81$°$266 stands out from the other stars, showing a somewhat different pattern. For example, it has weaker lines of oxygen and nitrogen, while silicon, phosphorus, and sulfur show stronger features. This is illustrated in Fig. 3, where we overplotted the FUSE spectra of our four stars over the 11151175 Å range. The spectral similarity between the stars is very obvious as are the differences in the P v ( 1118, 1128), S ( 1117.7 1128.7,1133.9), and Si iv 1128.3 lines in AGK$+$81$°$266. The three strong absorption features around 1135 Å are N i interstellar (IS) lines, and the spectra of AGK$+$81$°$266 and LS II$+$18$°$9 additionally show prominent Fe ii IS absorption at 1122 and 1145 Å. The FUSE range at shorter wavelength contains a fair amount of interstellar transitions, originating mostly from molecular H2, H i, and neutral and singly ionized atoms such as C, N, O, Ar, and Si. Our stars are affected differently by interstellar contamination, H2 seems to be almost absent from the line of sight of Feige 67, while it shows strong features in LS II$+$18$°$9, which also has stronger IS H I absorption. Similarly, the interstellar Ca i 3933 line in the Bok spectra is undetectable in Feige 67, extremely weak in Feige 34, and rather strong in AGK$+$81$°$266 and LS II$+$18$°$9.
For the abundance analysis we used a common set of parameters determined from the optical analysis (62 000 K, log = 6.0) to build our model grids. The helium abundances were fixed to log (He)/(H) = 1.8 for Feige 34, Feige 67, and LS II$+$18$°$9, and log (He)/(H) =2.9 was used for AGK$+$81$°$266. We built grids where one metallic element was varied at a time. The models computed included C, N, O, Si, S, Fe, and Ni, with abundances previously derived or estimated from preliminary analysis. Since iron and nickel are the main contributors to the opacity, both in terms of emergent spectra and atmospheric structure, their abundances were evaluated first, followed by the lighter metals. The resulting abundances, radial velocities, and averaged atmospheric parameters for the four stars are presented in Table 3. The individual elements are discussed below.
| Feige 34 | Feige 67 | AGK$+$81$°$266 | LS II$+$18$°$9 | Haas (1997)a𝑎aa𝑎aFor Feige 34, Feige 67, and LS II$+$18$°$9, parameters such as log and abundances of He, C, and N were kept fixed to the values derived by Bauer & Husfeld (1995) for Feige 67. | Bauer & Husfeld (1995)b𝑏bb𝑏bFor Feige 67. | ||
| c𝑐cc𝑐cOur results are the averaged values of the different fits presented in Table 2. (K) | 62 550 600 | 61 050 520 | 61 860 870 | 60 010 800 | 60 000 4000 | 75 000 5000 | |
| log c𝑐cc𝑐cOur results are the averaged values of the different fits presented in Table 2. (cm s-2) | 5.99 0.03 | 5.95 0.03 | 6.07 0.04 | 6.00 0.06 | … | 5.2 0.2 | |
| RVd𝑑dd𝑑dDerived from the optical spectra. (km s-1) | 11.0 7.7 | 27.0 7.8 | 27.8 7.8 | 49.5 12.3 | … | … | |
| Element | Abundance (log (X)/(H)) | Solare𝑒ee𝑒eAsplund et al. (2009). | |||||
| Hed𝑑dd𝑑dDerived from the optical spectra. | 1.79 0.04 | 1.59 0.04 | 2.9 0.2 | 1.87 0.07 | … | 1.27 0.25 | 1.07 |
| C | 6.7 | 8.0 | 6.7 | 6.7 | … | 4.50 | 3.56 |
| N | 4.9 0.3 | 4.9 0.3 | 6.0 0.3 | 4.9 0.3 | … | 4.85 0.5 | 4.17 |
| O | 5.5 0.5 | 5.5 0.5 | 6.4 | 5.5 0.5 | … | … | 3.31 |
| Mg | 5.0 | 5.0 | 5.0 | 5.0 | … | … | 4.40 |
| Si | 6.2 0.3 | 6.2 | 5.0 0.3 | 6.2 0.3 | … | 5.5 | 4.49 |
| P | 6.7 0.5 | 6.7 0.5 | 5.5 0.5 | 6.7 0.5 | … | … | 6.59 |
| S | 5.6 0.3 | 5.6 0.3 | 5.3 0.3 | 5.6 0.3 | … | … | 4.86 |
| Cr | 5.3 | 5.3 | 5.3 | 5.3 | … | … | 6.36 |
| Mn | 5.6 | 5.6 | 5.3 | 5.6 | … | … | 6.57 |
| Fe | 3.1 0.3 | 3.1 0.3 | 3.1 0.3 | 3.1 0.3 | 3.5 | … | 4.50 |
| Co | 5.8 | 5.8 | 5.8 | 5.8 | … | … | 7.01 |
| Ni | 4.0 0.3 | 4.0 0.3 | 4.0 0.3 | 4.0 0.3 | 3.9 | … | 5.77 |
Carbon
The only visible carbon lines are the resonance C iv doublet in the IUE spectrum. However these transitions are also common in the interstellar medium and since none of our stars have a high radial velocity, we do not resolve possible blending of photospheric and IS components. In Feige 34 and Feige 67 the lines are shifted with respect to the other stellar features, while they are found at a position consistent with a stellar origin for AGK$+$81$°$266 and LS II$+$18$°$9. Therefore we only estimated upper limits for the carbon abundance. These upper limits do not produce carbon features in the FUSE range and no features are seen in the observed spectra either.
Nitrogen
The IUE spectrum features the N v doublet (1238.8, 1242.8) and the N iv (1718) line while four components of the N iv multiplet around 922924 Å and N iv 955 can be distinguished in the FUSE spectrum. The N iii 991 seems to be present only in Feige 67. None of our stars display P Cygni profile characteristics in their N v doublet, which would indicate the presence of a stellar wind. A comparison between our model spectrum and the IUE spectrum of Feige 34 around the N v doublet range can be seen in Fig. 4. The strongest lines are indicated at the top, along with their estimated equivalent width as approximated by SYNSPEC. Since most of the absorption features are blends, the equivalent width of the individual lines gives an indication of their relative strength.
Oxygen
The oxygen features are relatively weak given the low abundance of this element and most of these features are blended with Fe and Ni lines. The O v 1371Å line is severely blended with two especially strong Fe vi lines (see Fig. 5) while the O iv lines ( 1338, 1342, 1343) in the IUE range are not particularly strong in our best IUE spectrum (Feige 34). The O vi doublet (1031.9, 1037.6) is present in the FUSE range, but is blended with the Fe v 1031.9 and 1032.0 lines and the Ni vi 1037.6 line. The oxygen features in AGK$+$81$°$266 are even weaker and suggest that the Fe vi lines in the 1370 Å complex are likely too strong in our models, as the absorption remains too strong even after the contribution from O v 1371 disappears. For this reason our abundances of oxygen have a higher error, and we stated only an upper limit in the case of AGK$+$81$°$266.
Magnesium
The absence of Mg iii and iv features in the IUE spectrum suggests an upper limit of log (Mg)/(H) 5.0.
Silicon
All the silicon features are relatively weak. In Feige 34, the Si iv doublet (1394, 1403 Å) appears to be redshifted with respect to the photospheric lines (see Fig. 5). Like the C iv doublet, this feature appears to be dominated by an IS component. The Si iv 1128 is visible in AGK$+$81$°$266, but rather weak in the other stars.
Phosphorus
The resonance doublet of P v ( 1118, 1128) is the only visible feature of phosphorus and is clearly stronger in AGK$+$81$°$266. The observed and modelled relative strength of both components do not match perfectly. This could be explained by the 1128 line being blended with a strong Ni vi line.
Sulfur
The S vi resonance doublet is prominent in the FUSE spectrum while the other expected sulfur lines (S vi 1117.7 and S v 1122.0, 1128.6, 1133.9) are absent or weak. In the spectra of AGK$+$81$°$266 and LS II$+$18$°$9 the S v 1122.0 is blended with an IS line of Fe ii.
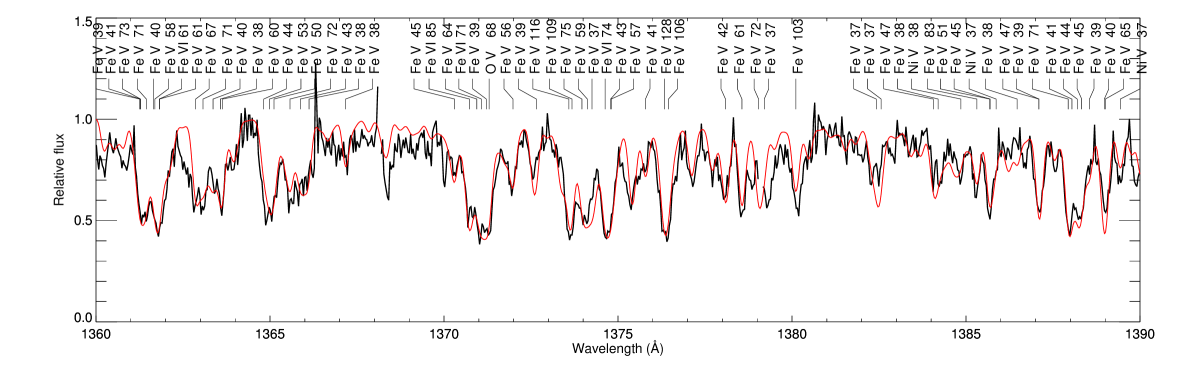
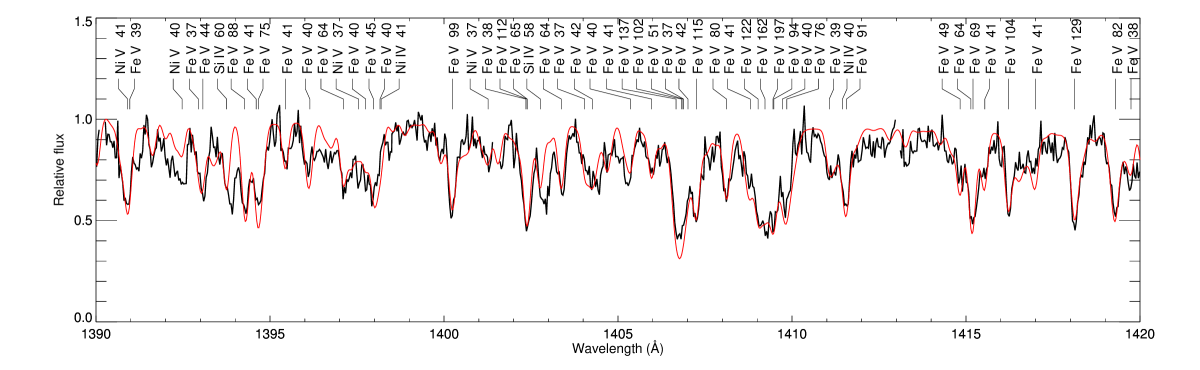
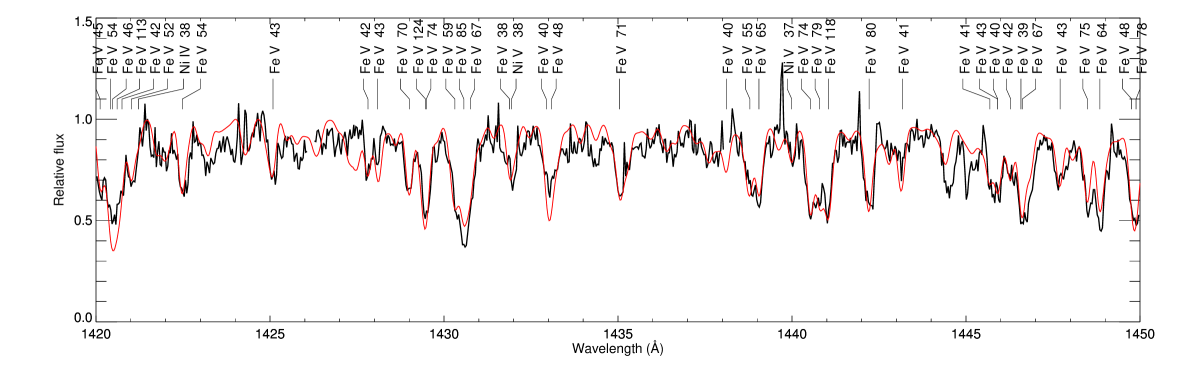
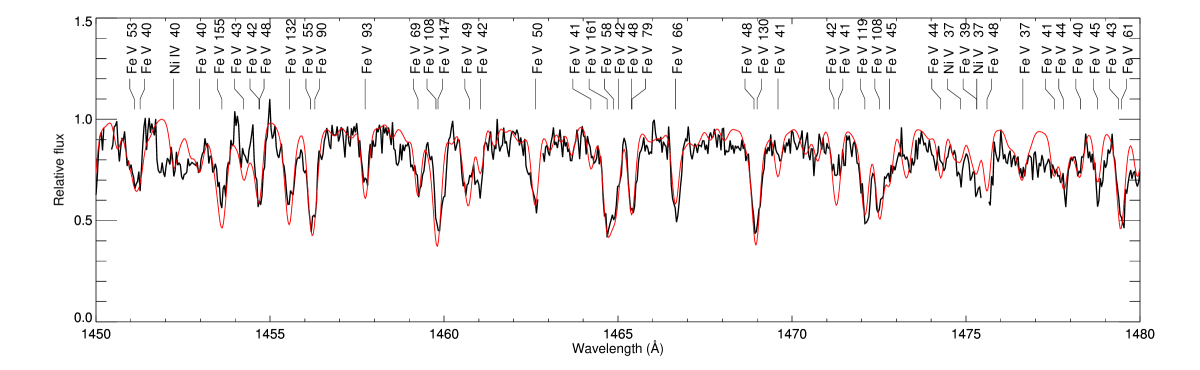
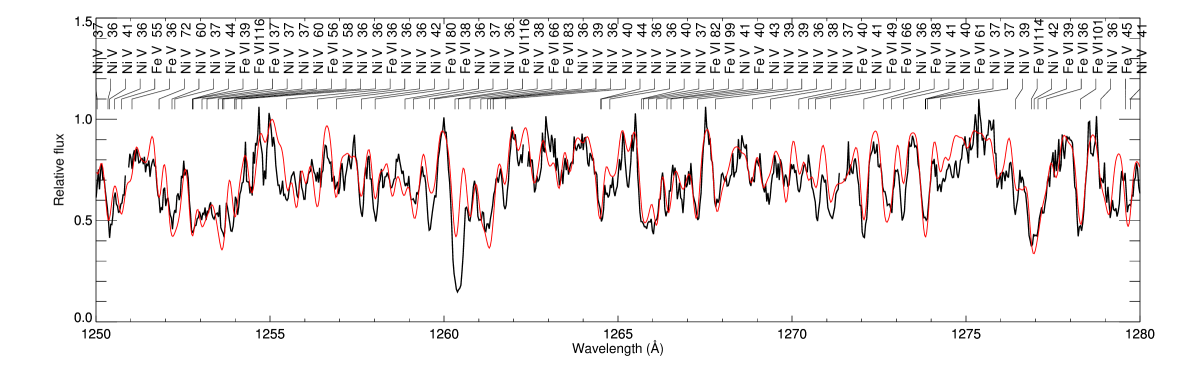
Iron
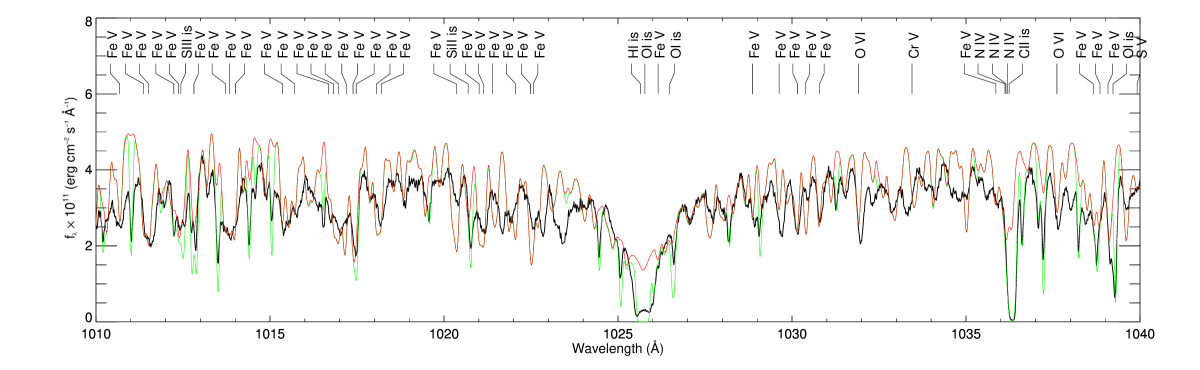
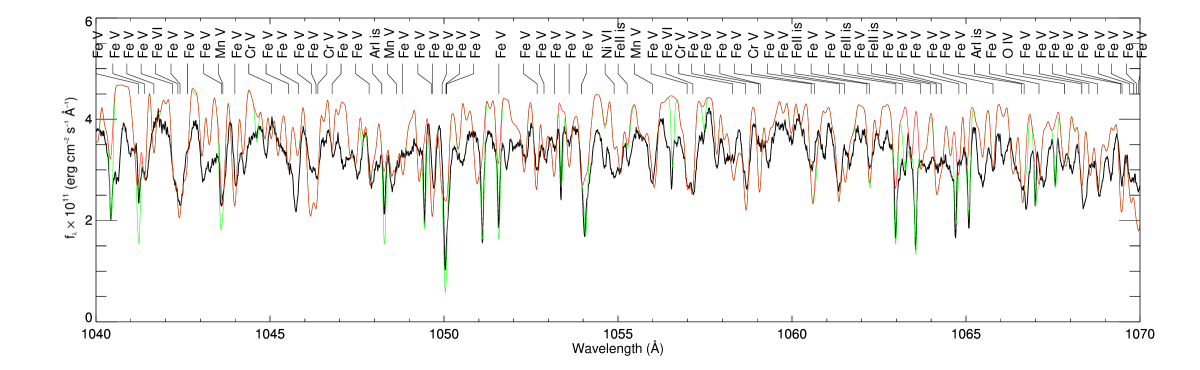
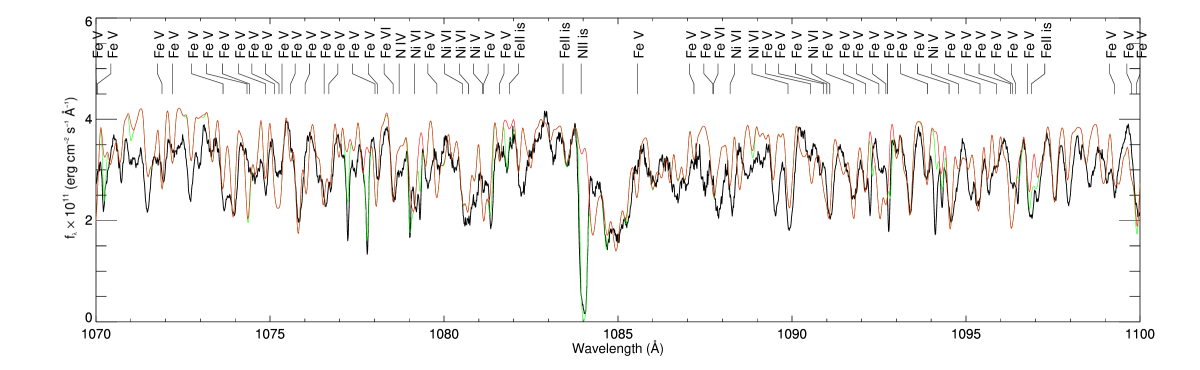
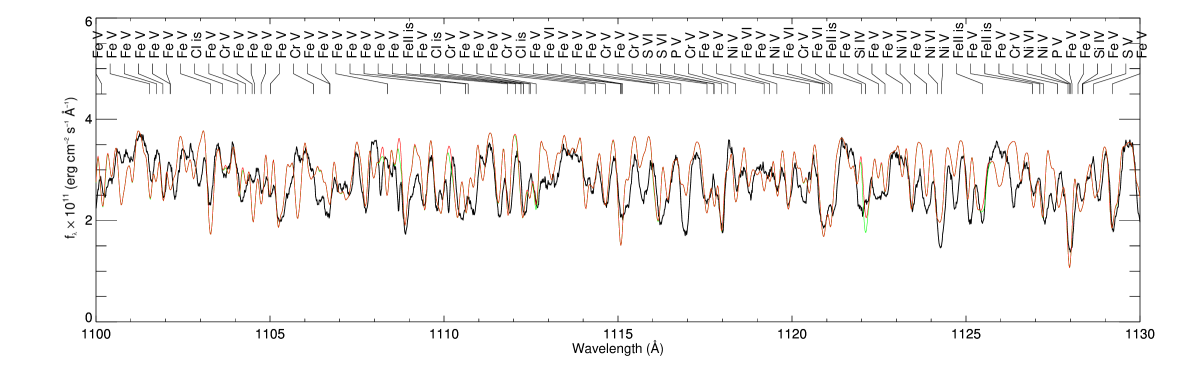
The iron abundance was determined by fitting the spectral region between 1360 and 1480 Å, which is mostly dominated by strong Fe v lines. Fig. 5 shows a comparison between the spectrum of Feige 34 and our best model for this spectral region. The figure shows a very good agreement between the observed and synthetic spectra. The synthetic spectrum was calculated using the latest line compilation888http://kurucz.harvard.edu/linelists, dated Dec. 2016, including lines computed only between known levels, thus with good wavelengths. by Kurucz, which provides a much larger number of lines than in the previous compilation (Kurucz & Bell 1995). For instance, the number of Fe v lines went from 1336 to 5580 lines between 900 and 2000 Å. Although the addition of these new iron lines has little effect on the match between the model and the IUE spectrum, it significantly improves the model in the FUSE spectral range, especially for Å (see Fig. 10). Some of the new lines appear stronger in the model than in the observations, however.
Nickel
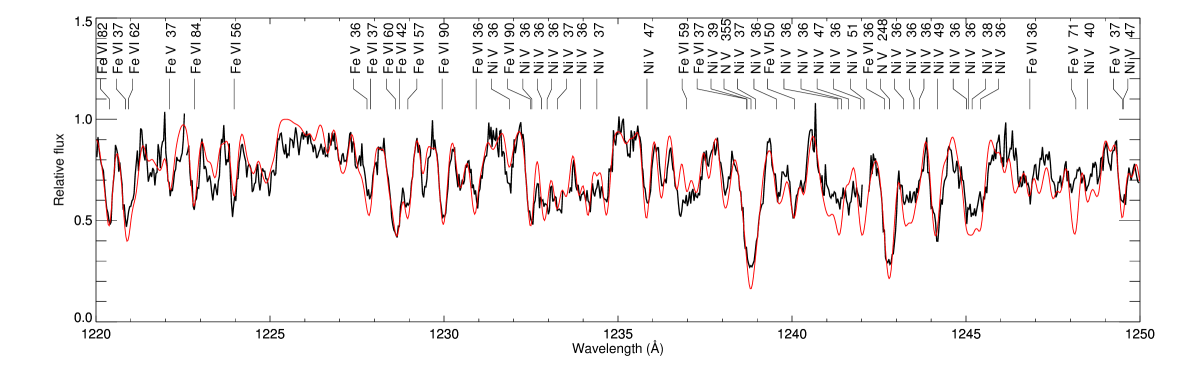
The majority of nickel lines are found at wavelengths shorter than 1320 Å. We selected the FUSE and IUE ranges 1165-1185 Å and 1220-1265 Å to determine the nickel abundance. Fig. 4 compares our best model of Feige 34 to its IUE portion. The figure not only shows many Ni v lines, but also several Fe vi lines.
Chromium, manganese, and cobalt
We looked for these elements in the FUSE and IUE spectra, but did not unambiguously detect lines. We measured abundance upper limits by comparing the strongest predicted and isolated lines to the observed spectra. Because of the lack of model atoms, we computed the energy level populations based on a LTE approximation, but used the resulting physical structure provided by our final NLTE model atmosphere.
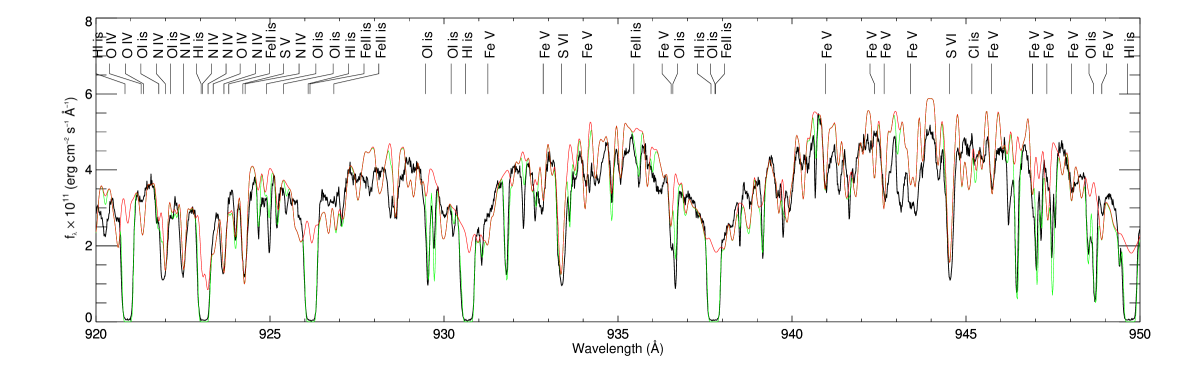
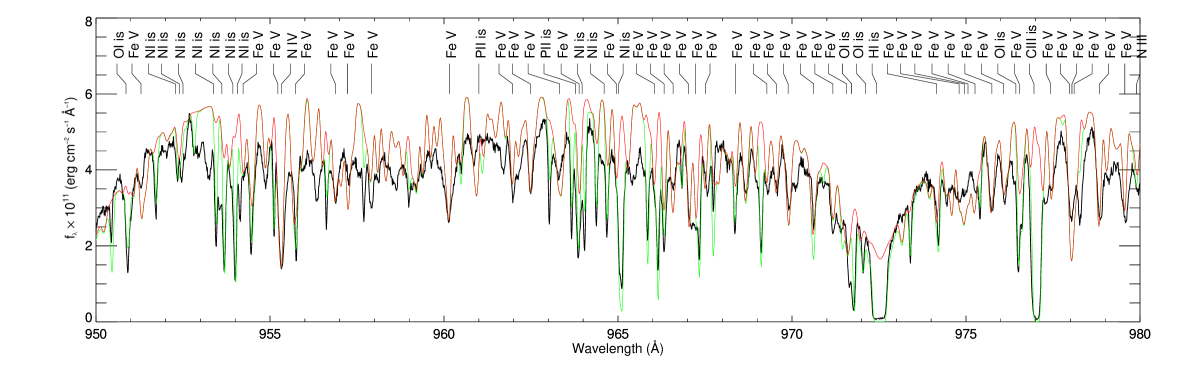
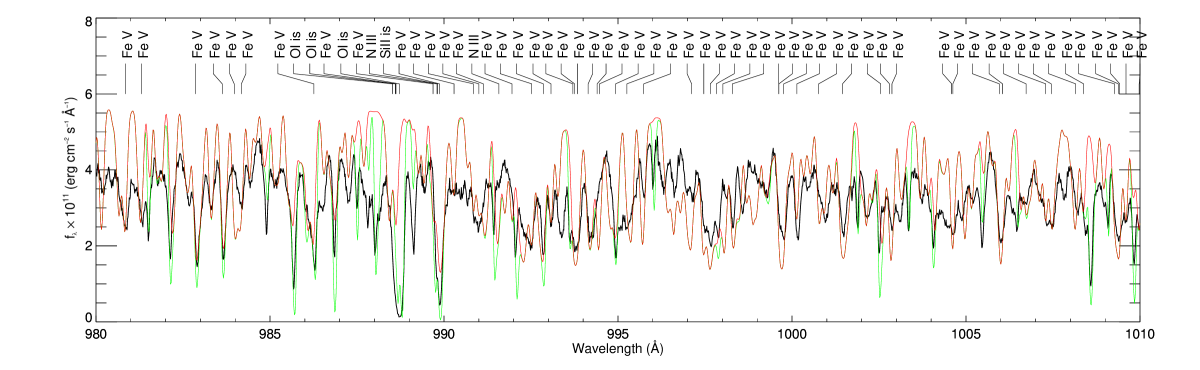
A comparison between the FUSE spectrum of Feige 34 and a synthetic one using the latest line list by Kurucz is presented in Fig. 10. The synthetic model includes the abundances listed in Table 3 and Cr, Mn, and Co at their upper limits. To identify IS absorption features in the FUSE range we used the OWENS programme developed by the FUSE French team (Hébrard & Moos 2003). The programme allows the user to model the IS absorption produced by different clouds of IS material with distinct radial and turbulent velocities, temperature, and column density of various elements. The resulting IS lines are indicated in green.
6 Spectral energy distributions and distances
| Feige 34 | Feige 67 | AGK$+$81$°$266 | LS II$+$18$°$9 | |
| 0.018 0.007 | 0.031 0.004 | 0.023 0.003 | 0.060 0.005 | |
| () | 2.01 0.03 | 1.533 0.008 | 1.423 0.006 | 1.39 0.01 |
| Dspectro (pc) | 257 36 | 337 44 | 335 44 | 371 50 |
| DHipparcos (pc)a𝑎aa𝑎afrom van Leeuwen (2007) | 323 | 273 | 265 | … |
| comp (K) | 3848 | … | … | … |
| log comp | 5.4 | … | … | … |
| Surface ratio | 23.5 2.0 | … | … | … |
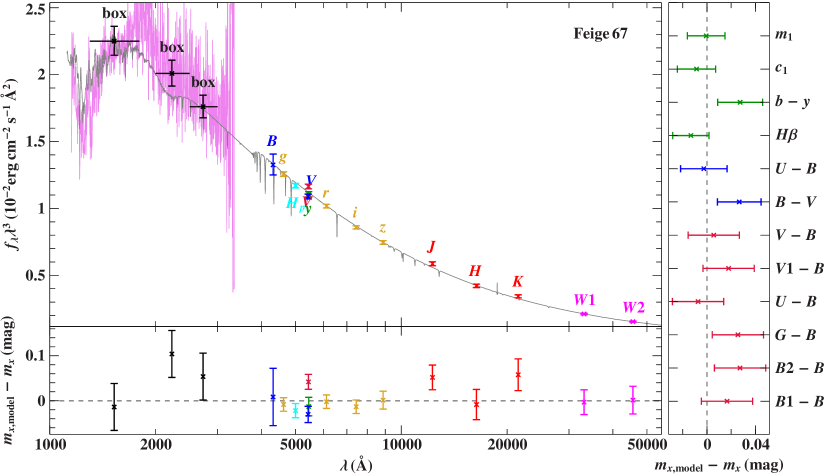
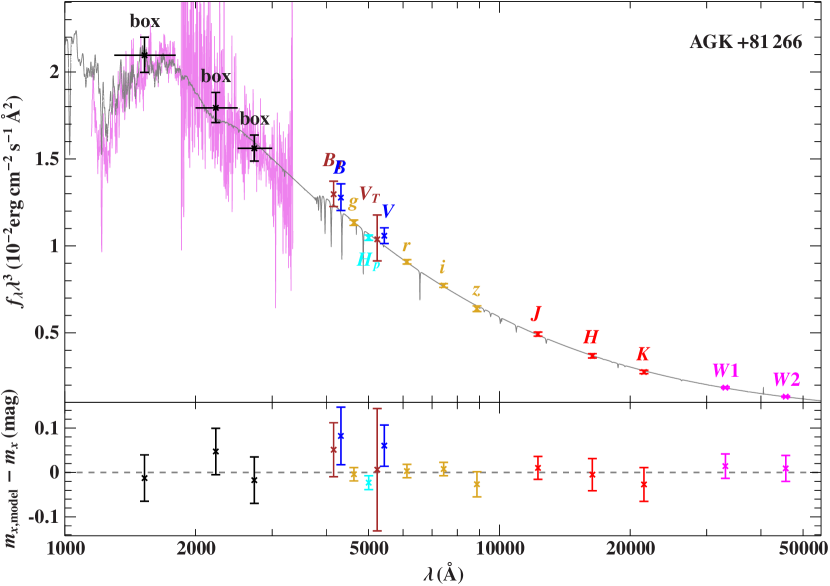
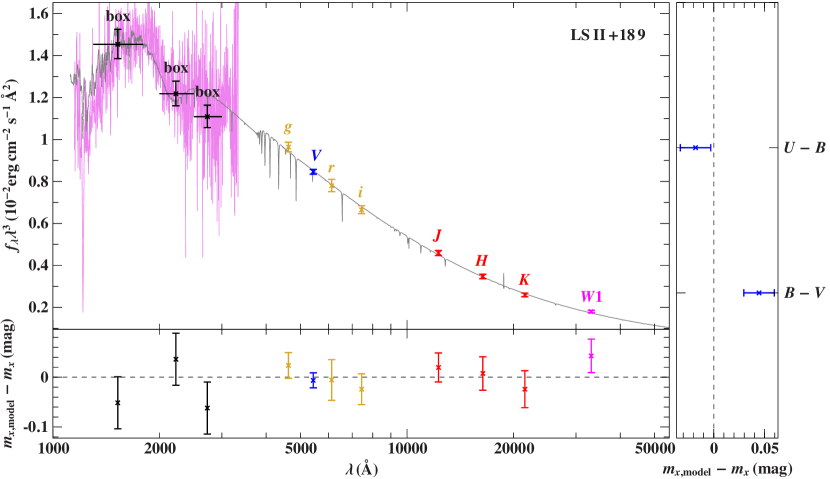
We collected photometry data from a variety of sources to construct the SED of our four stars ranging from the UV range up to the infrared ( 4.6 m). The photometric systems and catalogues used are listed in Table 8. The UV range is represented by low resolution, large aperture, flux calibrated IUE spectra that were used to create three artificial magnitudes of 13001800 Å, 20002500 Å, and 25003000 Å via box filters. The IUE spectra with the longest exposure time for each star were retrieved from the MAST archive to create these UV magnitudes. To model the reddening we assumed a standard value of the extinction parameter ( = 3.1) and used the Fitzpatrick (1999) extinction law. Our best synthetic spectra were used to compute synthetic magnitudes.
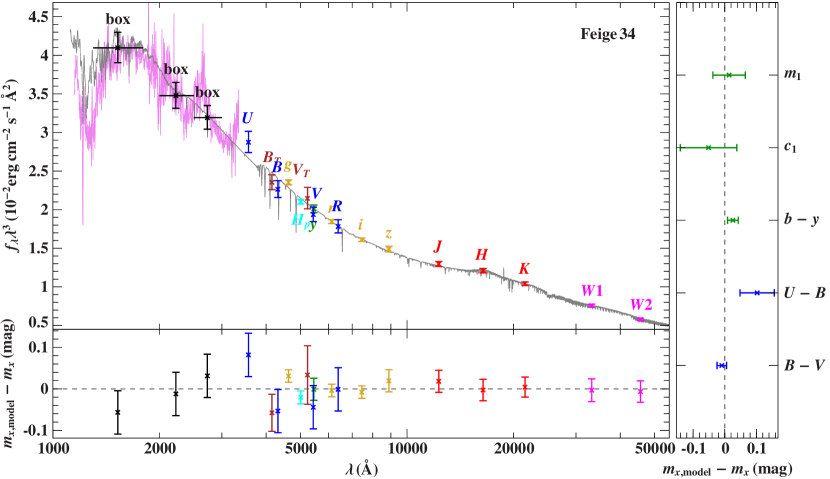
The fitting procedure aims at achieving the best match between synthetic and observed magnitudes and colours by minimization. For a single star fit, the angular diameter ( = 2R/D) and colour excess were the two free parameters. The resulting best fit for Feige 34 is presented in Fig. 6 and the corresponding parameters for all stars are listed in Table 4, along with the spectroscopic and Hipparcos distances. The SEDs of Feige 67, AGK$+$81$°$266, and LS II$+$18$°$9 are presented in Fig. 11. They are well reproduced by our sdO models and do not show evidence of a companion. According to our radial velocity measurements, the stars also do not show any large RV variations; see Appendix A and Table 6 and 7.
The situation is different for Feige 34, which requires a companion to reproduce the infrared excess. In this case, we used the library of PHOENIX (Hauschildt & Baron 1999; Hauschildt et al. 1999) synthetic spectra computed by Husser et al. (2013) to model the photometry of the cool companion. The SED of the composite spectra requires three additional parameters to be fitted; i.e. the and log of the companion, and the surface ratio of both stars (). Our best fit indicates 3850 K for the companion, corresponding to a M0 spectral type. This is in good agreement with Mullally et al. (2007) who found the infrared excess of Feige 34 to be well reproduced by a stellar model at 3750 K. They used photometry from the IRAC camera on the Spitzer Space Telescope combined with 2MASS and optical magnitudes to search for infrared excess in a sample of white dwarfs.101010Because it is part of the McCook & Sion (1987) white dwarf catalogue, the star is at times included in surveys targeting bright white dwarfs.
Using the angular diameter provided by the SED fitting we computed spectroscopic distances. The errors on Dspectro provided in Table 4 consider the uncertainties reported on , the assumption of a canonical mass of 0.47 0.01 and uncertainties of 0.1 dex on the surface gravities. The errors provided must be seen as lower bounds, given that other sources of errors, such as uncertainties on , the reddening, and larger deviations from the canonical mass, are likely to contribute. Our spectroscopic distances are in agreement with the Hipparcos measurements within their (rather large) uncertainties. For Feige 67 and AGK$+$81$°$266, our Dspectro is nevertheless larger than DHipparcos, while for Feige 34 we have the opposite situation. According to Hipparcos, it should be the farthest star in our sample, but the closest star according to the spectroscopic distance. Most certainly Gaia will soon provide more accurate parallaxes for the three standard stars and for LS II$+$18$°$9.
There have also been distance discrepancies reported in previous analyses of other hot sdOs (Feige 110, BD75325, and BD$+$28$°$4211; Rauch et al. 2014; Lanz et al. 1997; Latour et al. 2015) and a DAO-type white dwarf (LSV4621; Rauch et al. 2007). In these four cases, the spectroscopic distances derived were significantly larger than the Hipparcos values.
7 Discussion
7.1 Evolutionary status
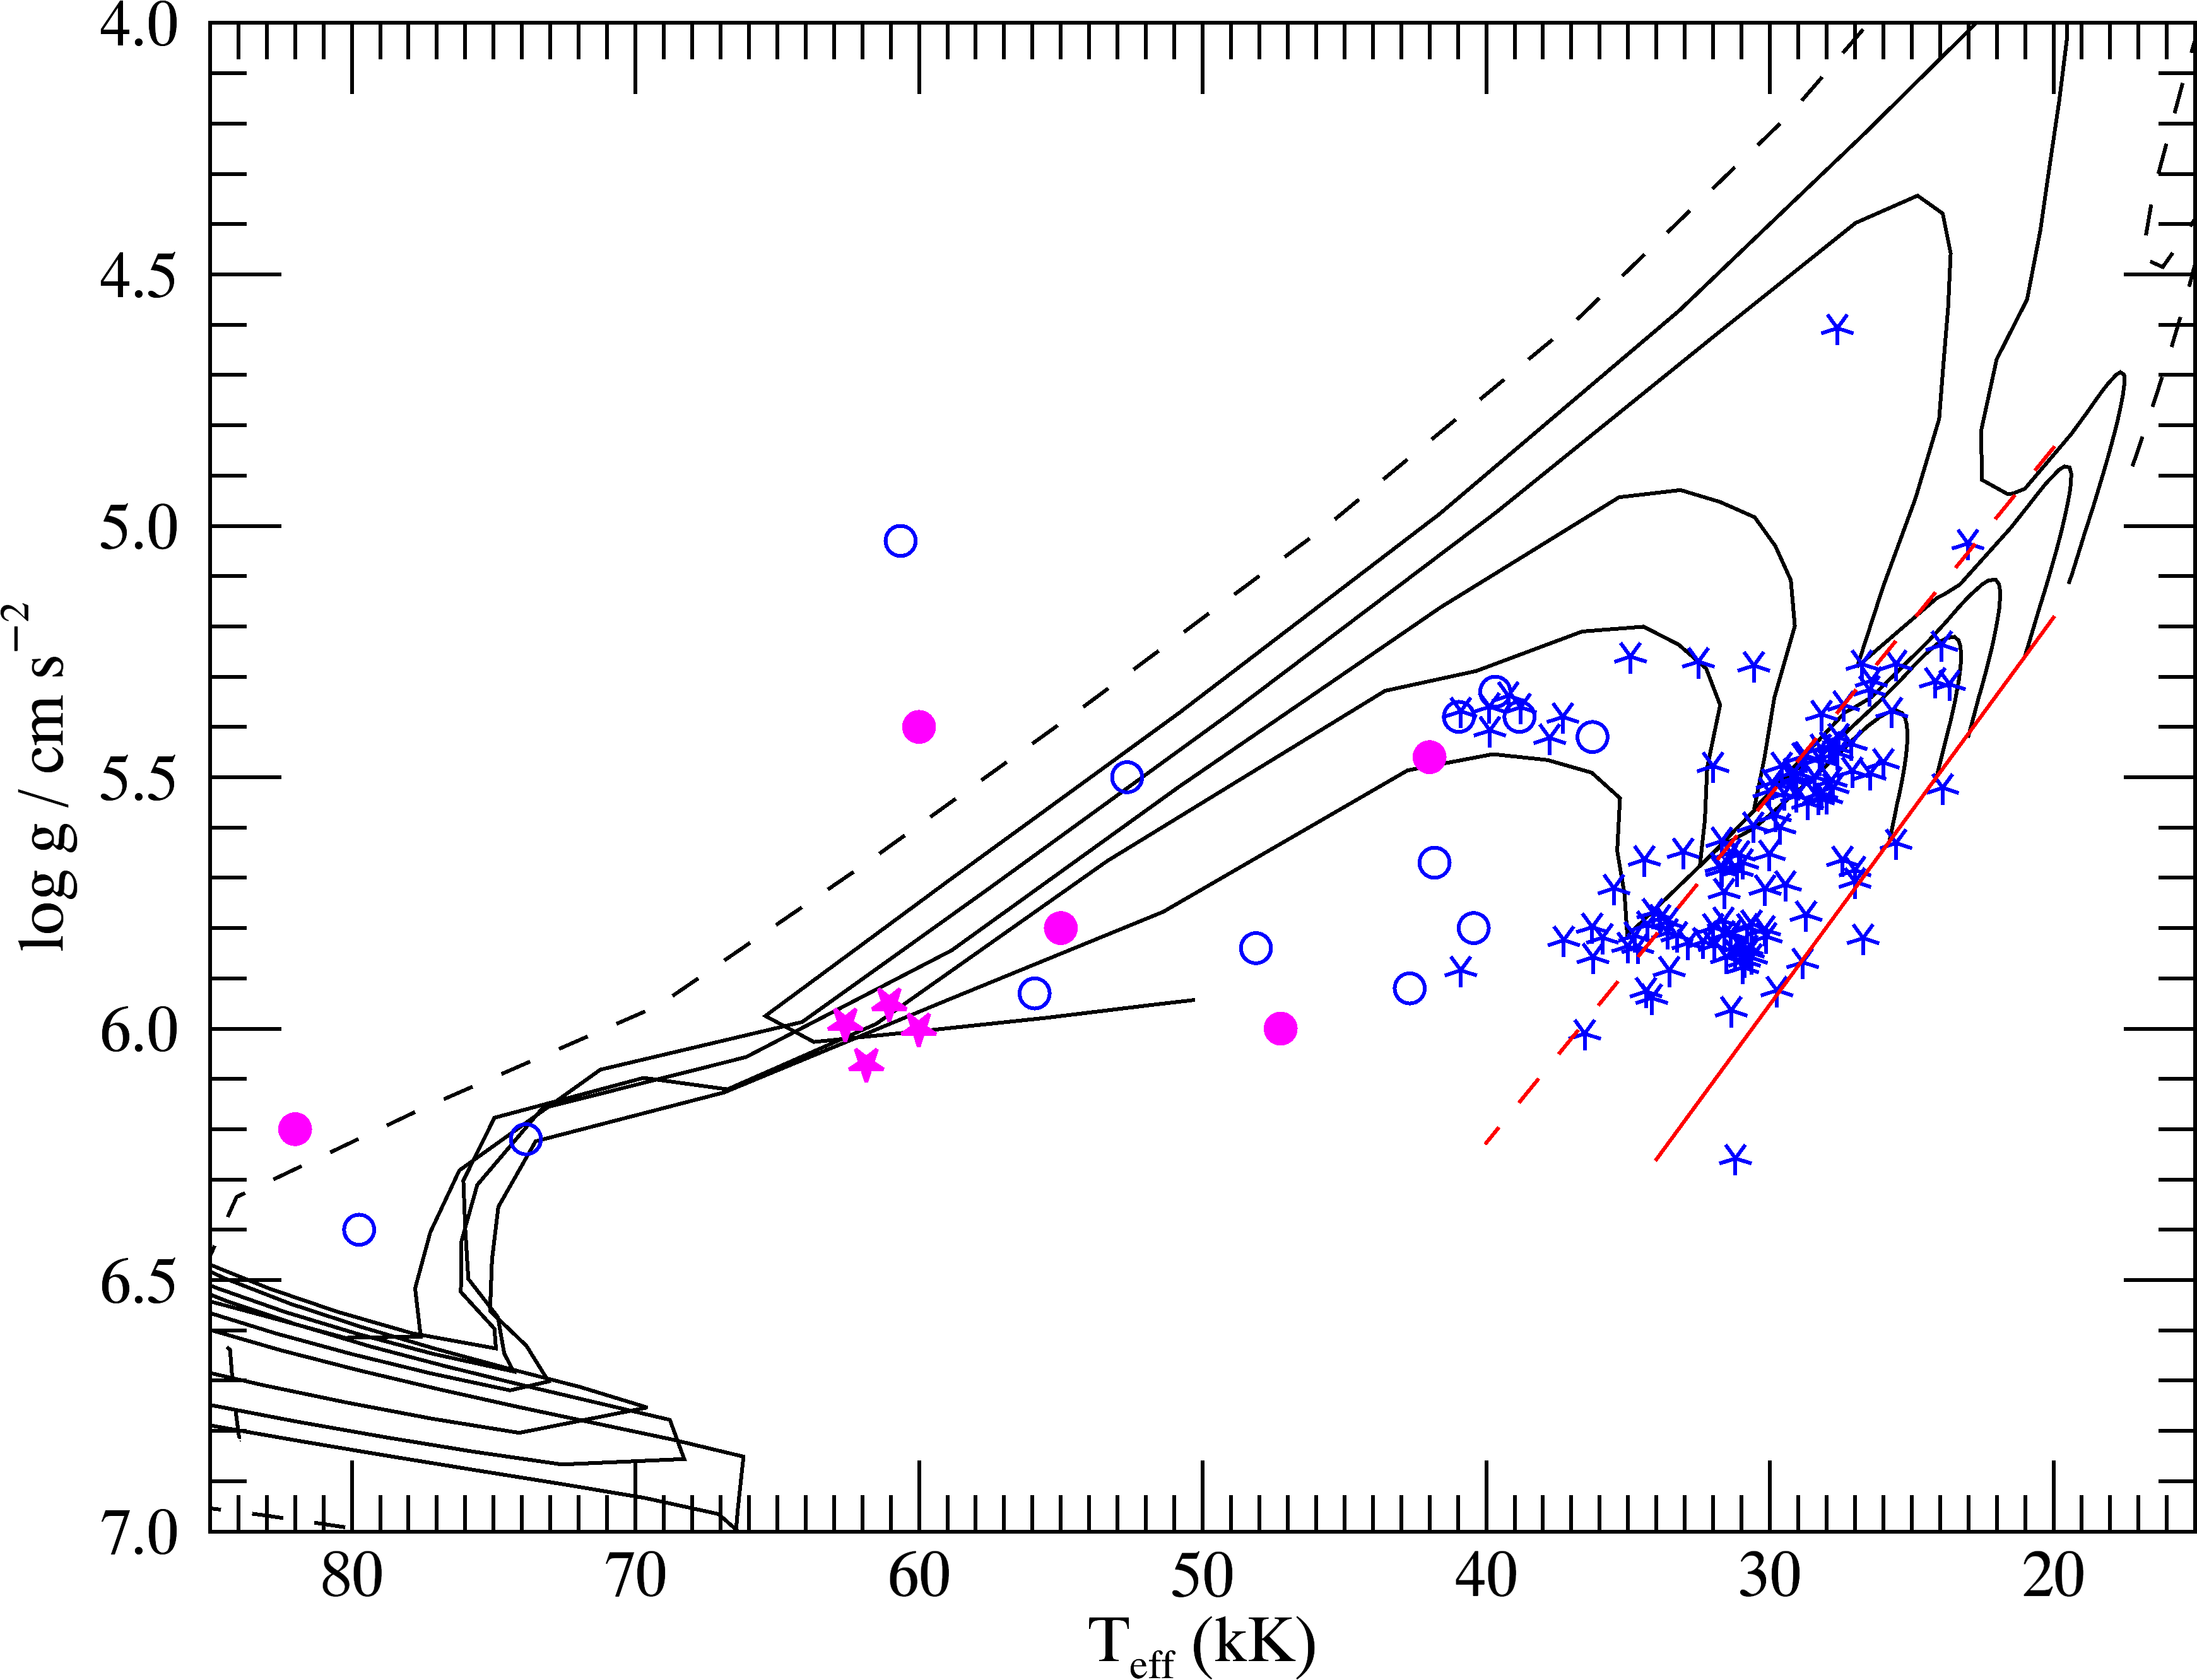
From an evolutionary point of view, H-rich sdOs are the natural progeny of the H-rich sdBs. Most of these are found in the post-EHB region of the log diagram; this is the He-shell burning phase that happens after the star reaches the terminal-age EHB (dashed red curve in Fig. 7). The most luminous among the hot sdOs can be explained if they are slightly more massive than EHB stars and are now in a post-AGB or post-early AGB phase, during which they evolve at higher luminosity due to their higher mass; the dashed track in Fig. 7 is for a post-early AGB of 0.495 . The position of our four stars in the log diagram is in good agreement with these stars being in a post-EHB phase in the region where the evolutionary tracks converge to similar surface gravity values. In addition, the agreement between the spectroscopic and Hipparcos distances of our three brightest stars does not suggest masses significantly different from the canonical value of EHB stars.
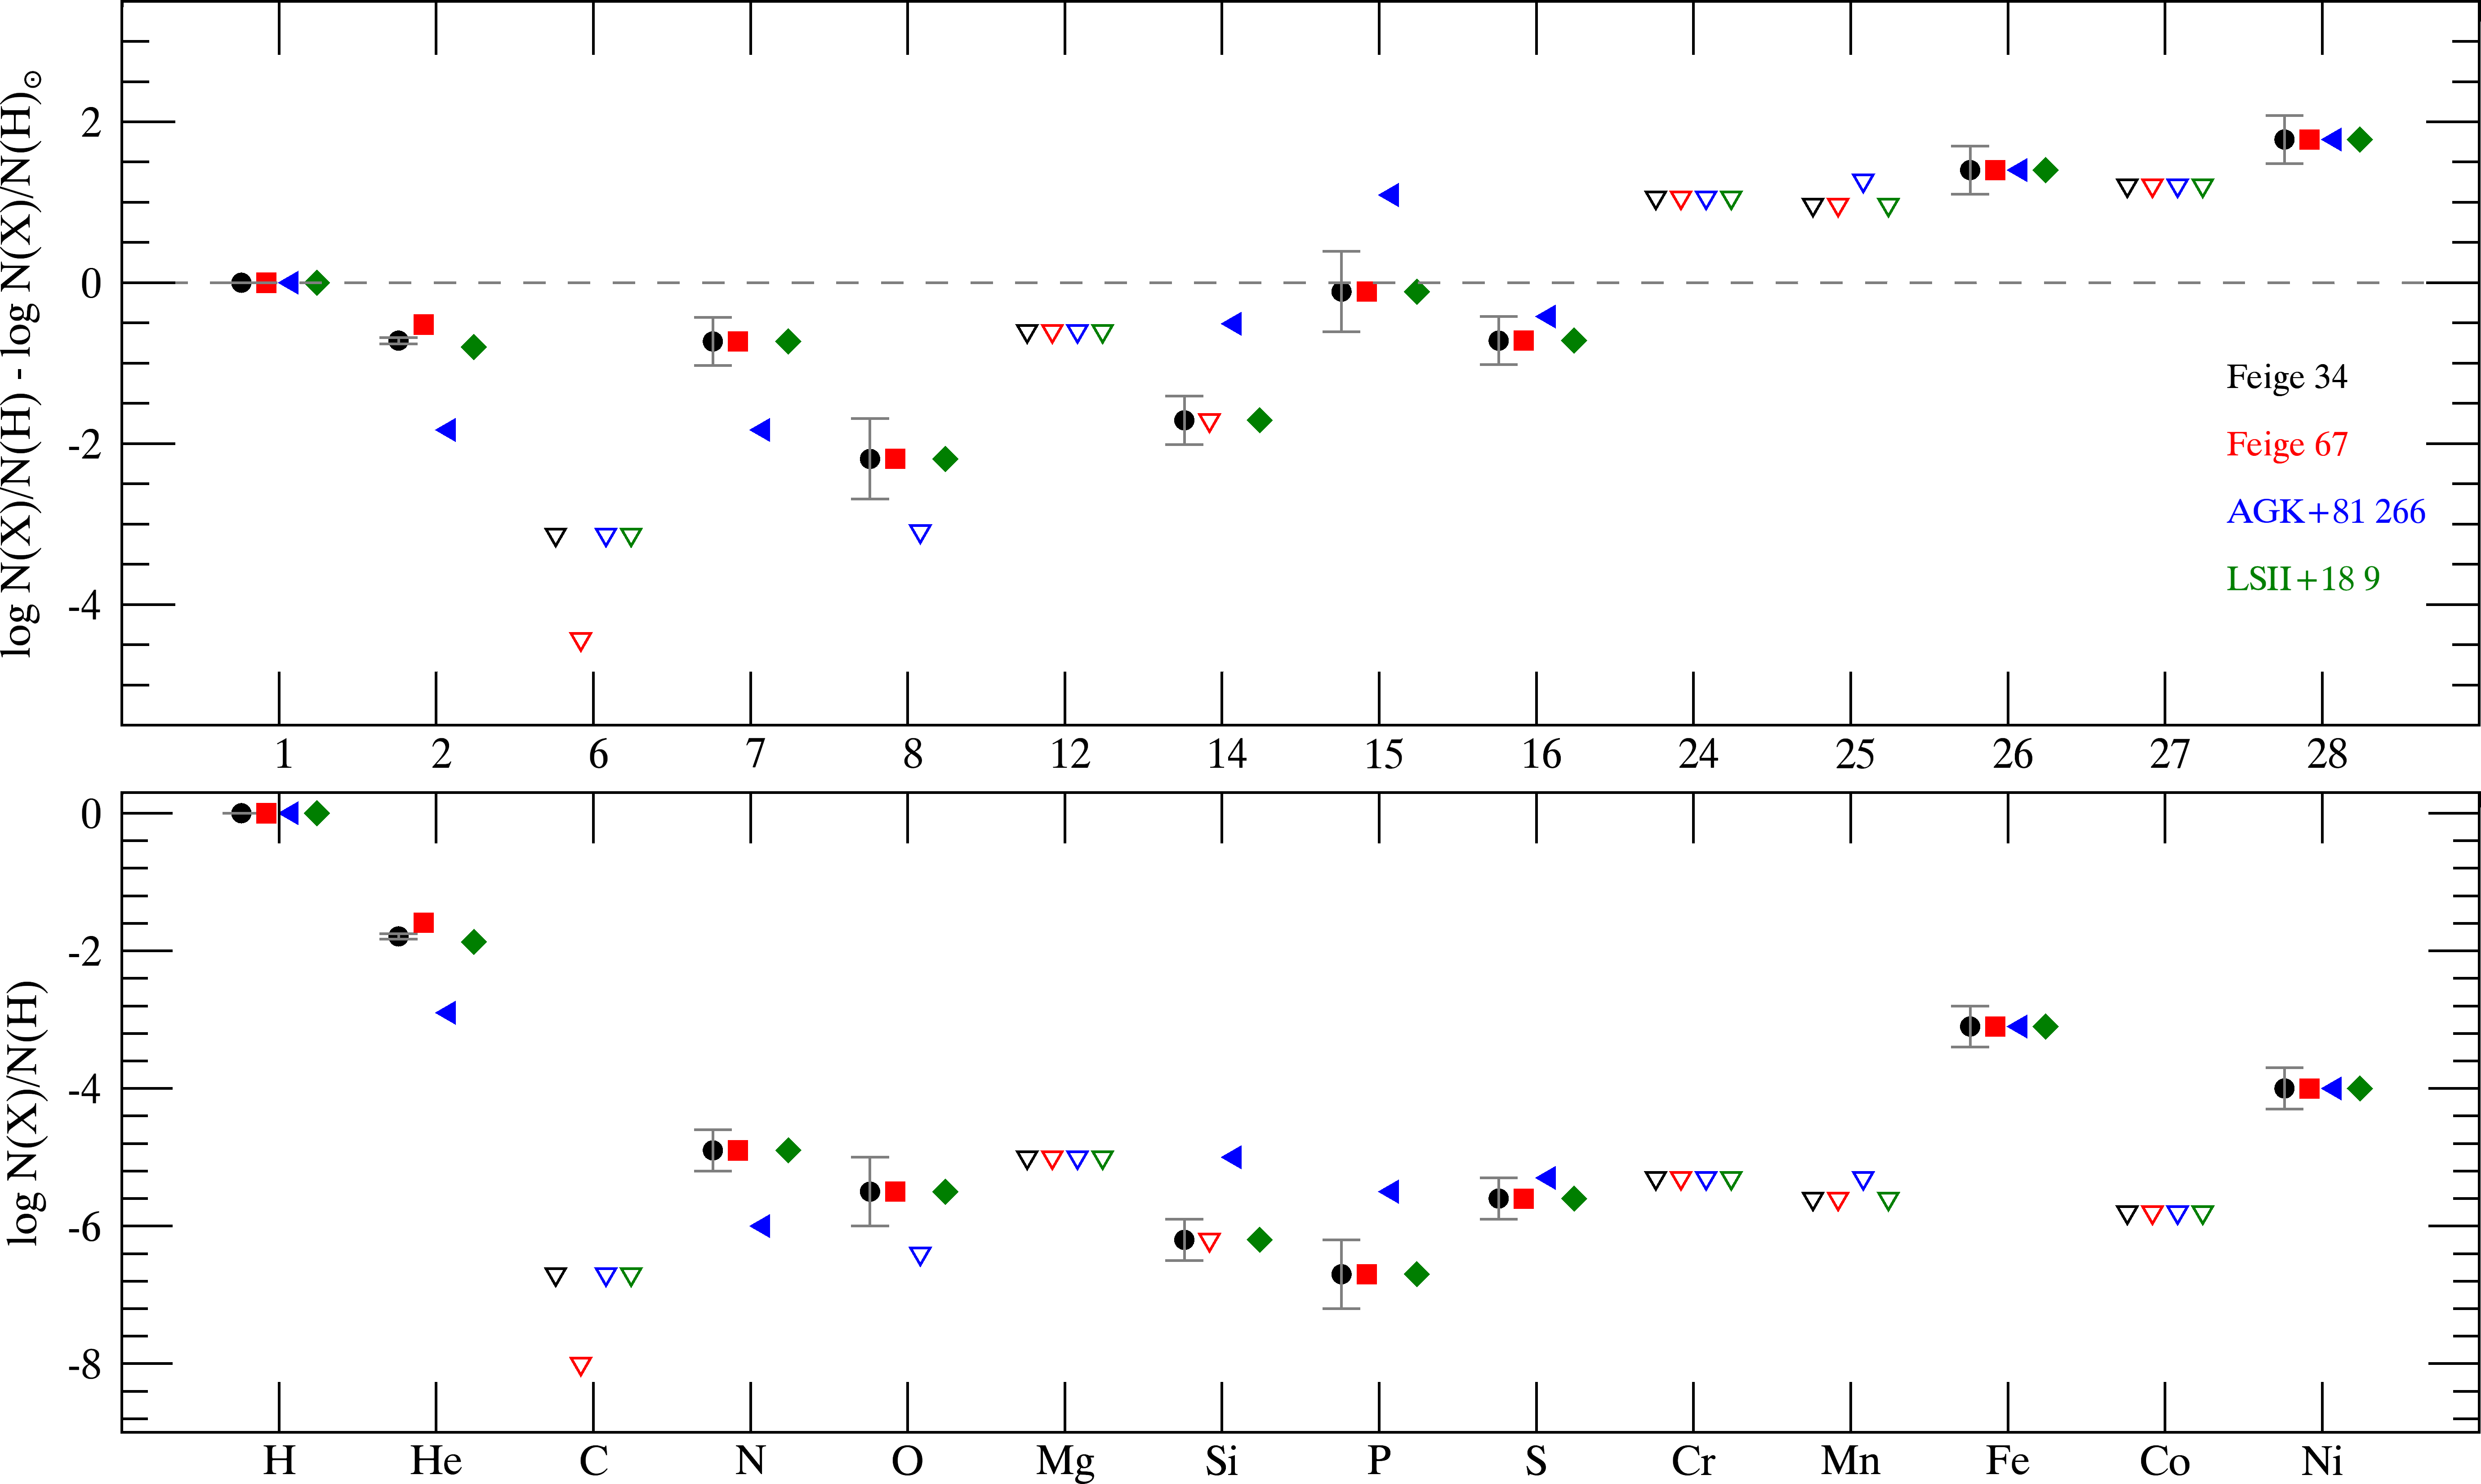
7.2 Diffusion processes
Our four stars share almost identical atmospheric parameters and extremely similar spectra. Only AGK$+$81$°$266 distinguishes itself with a helium abundance about 10 times lower than the three other stars. It also has a slightly different abundance pattern for the light elements even though it is equally enriched in iron and nickel. The derived abundances of our stars are summarized in Fig. 8. Hot subdwarf stars are known to be chemically peculiar objects and their abundances are governed by a mixture of diffusion processes along with possible stellar winds and turbulence. The chemical composition of helium enriched subdwarfs can also be greatly affected by their evolutionary history. It goes without saying that star-to-star abundance variation is the norm among hot subdwarfs, although some general tendencies can be drawn (Blanchette et al. 2008; O’Toole & Heber 2006; Geier 2013; Jeffery et al. 2017). Thus it seems rather unusual to have here a sample of four stars presenting almost the same atmospheric composition and especially strong enhancement in iron ( 25 solar) and nickel ( 60 solar).
Another interesting star is CPD71172B. This star is the hot subdwarf component of a binary system in which the F-type star dominates in the optical spectral range. The hot component was only identified via the UV excess of the system and photometric fitting resulted in a 60 0005 000 K (Viton et al. 1988). As mentioned previously, Deleuil & Viton (1992) reported the remarkable similarity of the IUE spectra of CPD71172B with that of LS II$+$18$°$9, which would make it also quite similar to the stars analysed in this work. We confirmed this statement by retrieving and comparing its FUSE spectrum to those of our stars; it is equally similar to the spectra shown in Fig. 3, suggesting comparable enrichment in iron and nickel. Small variations can be noticed in the lighter elements, for example He ii 1640 and the P v doublet are similar to those of AGK$+$81$°$266. The surface gravity of CPD71172B was found to be lower than for our stars (log 5.4; Viton et al. 1988), however it was only estimated from the photometry of the binary system, so the actual value could well be higher.
Another interesting object is the peculiar sdO star EC 114812303. Its UV spectrum indicates extreme heavy metal enhancement and it has an unusual UV continuum shape (Stys et al. 2000; Rauch et al. 2010). The atmospheric parameters ( = 55 0005000 K, log = 5.80.3) and hydrogen dominated atmosphere of this object makes it relatively similar to our sdOs. Its position in the log plane is also in agreement with the star being in the post-EHB phase (see Fig. 7).
Combining the results of our analysis of Feige 34, Feige 67, AGK$+$81$°$266, and LS II$+$18$°$9 with the literature information on CPD71172B and EC 114812303, we are getting the picture of a rather homogeneous group of helium-poor post-EHB stars sharing similar atmospheric parameters and showing strong enrichment in iron and nickel. We could think that the stars have a combination of temperature and gravity that is favourable to iron and nickel enhancement but depletes most of the lighter elements and that the phenomenon causing their chemical pattern affects our four stars (and probably CPD71172B) in a very similar way. Given that the equilibrium radiative levitation theory stipulates that stars with similar effective temperature and gravity should have similar abundances, radiative levitation could play an essential role in maintaining the abundances in the atmospheres of the stars (Chayer et al. 1995). The computations carried out by Ringat & Rauch (2012) for EC 114812303 indeed suggest that iron-peak elements are enhanced due to the effect of radiative levitation.
The He, N, Si, and P abundances observed in the atmosphere of AGK$+$81$°$266 differ significantly from those observed in the other three stars and suggest that other mechanisms could disrupt the abundances supported by radiative levitation. Radiative levitation theory predicts a unique abundance pattern for a set of effective temperature and gravity and cannot explain the abundance discrepancies. Weak stellar winds in competition with gravitational settling and radiative levitation could affect the abundances. Indeed high effective temperatures favour the presence of radiatively driven winds. Krtička et al. (2016) computed models for such winds and predicted mass loss rates of 10-10 and 10-9 yr-1 for Feige 34 and Feige 67. Although their atmospheric parameters are different than ours, their calculations show that stellar winds could be present at the surface of such stars. Stellar wind of such intensity have been observed previously in subdwarf stars, however with atmospheric parameters that are different than those of our sdOs (Lanz et al. 1997; Reindl et al. 2014). Nevertheless we recall here that no P Cygni profiles are detected in our spectra and weaker mass loss rates could be invoked for disrupting the equilibrium abundances.
7.3 Conservation of angular momentum
The majority of sdB stars, with the exception of those found in close binary systems, are known to be slow rotators. In their study of rotational properties of 105 sdB stars, Geier & Heber (2012) found that their projected rotational velocities were lower than 10 km s-1. In that case, it is surprising that our stars all show significantly higher rotation velocities. Similar high velocities have been previously reported by others. For instance, Becker & Butler (1995a) adopted a value of 30 km s-1 for Feige 67 after inspection of the iron lines in its IUE spectrum. As mentioned above, Deleuil & Viton (1992) noticed the presence of line broadening in the spectra of LS II$+$18$°$9 and CPD71172B, but they did not quantify it. The rounded cores observed in the FUSE spectrum of CPD71172B confirms that it has a sin similar to that of our four objects. Interestingly, although the absorption features of EC 114812303 in the FUSE range could not be very well modelled, Ringat & Rauch (2012) reported that lines in the theoretical models were much narrower than in their observations; these authors estimated sin = 30 km s-1.
The observations of higher rotation velocities hint at conservation of angular momentum as these stars evolve away from the EHB. For instance, according to the evolutionary tracks of Dorman et al. (1993), the radius in the post-EHB region (close to the parameters of our stars) is about two-thirds of the radius during the He-core burning phase. Conservation of angular momentum indicates that the rotation velocity would scale as 1/ (assuming a solid homogeneous sphere), thus the rotation during the post-EHB phase should increase by 1.5. However, this is at least a factor two smaller than what is observed. Still, this simple calculation illustrates that conservation of angular momentum could be responsible for increasing the rotation velocity of a star as it evolves from the EHB. More detailed calculations taking into account the internal stellar structure will be needed to validate our hypothesis.
7.4 Feige 34 binary system
Besides deriving spectroscopic distances, our SED fitting procedure allowed us to determine some parameters for the companion of Feige 34, whose temperature (3848 K) matches an early M or late K spectral type. Despite the clear presence of a companion, Feige 34 does not show significant RV variations according to previous literature (Maxted et al. 2000; Han et al. 2011). We used our series of MMT spectra of Feige 34 to compute radial velocities via cross-correlation of the different individual exposures as described in Appendix A. The resulting values are listed in Table 5, where we find an average RV = 11.0 km s-1 with a standard deviation of 7.7 km s-1. Although we do not detect important RV variations in our data, there is some scatter of the individual measurements that appears to be significant (see discussion in Appendix A). Our radial velocity is higher than the value of 5.60.4 km s-1 reported by Maxted et al. (2000) from WHT observations in 1993. Maxted et al. (2000) used the sharper emission peak in the Hα line to measure the radial velocity of Feige 34, whereas we were mainly limited to the cores of three wide Balmer lines and the He ii 4686 line, since all the metal lines are vanishingly small. However, very importantly, Maxted et al. (2000) obtained only 5 spectra over a period of 12 days, whereas our 23 spectra were taken over many years.
A possibility that could explain the lack of RV variations is if the companion is a foreground or a background object. This can be tested by comparing the surface ratio derived during the SED fit with what can be expected for an sdO star with an M dwarf companion. The surface gravity of the companion cannot be well constrained by the photometric fit but the rather high value derived suggests a main-sequence star. Considering M = 0.47 and log = 6.0 for Feige 34 and a radius in the range 0.50.65 for the companion111111for M2 to K7 main-sequence spectral type, we obtained surface ratios between 20 and 32. These are only rough estimates but they are in agreement with the best fit value of 23.5, thus suggesting that both stars are at the same distance.
We are then left with the options of a rather long period or low inclination of the system (or a combination of both) to explain the lack of RV variations above 10 km s-1. This would be in agreement with the photometric stability of the star (Marinoni et al. 2016) as a close M dwarf at high inclination would produce a reflection effect.
La Palombara et al. (2014) carried out the first systematic search for X-ray emission with the Chandra satellite for a sample of 19 bright ( ¡ 12) sdO stars. These authors detected X-rays in three of their targets, one of which was Feige 34 with a detection above the 3 level. Given the known infrared excess of the star, the authors mention that the X-ray flux detected would be consistent with the expected range for an early M-type star. Thus they could not be certain of the origin of the observed X-rays. Feige 67 was also part of their sample but no detection was made for that source121212identified as BD182647 in their paper. In the light of our results, knowing that both stars have very similar atmospheric parameters, we believe that the X-ray flux measured in Feige 34 most likely originates from its M dwarf companion.
8 Conclusions
We have analysed FUSE, IUE, and optical spectra of four hot H-sdOs (Feige 34, Feige 67, AGK$+$81$°$266, and LS II$+$18$°$9) to derive their atmospheric parameters and chemical abundances. We used the high quality optical spectra to determine their atmospheric parameters and obtained very consistent values by fitting different spectra of a given star. This means that we were not limited by the quality, resolution, or spectral range of our observations. Our main source of errors on the atmospheric parameters would then come from systematic uncertainties related to the model atmospheres and would affect our four stars in the same way. We confirm that Feige 34, Feige 67, and LS II$+$18$°$9 are remarkably similar in terms of atmospheric parameters ( within 60 00063 000 K, log within 5.96.1) and add to this group a fourth star, AGK$+$81$°$266. These parameters are in perfect agreement with a post-EHB nature for our stars.
The UV spectra of the four stars are also extremely alike, indicating that in addition to a similarity in terms of atmospheric parameters, they also are similar in terms of chemical composition. They show an important enrichment in iron and nickel that is about 25 times and 60 times solar, respectively, while the other iron group elements examined (Cr, Mn, and Co) do not seem to have abundances higher than 10 times solar. The lighter elements are found to be solar or depleted. AGK$+$81$°$266 distinguishes itself from the other three stars by slight differences in the abundances of its light elements, including helium. It is rather unexpected to have four (or three if we leave out AGK$+$81$°$266) stars with such similar abundances and spectra. Hot subdwarfs in general are known to show star-to-star variations in their chemical abundances and “spectroscopic twins” are definitely not common. It is not well understood how the different diffusion mechanisms govern the atmospheric abundances in sdBs and sdOs. In the particular case of our stars, radiative levitation could play an important role, as its effects are mainly determined by the temperature and surface gravity. Given the high effective temperature of our stars, stellar winds are predicted to be non-negligible, and we did not detect their typical P Cygni signature on resonance lines in any of our UV spectra. The upper limits suggested for the mass loss rates would be an interesting avenue to explore in future work.
We used photometric data to derive the spectroscopic distances of our stars and found our values to be in good agreement with the Hipparcos measurements available for our three brightest targets. However, the current uncertainties on the parallax are rather large and Gaia will provide more accurate values very soon. Our photometric fit of Feige 34 also puts additional constrains on the companion responsible for the infrared excess. Our results suggest a main-sequence star of about 3800 K and the surface ratio of the stars is consistent with these stars being at the same distance. However, according to our measurements Feige 34 does not show radial velocity variations higher than 10 km s-1, suggesting either a low inclination or a rather long orbital period.
Another peculiar aspect in which our four stars are similar is their significant line broadening ( sin 25 km s-1). This appears to be at odds with their presumed post-EHB nature, as the sdB stars on the EHB are known to be notoriously slow rotators ( sin ¡ 10 km s-1). A literature search highlighted two additional hot H-sdO stars (CPD71172B and EC 114812303) with atmospheric properties similar to our four stars and the spectra of both also indicate the presence of comparable rotational broadening. Computation of the angular momentum of stellar evolutionary models would be necessary to determine whether or not the rotation observed in our sdOs can be explained by angular momentum conservation as the stars contract during their post-EHB evolution.
Acknowledgements.
This work was supported by a fellowship for postdoctoral researchers from the Alexander von Humboldt Foundation awarded to M.L.. The computation of such an amount of model atmospheres was possible thanks to the CALYS cluster, which was funded by the Canada Research Chair of G. Fontaine and is maintained by P. Brassard. We are also grateful to T. Rauch and U. Heber for interesting discussions and to S. Geier for observing time. Some of the data presented in this paper were obtained from the Mikulski Archive for Space Telescopes (MAST). STScI is operated by the Association of Universities for Research in Astronomy, Inc., under NASA contract NAS5-26555. Support for MAST for non-HST data is provided by the NASA Office of Space Science via grant NNX09AF08G and by other grants and contracts. The MMT spectra analysed for this paper were obtained at the MMT Observatory, a joint facility of the University of Arizona and the Smithsonian Institution. This research has made use of the SIMBAD and Vizier databases, operated at CDS, Strasbourg, France. This research makes use of the SAO/NASA Astrophysics Data System Bibliographic Service. This work used the profile-fitting procedure OWENS developed by M. Lemoine and the French Team.References
- Ahn et al. (2012) Ahn, C. P., Alexandroff, R., Allende Prieto, C., et al. 2012, ApJS, 203, 21
- Asplund et al. (2009) Asplund, M., Grevesse, N., Sauval, A. J., & Scott, P. 2009, ARA&A, 47, 481
- Bauer & Husfeld (1995) Bauer, F. & Husfeld, D. 1995, A&A, 300, 481
- Becker & Butler (1995a) Becker, S. R. & Butler, K. 1995a, A&A, 294, 215
- Becker & Butler (1995b) Becker, S. R. & Butler, K. 1995b, A&A, 301, 187
- Becker & Butler (1995c) Becker, S. R. & Butler, K. 1995c, A&A, 300, 453
- Berger & Fringant (1978) Berger, J. & Fringant, A.-M. 1978, A&A, 64, L9
- Bergeron et al. (1992) Bergeron, P., Saffer, R. A., & Liebert, J. 1992, ApJ, 394, 228
- Bergeron et al. (1993) Bergeron, P., Wesemael, F., Lamontagne, R., & Chayer, P. 1993, ApJ, 407, L85
- Blanchette et al. (2008) Blanchette, J.-P., Chayer, P., Wesemael, F., et al. 2008, ApJ, 678, 1329
- Bohlin et al. (2001) Bohlin, R. C., Dickinson, M. E., & Calzetti, D. 2001, AJ, 122, 2118
- Chayer et al. (1995) Chayer, P., Fontaine, G., & Wesemael, F. 1995, ApJS, 99, 189
- Cutri (2012) Cutri, R. M., e. a. 2012, VizieR Online Data Catalog, 2311
- D’Cruz et al. (1996) D’Cruz, N. L., Dorman, B., Rood, R. T., & O’Connell, R. W. 1996, ApJ, 466, 359
- Deetjen (2000) Deetjen, J. L. 2000, A&A, 360, 281
- Deleuil & Viton (1992) Deleuil, M. & Viton, M. 1992, A&A, 263, 190
- Dorman et al. (1993) Dorman, B., Rood, R. T., & O’Connell, R. W. 1993, ApJ, 419, 596
- Drilling & Heber (1987) Drilling, J. S. & Heber, U. 1987, in IAU Colloq. 95: Second Conference on Faint Blue Stars, ed. A. G. D. Philip, D. S. Hayes, & J. W. Liebert, 603–606
- Fitzpatrick (1999) Fitzpatrick, E. L. 1999, PASP, 111, 63
- Fleig et al. (2008) Fleig, J., Rauch, T., Werner, K., & Kruk, J. W. 2008, A&A, 492, 565
- Fontaine et al. (2014) Fontaine, G., Green, E. M., Brassard, P., Latour, M., & Chayer, P. 2014, in Astronomical Society of the Pacific Conference Series, Vol. 481, 6th Meeting on Hot Subdwarf Stars and Related Objects, ed. V. Van Grootel, E. M. Green, G. Fontaine, & S. Charpinet, 83
- Geier (2013) Geier, S. 2013, A&A, 549, A110
- Geier & Heber (2012) Geier, S. & Heber, U. 2012, A&A, 543, A149
- Geier et al. (2015) Geier, S., Kupfer, T., Heber, U., et al. 2015, A&A, 577, A26
- Green et al. (2014) Green, E., Johnson, C., Wallace, S., et al. 2014, in Astronomical Society of the Pacific Conference Series, Vol. 481, 6th Meeting on Hot Subdwarf Stars and Related Objects, ed. V. van Grootel, E. Green, G. Fontaine, & S. Charpinet, 161
- Green et al. (2008) Green, E. M., Fontaine, G., Hyde, E. A., For, B.-Q., & Chayer, P. 2008, in Astronomical Society of the Pacific Conference Series, Vol. 392, Hot Subdwarf Stars and Related Objects, ed. U. Heber, C. S. Jeffery, & R. Napiwotzki, 75–+
- Haas (1997) Haas, S. 1997, PhD thesis, Friedrich-Alexander-Universität Erlangen-Nürnberg
- Haas et al. (1996) Haas, S., Dreizler, S., Heber, U., Jeffery, S., & Werner, K. 1996, A&A, 311, 669
- Han et al. (2011) Han, I., Burlakova, T., Valyavin, G., et al. 2011, in Magnetic Stars, 415–418
- Han et al. (2003) Han, Z., Podsiadlowski, P., Maxted, P. F. L., & Marsh, T. R. 2003, MNRAS, 341, 669
- Hauschildt et al. (1999) Hauschildt, P. H., Allard, F., Ferguson, J., Baron, E., & Alexander, D. R. 1999, ApJ, 525, 871
- Hauschildt & Baron (1999) Hauschildt, P. H. & Baron, E. 1999, Journal of Computational and Applied Mathematics, 109, 41
- Heber (2009) Heber, U. 2009, ARA&A, 47, 211
- Heber (2016) Heber, U. 2016, PASP, 128, 082001
- Hébrard & Moos (2003) Hébrard, G. & Moos, H. W. 2003, ApJ, 599, 297
- Henden et al. (2015) Henden, A. A., Levine, S., Terrell, D., & Welch, D. L. 2015, in American Astronomical Society Meeting Abstracts, Vol. 225, American Astronomical Society Meeting Abstracts, 336.16
- Høg et al. (2000) Høg, E., Fabricius, C., Makarov, V. V., et al. 2000, A&A, 355, L27
- Husser et al. (2013) Husser, T.-O., Wende-von Berg, S., Dreizler, S., et al. 2013, A&A, 553, A6
- Jeffery et al. (2017) Jeffery, C. S., Baran, A. S., Behara, N. T., et al. 2017, MNRAS, 465, 3101
- Johnson et al. (2014) Johnson, C., Green, E., Wallace, S., et al. 2014, in Astronomical Society of the Pacific Conference Series, Vol. 481, 6th Meeting on Hot Subdwarf Stars and Related Objects, ed. V. van Grootel, E. Green, G. Fontaine, & S. Charpinet, 153
- Klepp & Rauch (2011) Klepp, S. & Rauch, T. 2011, A&A, 531, L7
- Krtička et al. (2016) Krtička, J., Kubát, J., & Krtičková, I. 2016, A&A, 593, A101
- Kurucz & Bell (1995) Kurucz, R. & Bell, B. 1995, Atomic Line Data (R.L. Kurucz and B. Bell) Kurucz CD-ROM No. 23. Cambridge, Mass.: Smithsonian Astrophysical Observatory, 1995., 23
- La Palombara et al. (2014) La Palombara, N., Esposito, P., Mereghetti, S., & Tiengo, A. 2014, A&A, 566, A4
- Landstreet et al. (2012) Landstreet, J. D., Bagnulo, S., Fossati, L., Jordan, S., & O’Toole, S. J. 2012, A&A, 541, A100
- Lanz & Hubeny (1995) Lanz, T. & Hubeny, I. 1995, ApJ, 439, 905
- Lanz & Hubeny (2003) Lanz, T. & Hubeny, I. 2003, ApJS, 146, 417
- Lanz et al. (1997) Lanz, T., Hubeny, I., & Heap, S. R. 1997, ApJ, 485, 843
- Latour et al. (2013) Latour, M., Fontaine, G., Chayer, P., & Brassard, P. 2013, ApJ, 773, 84
- Latour et al. (2015) Latour, M., Fontaine, G., Green, E. M., & Brassard, P. 2015, A&A, 579, A39
- Marinoni et al. (2016) Marinoni, S., Pancino, E., Altavilla, G., et al. 2016, MNRAS, 462, 3616
- Maxted et al. (2001) Maxted, P. f. L., Heber, U., Marsh, T. R., & North, R. C. 2001, MNRAS, 326, 1391
- Maxted et al. (2000) Maxted, P. F. L., Marsh, T. R., & Moran, C. K. J. 2000, MNRAS, 319, 305
- McCook & Sion (1987) McCook, G. P. & Sion, E. M. 1987, ApJS, 65, 603
- Mermilliod (1997) Mermilliod, J. C. 1997, VizieR Online Data Catalog, 2168
- Miller Bertolami et al. (2008) Miller Bertolami, M. M., Althaus, L. G., Unglaub, K., & Weiss, A. 2008, A&A, 491, 253
- Morel & Magnenat (1978) Morel, M. & Magnenat, P. 1978, A&AS, 34, 477
- Mullally et al. (2007) Mullally, F., Kilic, M., Reach, W. T., et al. 2007, ApJS, 171, 206
- Napiwotzki (2008) Napiwotzki, R. 2008, in Astronomical Society of the Pacific Conference Series, Vol. 392, Hot Subdwarf Stars and Related Objects, ed. U. Heber, C. S. Jeffery, & R. Napiwotzki, 139–+
- Napiwotzki et al. (2004) Napiwotzki, R., Yungelson, L., Nelemans, G., et al. 2004, in Astronomical Society of the Pacific Conference Series, Vol. 318, Spectroscopically and Spatially Resolving the Components of the Close Binary Stars, ed. R. W. Hilditch, H. Hensberge, & K. Pavlovski, 402–410
- Németh et al. (2012) Németh, P., Kawka, A., & Vennes, S. 2012, MNRAS, 427, 2180
- Oke (1990) Oke, J. B. 1990, AJ, 99, 1621
- O’Toole & Heber (2006) O’Toole, S. J. & Heber, U. 2006, A&A, 452, 579
- Pancino et al. (2012) Pancino, E., Altavilla, G., Marinoni, S., et al. 2012, MNRAS, 426, 1767
- Paunzen (2015) Paunzen, E. 2015, A&A, 580, A23
- Rauch et al. (2014) Rauch, T., Rudkowski, A., Kampka, D., et al. 2014, A&A, 566, A3
- Rauch et al. (2010) Rauch, T., Werner, K., & Kruk, J. W. 2010, Ap&SS, 329, 133
- Rauch et al. (2007) Rauch, T., Ziegler, M., Werner, K., et al. 2007, A&A, 470, 317
- Reindl et al. (2014) Reindl, N., Rauch, T., Parthasarathy, M., et al. 2014, A&A, 565, A40
- Ringat & Rauch (2012) Ringat, E. & Rauch, T. 2012, in Astronomical Society of the Pacific Conference Series, Vol. 452, Fifth Meeting on Hot Subdwarf Stars and Related Objects, ed. D. Kilkenny, C. S. Jeffery, & C. Koen, 71
- Rufener (1999) Rufener, F. 1999, VizieR Online Data Catalog, 2169
- Schönberner & Drilling (1984) Schönberner, D. & Drilling, J. S. 1984, ApJ, 278, 702
- Stroeer et al. (2007) Stroeer, A., Heber, U., Lisker, T., et al. 2007, A&A, 462, 269
- Stys et al. (2000) Stys, D., Slevinsky, R., Sion, E. M., et al. 2000, PASP, 112, 354
- Thejll et al. (1991) Thejll, P., MacDonald, J., & Saffer, R. 1991, A&A, 248, 448
- Thejll et al. (1995) Thejll, P., Ulla, A., & MacDonald, J. 1995, A&A, 303, 773
- Turnshek et al. (1990) Turnshek, D. A., Bohlin, R. C., Williamson, II, R. L., et al. 1990, AJ, 99, 1243
- Valyavin et al. (2006) Valyavin, G., Bagnulo, S., Fabrika, S., et al. 2006, ApJ, 648, 559
- van Leeuwen (2007) van Leeuwen, F. 2007, A&A, 474, 653
- Viton et al. (1988) Viton, M., Burgarella, D., Cassatella, A., & Prevot, L. 1988, A&A, 205, 147
- Werner (1996) Werner, K. 1996, ApJ, 457, L39
- Werner et al. (1998) Werner, K., Dreizler, S., Haas, S., & Heber, U. 1998, in ESA Special Publication, Vol. 413, Ultraviolet Astrophysics Beyond the IUE Final Archive, ed. W. Wamsteker, R. Gonzalez Riestra, & B. Harris, 301
- Zhang & Jeffery (2012) Zhang, X. & Jeffery, C. S. 2012, MNRAS, 419, 452
Appendix A Radial velocity measurements
Most of our observed optical spectra (MMT as well as low, 8.7 Å, and medium, 1.3 Å, resolution Bok spectra) consist of multiple exposures, taken with the identical spectroscopic set-up over a period of time ranging from one month to several years, which were combined together to obtain a final high sensitivity spectrum. The combination procedure consists of removing the continuum and cross-correlating (with the IRAF task fxcor) each individual spectrum against a self-template derived from all of the spectra in an iterative process, as described in Sect. 3.1. A Fourier filter was applied to restrict the cross-correlation to features narrower than the half-width of the Balmer lines and wider than the instrumental resolution. The advantage of cross-correlating the entire spectrum, except for the small regions around interstellar lines that were excluded from the cross-correlations, against a high S/N version of the same spectrum is that all of the information in each spectrum contributes to the velocity precision; this includes weaker He and metal lines that are partially hidden in the noise of the individual spectra. As a by-product, the relative radial velocities returned by the cross-correlation procedure can be used to look for RV variations and to derive their absolute values. The latter were retrieved by measuring the RV of the combined spectrum and adding this value to each individual relative RV. The resulting values are reported in the last column of Tables 5 to 7, where the uncertainties are the sum (in quadrature) of the errors on the relative RV and the RV of the combined spectrum. The final RV of the star is obtained by computing the weighted average of the individual values and considering the standard deviation to be the uncertainty.
Spectral resolution is a an important factor determining the accuracy of the radial velocity measurements, so we selected the MMT spectra (1.0 Å) for Feige 34 and the Bok (1.3 Å) spectra for the three other stars. Since AGK$+$81$°$266 has been observed only four times with the latter setting, we additionally retrieved the RVs of the five lower resolution Bok (8.7 Å) spectra of that star. The absolute radial velocity of the combined spectrum was measured by fitting a set of mathematical functions (Gaussian, Lorentzian, and polynomial) to the spectral lines using the FITSB2 routine (Napiwotzki et al. 2004). These three functions can reproduce the line shape and continuum slope. The spectral lines are fitted simultaneously using -minimization to determine the RV shift and 1 error. We used the H, H, H, and He ii 4686 lines for the MMT spectra, the Balmer lines from H to H9 for the Bok 1.3 Å , and finally H up to H8 and the He ii 4686, 5412 lines for the Bok 8.7 Å. The relative RV standard deviations obtained with the Bok 1.3 Å (67 km s-1) are higher than the typical of 46 km s-1 obtained for constant sdB stars using the same observational setting. However, sdB stars normally show, in addition to the Balmer lines, sharper He i and metallic lines in the 36754520 Å range, thus providing better accuracy for the cross-correlation procedure, whereas only six wide Balmer lines are available for the hot sdO stars.
| UT date | UT time | HJD | SNR | RV |
| (2450000) | (km s-1) | |||
| 1996-03-11 | 03:20:54 | 153.64385 | 148.5 | 17.9 3.0 |
| 1996-03-11 | 07:08:06 | 153.80163 | 201.4 | 19.5 2.9 |
| 1996-12-17 | 11:21:39 | 434.97593 | 198.1 | 13.1 2.6 |
| 1997-01-02 | 13:21:16 | 451.06005 | 208.7 | 13.8 2.5 |
| 1997-01-28 | 08:52:44 | 476.87462 | 148.0 | 14.4 3.3 |
| 1997-03-02 | 08:41:47 | 509.86697 | 170.3 | 10.8 2.9 |
| 1997-03-03 | 06:02:37 | 510.75642 | 172.7 | 14.9 2.6 |
| 1998-01-23 | 11:24:17 | 836.97972 | 176.2 | 8.7 2.7 |
| 2002-01-23 | 05:46:06 | 2297.74486 | 235.8 | 10.4 2.2 |
| 2002-01-23 | 06:35:25 | 2297.77911 | 359.7 | 12.1 2.0 |
| 2002-01-23 | 08:24:33 | 2297.85490 | 346.8 | 10.1 2.0 |
| 2002-04-24 | 04:29:44 | 2388.68900 | 488.1 | 26.3 2.0 |
| 2002-04-24 | 07:16:44 | 2388.80497 | 120.1 | 24.1 3.8 |
| 2002-04-24 | 07:32:09 | 2388.81567 | 113.1 | 25.2 3.4 |
| 2004-12-31 | 11:41:20 | 3370.99053 | 276.6 | 11.4 2.2 |
| 2010-03-24 | 08:50:24 | 5279.87210 | 263.4 | 1.1 2.2 |
| 2010-06-11 | 03:52:37 | 5358.65934 | 390.1 | 11.6 2.6 |
| 2010-12-13 | 12:39:22 | 5544.02957 | 283.5 | 7.2 2.5 |
| 2010-12-13 | 12:43:02 | 5544.03211 | 349.7 | 5.2 2.3 |
| 2011-01-13 | 12:01:51 | 5575.00542 | 299.5 | 4.4 2.4 |
| 2013-01-03 | 11:52:18 | 6295.99831 | 221.3 | 9.5 2.5 |
| 2013-01-03 | 12:13:00 | 6296.01269 | 215.4 | 6.4 2.4 |
| 2013-01-03 | 12:21:04 | 6296.01829 | 151.0 | 4.1 3.1 |
| Average | 1239 | 11.0 7.7 | ||
While it is clear from the results listed in Tables 57 that there are no high RV variations in these stars, one still notices small fluctuations, especially in the cases of Feige 34 and LS II$+$18$°$9, where the standard deviation is larger than the average uncertainties. In order to estimate whether the RV variations could be statistical or not we computed the probability of obtaining such a sample from random fluctuations of constant value. We followed the method described in Maxted et al. (2001), where the value is defined as
| (1) |
where is the RV, the average RV, and the error on the RV. The obtained is then compared with the -distribution for the appropriate degree of freedom to obtain the probability . From that test, we found that only the MMT data of Feige 34 returned a probability smaller than 0.01% (or log 4.0), meaning that the variations in the data are significant. Despite that, we could not find a distinct period matching the data with a simple periodogram analysis, i.e. looking for sinusoidal variations. This is very likely due, at least in part, to the sparse time sampling, which was a result of the fact that these spectra were obtained primarily for flux calibration rather than RVs.
| UT date | UT time | HJD | SNR | RV |
| (2450000) | (km s-1) | |||
| Feige 67 | ||||
| 2013-01-02 | 11:33:45 | 6294.98486 | 124.8 | 33.3 6.3 |
| 2013-01-05 | 11:23:39 | 6297.97754 | 115.7 | 19.0 7.2 |
| 2013-01-21 | 12:10:41 | 6314.01123 | 115.1 | 33.8 6.4 |
| 2013-01-21 | 12:14:59 | 6314.01465 | 114.6 | 36.7 6.1 |
| 2013-01-22 | 10:39:57 | 6314.94824 | 109.3 | 27.9 6.8 |
| 2013-01-22 | 10:43:50 | 6314.95117 | 110.6 | 37.8 6.1 |
| 2013-01-31 | 10:56:58 | 6323.96094 | 105.2 | 21.9 6.0 |
| 2013-02-27 | 09:43:24 | 6350.91113 | 86.0 | 16.8 8.8 |
| 2013-03-01 | 11:25:50 | 6352.98291 | 108.4 | 23.9 7.2 |
| Average | 331 | 27.0 7.8 | ||
| LS II$+$18$°$9 | ||||
| 2012-06-21 | 09:13:04 | 6099.89062 | 132.2 | 43.2 6.3 |
| 2012-06-21 | 09:20:44 | 6099.89600 | 127.9 | 39.6 6.1 |
| 2012-06-21 | 11:04:52 | 6099.96826 | 114.6 | 37.7 8.6 |
| 2012-08-01 | 07:59:10 | 6140.84033 | 103.5 | 56.1 7.7 |
| 2012-08-01 | 08:08:04 | 6140.84668 | 106.7 | 57.2 7.5 |
| 2012-08-02 | 07:46:07 | 6141.83105 | 117.0 | 65.1 6.5 |
| 2012-08-02 | 07:54:37 | 6141.83691 | 113.5 | 62.4 6.8 |
| 2012-08-03 | 08:46:12 | 6142.87256 | 112.9 | 47.5 7.8 |
| 2012-08-03 | 08:54:42 | 6142.87891 | 113.2 | 58.0 6.8 |
| 2012-08-29 | 05:29:43 | 6168.73584 | 138.0 | 27.4 6.8 |
| Average | 374 | 49.5 12.3 | ||
| AGK$+$81$°$266 | ||||
| 2013-01-05 | 09:37:59 | 6297.90625 | 116.2 | 33.6 6.3 |
| 2013-01-22 | 08:34:03 | 6314.86133 | 114.7 | 12.4 5.4 |
| 2013-01-22 | 08:39:31 | 6314.86523 | 115.9 | 31.2 6.1 |
| 2013-01-31 | 08:16:53 | 6323.84912 | 78.7 | 15.8 5.8 |
| Average | 215 | 22.1 10.7 | ||
| UT date | UT time | HJD | SNR | RV |
| (2450000) | (km s-1) | |||
| 2003-12-01 | 12:14:46 | 2975.01367 | 164.7 | 34.5 12.3 |
| 2005-04-17 | 02:52:31 | 3477.62036 | 138.3 | 25.1 13.5 |
| 2006-02-12 | 07:37:43 | 3778.82129 | 168.7 | 19.4 13.3 |
| 2006-12-11 | 11:47:14 | 4080.99438 | 160.1 | 49.0 12.7 |
| 2010-03-28 | 04:18:38 | 5283.68066 | 154.2 | 30.6 13.9 |
| Average | 352 | 34.1 11.2 | ||
Our final RV value for Feige 67 (278 km s-1) is in good agreement with the value reported by Drilling & Heber (1987) of 296 km s-1. As for LS II$+$18$°$9, the same authors reported a RV of 25 km s-1 (no errors) while the value measured by Deleuil & Viton (1992) is 50 km s-1 (also no errors provided). Our own value of 49.512 km s-1 is in better agreement with the latter. In the case of AGK$+$81$°$266, we additionally retrieved the RVs of the five lower resolution Bok (8.7 Å) spectra (Table 7). The mean RVs obtained with both sets of data agree within their uncertainties and we computed a final RV of 27.87.8 km s-1.
In conclusion, we do not detect any large variations in the radial velocities of our stars, but we cannot rule out smaller scale (below 10 km s-1) variations since some scatter in the individual measurements is seen. In the case of Feige 34 a false-alarm probability test indicated that the variations cannot be purely statistical. We cannot rule out that some instrumental effects could be unaccounted for in our evaluation of the individual uncertainties. Such instrumental effects will be better characterized once the data for the whole sample of subdwarfs observed for this survey are processed. Nevertheless, with the exception of the second from the last Feige 34 RV value (for which we cannot point to any problem in the data), it is noteworthy that spectra obtained at nearly the same time all result in very similar RVs, even as the average values change by a considerably larger amount over longer time periods. Furthermore, Geier et al. (2015) reported intriguing irregular RV variations in some He-rich sdO and Green et al. (2014) observed irregular and occasional luminosity drops in some sdO light curves. Both phenomena still await an explanation. It could be that some similar, low scale variations are occurring among the stars of our sample.
Appendix B Additional material
| Photometric system | Reference |
|---|---|
| Johnson-Cousins | Morel & Magnenat (1978) |
| Mermilliod (1997) | |
| Henden et al. (2015) | |
| Strömgren | Paunzen (2015) |
| Tycho | Høg et al. (2000) |
| Hipparcos | van Leeuwen (2007) |
| SDSS | Ahn et al. (2012) |
| Henden et al. (2015) | |
| 2MASS | Henden et al. (2015) |
| WISE | Cutri (2012) |
| Geneva | Rufener (1999) |