Modelling chemical abundance distributions for dwarf galaxies in the Local Group: the impact of turbulent metal diffusion
Abstract
We investigate stellar metallicity distribution functions (MDFs), including Fe and -element abundances, in dwarf galaxies from the Feedback in Realistic Environments (FIRE) project. We examine both isolated dwarf galaxies and those that are satellites of a Milky Way-mass galaxy. In particular, we study the effects of including a sub-grid turbulent model for the diffusion of metals in gas. Simulations that include diffusion have narrower MDFs and abundance ratio distributions, because diffusion drives individual gas and star particles toward the average metallicity. This effect provides significantly better agreement with observed abundance distributions in dwarf galaxies in the Local Group, including small intrinsic scatter in [/Fe] vs. [Fe/H] of 0.1 dex. This small intrinsic scatter arises in our simulations because the interstellar medium in dwarf galaxies is well-mixed at nearly all cosmic times, such that stars that form at a given time have similar abundances to 0.1 dex. Thus, most of the scatter in abundances at = 0 arises from redshift evolution and not from instantaneous scatter in the ISM. We find similar MDF widths and intrinsic scatter for satellite and isolated dwarf galaxies, which suggests that environmental effects play a minor role compared with internal chemical evolution in our simulations. Overall, with the inclusion of metal diffusion, our simulations reproduce abundance distribution widths of observed low-mass galaxies, enabling detailed studies of chemical evolution in galaxy formation.
keywords:
methods: numerical – diffusion – galaxies: abundances – galaxies: dwarf1 Introduction
Dwarf galaxies, which probe the low-mass (M∗ 109 M⊙) end of the galaxy mass spectrum, serve as an environment to test models of galaxy formation. Dwarf galaxies are extremely sensitive to feedback effects from supernovae (SNe) and stellar winds, owing to their shallow gravitational potential wells. This results in significant mass loss (e.g., Dekel & Silk, 1986), and thus metal loss, which is relevant for studies of galactic chemical evolution.
Owing to their small sizes, low masses, and relatively inefficient star formation, dwarf galaxies can be challenging to simulate accurately. However, given that they form out of a small volume, dwarf galaxies are ideal for targeted zoom-in simulations. Hydrodynamical simulations of galaxy evolution have achieved increasingly high baryonic particle mass resolution, such that only a few SNe occur per star particle, where each star particle represents a single stellar population. The limited mass-sampling of chemical enrichment histories thus becomes important for simulating dwarf galaxies in the given stellar mass range. Consequently, the predicted chemical evolution of dwarf galaxies will be impacted by the specific feedback implementation used in such simulations. For example, the predicted abundances are subject to stochastic sampling of nucleosynthetic events (e.g., the “enrichment sampling problem” of Wiersma et al. 2009).
A majority of the studies investigating the detailed properties of chemical evolution have been based on one-zone numerical models of galactic chemical evolution with instantaneous mixing (Lanfranchi & Matteucci, 2003, 2007, 2010; Lanfranchi et al., 2006; Kirby et al., 2011a). Only recently have hydrodynamical simulations of cosmological isolated dwarf galaxies attempted to go beyond accurately reproducing the stellar mass-metallicity relation (Ma et al., 2016) to include more detailed chemical evolution properties (Marcolini et al., 2008; Revaz et al., 2009; Sawala et al., 2010; Revaz & Jablonka, 2012). For example, Sawala et al. (2010) simulated the metallicity distribution functions (MDFs) and -element abundance ratios for isolated dwarf galaxies, yet the MDF is broad compared to observations (Kirby et al., 2011a) and contains a pronounced, unobserved low-metallicity tail, whereas the scatter in the -element abundances is large, particularly at low-metallicity (Tolstoy et al., 2009; Kirby et al., 2011b; Frebel & Norris, 2015). However, both MDFs and abundance ratios can serve as tests of the metal injection scheme, energy and momentum injection from stellar feedback, yields, and microphysics in the interstellar medium (ISM).
Until recently (e.g., Shen et al. 2010; Shen et al. 2013; Pilkington et al. 2012; Brook et al. 2014), sub-grid turbulent diffusion has been neglected in many astrophysical simulations based on Lagrangian methods, such as smoothed particle hydrodynamics (SPH) or mesh-free methods. This is despite the fact that supersonic, compressible flows result in a turbulent cascade that transports momentum to small scales, where viscous forces begin to dominate (Wadsley et al., 2008). Furthermore, “standard” SPH methods are known to suppress mixing on small scales, in contrast to Eulerian codes (Agertz et al., 2007) and other finite-volume methods (Hopkins, 2015), which include intrinsic numerical diffusion (e.g., Recchi et al. 2001). In contrast to most prior galaxy evolution simulations, the Feedback in Realistic Environments (FIRE)111The FIRE project website is http://fire.northwestern.edu. project (Hopkins et al., 2014, 2017) has recently implemented (Su et al., 2017) a model for turbulent metal diffusion (TMD) due to unresolved, small-scale eddies.
Su et al. (2017) considered the impact of sub-grid metal diffusion in the context of a realistic, multi-phase ISM influenced by strong stellar feedback processes. They found that sub-grid metal diffusion does not significantly impact cooling physics, having no systematic effect on galactic star formation rates. This is in contrast to the findings of Shen et al. (2010) and Pilkington et al. (2012) on the effects of including fluid microphysics. For example, Shen et al. (2010) concluded that simulations without sub-grid metal diffusion produce slightly fewer stars, since fewer gas particles experience gas cooling and subsequently turn into stars. Comparatively low spatial resolution, such that the turbulent driving scales are not resolved, could potentially explain the discrepancy (Su et al., 2017). Although sub-grid metal diffusion does not significantly impact cooling rates or star formation rates in the FIRE simulations, sub-grid metal diffusion is expected to strongly impact chemical evolution.
Motivated by previous studies (e.g., Aguirre et al. 2005) that have shown that metals are too inhomogeneous in simulations, the introduction of a diffusive term on sub-grid scales has recently been explored as a promising solution to the problem of reproducing realistic MDFs and abundances. Shen et al. (2010) implemented a turbulence-induced mixing model in SPH simulations based on velocity shear, as opposed to the velocity-dispersion based model of Greif et al. (2009). Using the latter model, Jeon et al. (2017) incorporated metal diffusion into a fully cosmological study of the chemical abundances of ultra-faint dwarf galaxies. Williamson et al. (2016) investigated sub-grid metal mixing in non-cosmological, isolated dwarf galaxies, and found that the metallicity of stars is not strongly dependent on how the diffusivity is calculated from the the velocity distribution. In addition, they observed a reduction of scatter in stellar abundances and the suppression of low-metallicity star formation. Pilkington et al. (2012) found that sub-grid metal diffusion reduced the overproduction of extremely metal poor stars, except for M33-like spiral galaxies, as opposed to dwarf galaxies.
Hirai & Saitoh (2017) explored the efficiency of sub-grid metal mixing in non-cosmological isolated dwarf galaxy simulations, focusing on reproducing the scatter in barium inferred from extremely metal-poor stars (Suda et al., 2008). They concluded that the timescale for metal mixing necessary to reproduce observations of barium is 40 Myr, which is shorter than the typical dynamical timescale of dwarf galaxies ( 100 Myr). Kawata et al. (2014) investigated the impact of strong stellar feedback in a simulation of a WLM-like, non-cosmological dwarf disc galaxy, finding that including sub-grid diffusion maintained low-metallicity in star-forming regions owing to efficient metal mixing in the ISM. Comparing their results on the dispersion in the abundances of newly formed stars to observations, they concluded that their sub-grid diffusion was likely too strong. Revaz et al. (2016) showed that metal diffusion can reproduce the low scatter in -elements at low metallicity in particle-based simulations. However, they concluded that a “smoothed metallicity scheme” (Wiersma et al., 2009), in which metallicity is treated as a smoothly varying function and involves no explicit redistribution of metals, is preferable over sub-grid metal diffusion to reproduce the observed dispersion in abundances of dwarf galaxies.
In this work, we use the high-resolution, cosmological zoom-in simulations of the FIRE project to analyse the impact of turbulent metal diffusion on observables related to chemical evolution for simulated dwarf galaxies in the mass range M∗( = 0) 7 105 - 2 108 M⊙. First, we study a small sample of cosmological field dwarf galaxies simulated at very high resolution, then expand our analysis to include satellite and isolated dwarf galaxies of a Milky Way (MW) mass halo (Wetzel et al., 2016). We find that the inclusion of a physically-motivated, sub-grid turbulent diffusion model produces MDFs and abundance ratios consistent with observations of Local Group (LG) dwarf galaxies. We confirm the necessity of including sub-grid metal mixing in Lagrangian hydrodynamical codes, while taking into account a multi-phase ISM, explicit stellar and radiative feedback, the impact of cosmological accretion, and environmental effects.
2 Simulations
| Simulationa | b (106 ) | [Fe/H]c (dex) | d (dex) |
|---|---|---|---|
| m10q | 1.7 | 2.16 | 0.55 |
| m10q.md | 2.0 | 2.12 | 0.41 |
| m10v222The galaxy labelled m10v analysed in this paper (and the version of the run with sub-grid metal diffusion, m10v.md) is not the usual m10v included in previous FIRE papers. Instead, this m10v is a significantly contaminated galaxy in the same cosmological volume with a larger stellar mass (1.1 M⊙, as compared to 105 M⊙) at the outskirts of the high-resolution region. We emphasize that the comparisons between our m10v and m10v.md are internally consistent, since they both suffer from low-resolution dark matter contamination, and that despite this, they still produce realistic dwarf galaxies. Additionally, the majority of our conclusions are based on the properties of the collective simulated dwarf galaxy sample, particularly m10q and the satellite and isolated dwarf galaxies around m12i (§ 5) | 1.1 | 1.82 | 0.52 |
| m10v.md | 1.5 | 1.54 | 0.34 |
-
•
Note. — All quantities are determined at = 0. For all isolated dwarf galaxy simulations, the star particle spatial resolution is 1.4 pc and the mass resolution is 250 . For more details on the methods used to simulate the cosmological, isolated dwarf galaxies, see Oñorbe et al. (2014), Hopkins et al. (2014), and Hopkins et al. (2017).
-
a
The simulation naming convention reflects the halo mass, e.g., m10 1010 at = 0. The designations “q" and “v" reflect initial conditions that distinguish between halos dominated by early- and late-time star formation respectively. The addition “.md" indicates that the simulation was run with sub-grid turbulent metal diffusion (§ 2.2).
-
b
Defined as the mass within the radius that contains 90% of the stellar mass, .
-
c
The mass-weighted average metallicity of star particles within (Eq 4) and,
-
d
the associated standard deviation, or intrinsic spread in the metallicity distribution.
We present a generalized summary of the relevant features of the FIRE simulations (Hopkins et al., 2014, 2017). The simulations analysed here (e.g., Table 1) were run with the “FIRE-2” (Hopkins et al., 2017) rerun of GIZMO333The public version of GIZMO is available at http://www.tapir.caltech.edu/~phopkins/Site/GIZMO.html in its Meshless Finite Mass (MFM) mode (Hopkins, 2015). All feedback quantities are based on stellar evolution models that are identical between “FIRE-1” (Hopkins et al., 2014) and “FIRE-2”, such that galaxy-scale properties do not qualitatively change between versions of the code (Hopkins et al., 2017).
The MFM method combines advantages from both SPH and grid-based codes. FIRE cosmological simulations of dwarf galaxies have reproduced several key observations. These include the bursty star formation and outflows generated by low-mass galaxies at high redshift (Muratov et al., 2015), the stellar mass-halo mass relation at both = 0 (Oñorbe et al., 2015) and at high redshift (Ma et al., 2017), the dark matter halo profile in dwarf galaxies (Chan et al., 2015), the size evolution and age gradients of dwarf galaxies (El-Badry et al., 2016), the stellar mass-metallicity relation (Ma et al., 2016), and the stellar kinematics of dwarf galaxies (Wheeler et al., 2017), all without calibration to match observations at = 0.
2.1 Gas Cooling, Star Formation, and Feedback
Gas follows a cooling curve from 10 – 1010 K, with cooling at low temperatures due to molecular transitions and metal-line fine structure transitions, and primordial and metal line cooling at higher temperatures ( 104 K). A uniform, redshift-dependent photoionizing background (Faucher-Giguère et al., 2009) is taken into account at each timestep when determining the cooling rates.
Star formation occurs only in dense, molecular, self-gravitating regions with 1000 cm-3. When these conditions are met, stars form at 100% efficiency per local free-fall time, although stellar feedback rapidly regulates the global star formation efficiency to a few percent on the scales of giant molecular clouds (Orr et al., 2016). The newly formed star particle inherits its metallicity from its progenitor gas particle. 11 total chemical species (H, He, C, N, O, Ne, Mg, Si, S, Ca, Fe), including - and Fe peak elements, which are particularly relevant to constraining star formation history (SFH), are tracked in addition to the total metallicity (Wiersma et al., 2009). Each star particle is treated as a single stellar population with a Kroupa (2002) initial mass function (IMF), with known age, mass, and metallicity. Feedback quantities such as luminosity, Type II SN rates, and the rates of mass and metal loss are calculated based on stellar population models (STARBURST99; Leitherer et al. 1999). SN explosions occur discretely, as opposed to modelling their collective effects. Metal yields for Type Ia SNe are adopted from Iwamoto et al. (1999), where the rates follow Mannucci et al. (2006), including both prompt and delayed populations. Metal yields for Type II SNe (Nomoto et al., 2006) and stellar winds (AGB & O-stars) are also included, as well as their contributions to ejecta energy, momentum, and mass. All feedback quantities are deposited directly into the ISM (gas particles) surrounding a given star particle, where mass, energy, and momentum are conserved. Radiative feedback from local photo-ionization, photo-electric heating, and radiation pressure, are also included.
2.2 Turbulent Metal Diffusion
Although metals are diffused via turbulence in a realistic ISM, this has yet to be taken into account in many galaxy evolution and formation simulations (Wadsley et al., 2008). Lagrangian codes, such as SPH and MFM, follow fluid elements of fixed mass. Particles conserve metallicity unless injected with metals or metal loss occurs owing to SNe/stellar winds. However, SPH, or any Lagrangian methods (MFM), do not account for additional mixing that occurs via sub-grid Kelvin-Helmholtz instabilities, Rayleigh-Taylor instabilities, and turbulent eddies between gas particles. That is, without sub-grid metal diffusion, the metals assigned to a given gas particle are locked to that particle for all time. Consequently, gas particles may never become enriched, resulting in artificial noise in the MDF. Other sources of noise that may impact the appearance of the MDF are addressed in Appendices A and B. Moreover, even enriched particles contribute to an unrealistic spread in metallicity in the absence of sub-grid mixing. To account for such unresolved mixing processes, some of the simulations include an explicit metal diffusion term between particles, following the prescription investigated by Shen et al. (2010) based on the Smagorinsky (1963) model,
| (1) |
where h is the resolution scale, and is proportional to Smagorinsky-Lilly constant calibrated from direct numerical simulations (Su et al., 2017; Hopkins et al., 2017). For a discussion of the coefficient calibration, see Appendix C. We adopt a value of 0.003. The symmetric traceless shear tensor is given by
| (2) |
where v is the associated shear velocity.
More simplistically, , where the largest unresolved eddies dominate the sub-grid diffusivity, i.e., . The only effect of a sub-grid prescription is to smooth variations in metallicity between fluid elements. However, since the shear tensor (Eq 2) can be artificially triggered by bulk motion such as rotation, the above model for turbulent diffusion likely over-estimates the true diffusivity. We further address the possibility of over-mixing and illustrate the robustness of our results with respect to the diffusion coefficient in Appendix D.
3 Metallicity Distribution Functions
3.1 Metallicity Definitions
We analyse the stellar-mass weighted444We weight the MDFs and mean metallicities by stellar mass, though mass-weighting does not significantly impact these quantities. The FIRE simulations include standard particle splitting and merging such that no particle ever deviates from the median particle mass by more than a factor of 3. That is, 99.99% of all star particles are within 0.2 dex of the median particle mass (Hopkins et al., 2017). metallicity555We adopt the observational convention, where metallicity refers to stellar iron abundance ([Fe/H]) distribution functions of the simulations to quantify the impact of metal diffusion. The abundances from the simulation are calculated from the absolute metal mass fractions per element of a star particle,
| (3) |
where and represent chemical species, is the atomic mass for a given species, is the metal mass fraction, and is the abundance relative to solar (Anders & Grevesse, 1989; Sneden et al., 1992), observationally determined from , the number density of the species.
We adopt the following definition of mean metallicity, [Fe/H] (Table 1), motivated by observational measurements of Local Group dwarf galaxies (Kirby et al. 2010; Kirby et al. 2013; Table 2),
| (4) |
where [Fe/H]i is the metallicity of an individual star particle, calculated according to Eq. 3, mi is the mass of the star particle, and is the total number of star particles in a given simulation. This is in contrast to the definition of mean metallicity based on mass-averaged metal mass fractions used previously in FIRE papers (Ma et al., 2016; Wetzel et al., 2016),
| (5) |
where fFe,i is the absolute iron mass fraction of a star particle. Eq. 4 is the mean of the logarithm, whereas Eq. 5 is the logarithm of the mean.
The Eq. 5 definition is appropriate for more distant galaxies, where the stellar metallicity is determined from galaxy-integrated spectra. In this case, stellar population synthesis models are used to measure Fe and Mg, which dominate the absorption features in stellar atmospheres (e.g., Gallazzi et al. 2005). However, Eq. 5 is not consistent with mean metallicity measurements based on spectra of resolved stellar populations, i.e., LG dwarf galaxies.
In the Eq. 5 mean metallicity definition, metal-rich stars are weighted heavily, particularly for galaxies with skewed MDFs, such that the scatter in the stellar mass-metallicity relation and the mean metallicity for such galaxies increases. As shown in the right panel of Figure 1, this results in a 0.3 dex discrepancy in the FIRE stellar mass-metallicity relation between definitions of mean metallicity. Adopting the observationally motivated definition (Eq. 4) similarly results in a 0.3 dex offset relative to the observed mass-metallicity relation for LG dwarf galaxies, whereas the alternate definition (Eq. 5) shows some overlap with observations.
The offset in the FIRE stellar mass-metallicity relation relative to observations of low-mass galaxies is likely caused by systematic uncertainties in the SNe Ia delay time distribution, and potentially the yields. The systematic offset ( 0.03 dex) from adopting the solar abundances of, e.g., Asplund et al. (2009), is negligible. Assuming a SNe Ia rate with prompt and delayed components (Mannucci et al., 2006), as opposed to a power-law rate (e.g., Maoz & Graur 2017), can result in a factor 2 reduction in the number of SNe Ia for a fixed stellar population over 10 Gyr, given the same minimum age for the onset of SNe Ia. Adopting a SNe Ia delay time distribution with a larger integrated number of events could therefore sufficiently increase the FIRE mean metallicity (Eq. 4) of simulated dwarf galaxies to result in better agreement with observations. Conclusively resolving this discrepancy is beyond the scope of this paper, and will be addressed in future work (Wetzel et al., in prep).
Although the offset between the FIRE stellar mass-metallicity relation and observations is 0.3 dex for low-mass (M∗ 109 M⊙) galaxies, it only impacts the metallicity normalization, as opposed to comparisons of the overall MDF shape, the width of the MDF, and the intrinsic scatter in [/Fe] vs. [Fe/H]. In what follows, [Fe/H] refers to the Eq. 4 definition.
3.2 Narrowing Effect of Turbulent Metal Diffusion
| Galaxy | D (kpc)a | (M∗/M⊙)b | [Fe/H]c (dex) | d (dex) | e |
| MW dSphs | |||||
| Canes Venatici I | 217 23 | 5.48 0.09 | 1.91 | 0.44 (0.39) | 151 |
| Draco | 75 5 | 5.51 0.10 | 1.98 | 0.42 (0.35) | 333 |
| Ursa Minor | 75 3 | 5.73 0.20 | 2.13 | 0.43 (0.34) | 670 |
| Sextans | 85 3 | 5.84 0.20 | 1.94 | 0.47 (0.38) | 96 |
| Leo II | 233 13 | 6.07 0.13 | 1.63 | 0.40 (0.36) | 256 |
| Sculptor | 85 4 | 6.59 0.21 | 1.68 | 0.46 (0.44) | 365 |
| Leo I | 253 15 | 6.69 0.13 | 1.45 | 0.32 (0.28) | 774 |
| Fornax | 147 9 | 7.39 0.14 | 1.04 | 0.33 (0.29) | 665 |
| dIrrs | |||||
| Leo A | 787 29 | 6.47 0.09 | 1.58 | 0.42 (0.36) | 146 |
| Peg dIrr | 920 29 | 6.82 0.08 | 1.39 | 0.56 (0.54) | 99 |
| NGC 6822 | 459 8 | 7.92 0.09 | 1.05 | 0.49 (0.47) | 298 |
| IC 1613 | 758 4 | 8.01 0.06 | 1.19 | 0.37 (0.32) | 132 |
Compared to simulations without sub-grid diffusion, we observe a narrowing of the characteristic width of the MDF when including sub-grid diffusion666We acknowledge the potential of run-to-run variations in stellar mass and SFH due to stochasticity caused by random system perturbations (Su et al., 2017). Any individual detailed feature in the MDFs could be due to stochastic fluctuations, but general MDF properties such as the reduction of the MDF width and behaviour at the tails are retained in statistical populations of simulated dwarf galaxies (§ 5). Stochastic effects are generally small in magnitude compared to the magnitude of systematic effects we observe in the MDF and -element abundance ratio distributions. (Figure 2). For m10q, the standard deviation of the MDF is reduced from 0.55 dex to 0.41 dex (a factor of 1.4), whereas for m10v it is reduced from 0.52 dex to 0.34 dex (a factor of 1.5, Table 1). This is in better agreement with the MDF width for a majority of the LG dwarf galaxies (Table 2), particularly for those within the mass range spanned by the simulations.
Although this narrowing effect of the MDF when including diffusion may initially seem counterintuitive, it is in accordance with expectations, given that individual particles are being driven toward the average metallicity as a result of sub-grid mixing. Star particles are no longer born on the low-metallicity tail of the distribution ([Fe/H] 3 dex), which corresponds to extreme, improbably low metallicities, or the high-metallicity tail ([Fe/H] 0.5 dex), which corresponds to metallicities that are not observed in most LG dwarf galaxies.
The Milky-Way mass FIRE simulation m12i (§5) (Wetzel et al., 2016) (M∗ 6.5 1010 M⊙), including sub-grid metal diffusion, also exhibits a narrowing of the MDF. Considering that the effects of metal mixing microphysics on galaxy dynamics, as well as other global galaxy properties, are negligible (Su et al., 2017), our results are likely applicable to dwarf galaxy simulations within a broad mass range.
3.3 Comparison to Observed MDFs
Next, we investigate whether the narrowed theoretical MDFs are in better agreement with observations via comparison to those of MW satellite dwarf spheroidal (dSph) galaxies and LG isolated dwarf irregular (dIrr) galaxies (Table 2), for which we have metallicity measurements of red giants per galaxy (Kirby et al., 2010; Kirby et al., 2013).777We do not anticipate any bias due to “mass-weighting” of red giants (M∗ 0.8 M⊙) in the mean metallicity or MDF for dSphs, which have uniformly old stellar populations. However, dIrrs contain intermediate age stellar populations, with higher metallicity and longer lifetimes on the red giant branch. For this reason, the mean metallicity of dIrrs may be slightly biased toward higher metallicity, and the MDF width may also be affected (Kirby et al., 2017; Manning & Cole, 2017)
To determine the similarity between the observed and simulated MDFs, we quantify the likelihood that the observed stars could have been drawn from the simulated MDF. The log-likelihood is given by ,
| (6) |
| (7) |
where is the number of measurements for a given observed dwarf galaxy, corresponds to an individual measurement (i.e. red giant), is the number of star particles in a given simulation, and corresponds to an individual star particle. ([Fe/H]) is the observed measurement uncertainty in metallicity, and ([Fe/H]) is a delta function for a star particle with a given metallicity.
We approximate the probability distribution for the theoretical metallicity as a sum of a delta functions with no associated error. When computing the likelihood between each pair of simulated and observed galaxies, we exclude measurements with [Fe/H] 0.5 dex from the observational data and [Fe/H] 3 dex from both the observational and simulated data sets. At such low metallicity, it is more likely for the metal content of star particles to be dominated by a single SN event in the simulations. It is also possible for the star particles to be dominated by relics of Population III stars, owing to the initialization of particles at [Fe/H] = 4 in the absence of explicit modelling of the transition to Population II stars. The fraction of stars in the relevant stellar mass range for dwarf galaxies (106 M⊙ M∗ 108 M⊙) with [Fe/H] 3 is 4.5% for the high-resolution simulations, such that it impacts the detailed shape of the low-metallicity tail of the distribution, as opposed to the MDF width. Thus, we exclude the potentially unphysical, extremely metal-poor stars present in the simulations that are not seen in observational data.
Figure 3 shows the results of the likelihood estimation method of comparison, where the theoretical MDFs are mass-weighted and smoothed to reproduce the effects of observational uncertainty. As an example, we consider the highest likelihood case for each simulated dwarf galaxy, where we compared to 12 LG dwarf galaxies with a variety of stellar masses and SFHs. We emphasize that the effects of including TMD, in relation to observations as discussed below, are generalizable to average populations of simulated dwarf galaxies (§ 5).
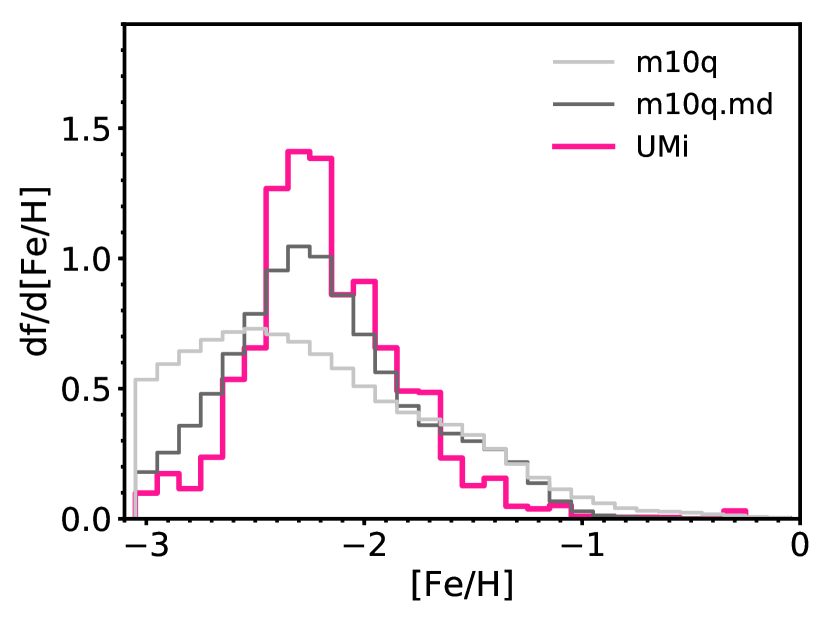
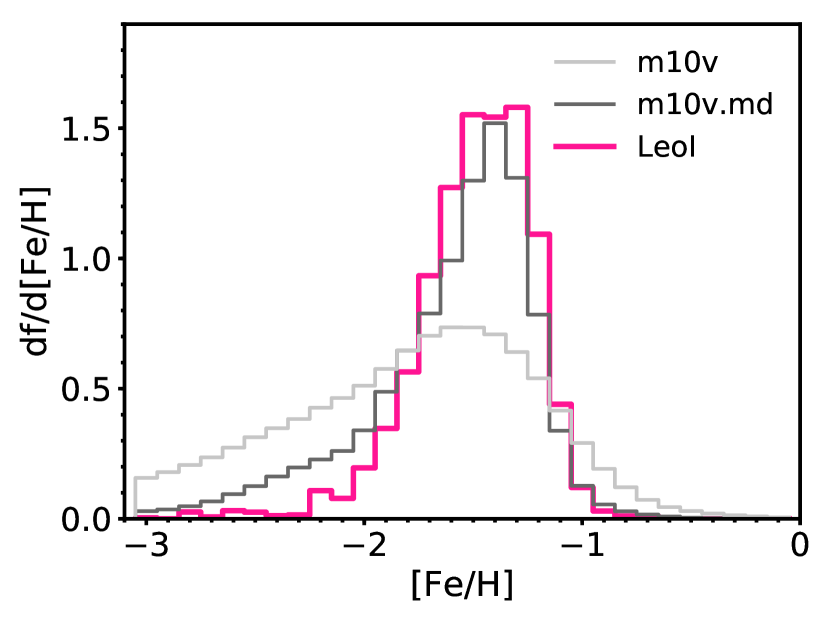
MW dSphs Ursa Minor (UMi) and Leo I (M∗ 5.4 105 M⊙ and 4.9 106 M⊙ respectively; Woo et al. 2008) have the most statistically similar MDFs, according to Eq. 7, as compared to both simulations m10q/m10q.md and m10v/m10v.md respectively.888In the case of Ursa Minor and m10q, we observe a 0.6 dex discrepancy between the simulated and observed galaxy stellar masses for similar mean metallicity. This results in an offset in the FIRE stellar mass-metallicity relation relative to observations. This offset is likely a consequence of our choice of Type Ia SNe delay time distribution, as discussed in § 3.1. We emphasize that the offset in the FIRE stellar mass-metallicity relation at low stellar masses does not alter any of our conclusions regarding the MDF shape, or scatter in [/Fe] at fixed [Fe/H] (§ 4.1). The m10q.md/UMi and m10v.md/Leo I pairs also have the highest average999The average log-likelihood is defined as , where is the number of measurements for a given observed dwarf galaxy. estimates the expected log-likelihood of a single observation, given the “model” simulation. This estimator enables comparisons between different sample sizes, i.e., different LG dwarf galaxies, for a given simulation. likelihoods compared to all m10q/LG dwarf galaxy and m10v/LG dwarf galaxy pairs. The m10q/UMi pair has the highest probability of all LG dwarf galaxies of being drawn from that particular simulation. For m10v, comparisons to Leo II and Leo I yield similar likelihoods, such that one simulation is not strongly favoured over the other. In the following discussion, we compare m10v to Leo I given that it is strongly favoured by m10v.md.
Each highest-likelihood pair of simulated and observed dwarf galaxies have similarly shaped SFHs (Weisz et al., 2014), dominated by either an early burst of star formation (m10q.md/UMi) or rising late time star formation (m10v.md/Leo I). For m10q vs. UMi, = 437, whereas for m10q.md vs. UMi, = 343. For m10v vs. Leo I, = 425, whereas for m10v.md vs. Leo I, = 129. It is clear both from the increase in the values of between cases with and without TMD and Figure 3 that TMD improves the ability of the simulations to match observations in terms of MDF shape. In general, the observed MDFs are narrower than the simulated MDFs without TMD (Table 1, 2). The ability of TMD to reproduce this effect results in the increased likelihood.
With the introduction of metal diffusion, it becomes possible to construct simulated and observed MDFs that are nearly indistinguishable. For both m10q.md and m10v.md, however, the simulations have a larger population of stars at low-metallicity as compared to observations. The lack of stars at the low-metallicity tail of the observed MDF may be caused by selection effects. Observational bias, which does not significantly affect the mean metallicity, may result in the preferential exclusion of rare, extremely metal-poor stars that tend to inhabit galaxy outskirts. These stars also may have been tidally stripped, now absent from satellite dwarf galaxy stellar populations. However, this only impacts the detailed shape of the metal-poor portion of the MDF (Kirby et al., 2013).
Nonetheless, the tails of the distribution are significantly reduced compared to the case without sub-grid metal mixing (Figure 3). The mean metallicities of the distributions approximately coincide, although we note the offset in the normalization of the mean metallicity (§ 3.1). Most significantly, the shapes of the distributions in terms of skewness and kurtosis are consistent with TMD runs, but inconsistent with non-TMD runs. This indicates that metal diffusion may be necessary to bring theoretical predictions into agreement with observations in realistic simulations of the formation and evolution of low-mass galaxies.
Although we have thus far considered only field galaxy simulations, they most resemble the classical dSphs in the sample, as opposed to LG dIrrs such as NGC 6822 and IC 1613, or even more massive dSphs such as Fornax. This is due to the limited mass sampling of our isolated dwarf galaxy simulations, which have masses in the range corresponding to the observed classical dSphs. The likelihood estimation method described above is, to first order, sensitive to mean metallicity, which is dictated by the stellar mass of the galaxy. By including the isolated dwarf galaxies that form in the zoom-in region well beyond the MW-mass host halo in the Latte simulation (§ 5), we expand the current isolated galaxy simulation suite with metal diffusion to contain more massive, metal-rich dwarf galaxies ([Fe/H] 1.4) that may provide better analogues to more massive LG dwarf galaxies.
Overall, it appears that TMD results in a better match to observations. However, it is not immediately clear if metal diffusion is the only process that can narrow the MDF sufficiently to match observed galaxies. Alternatively, environmental effects, such as ram-pressure stripping (Lin & Faber, 1983; Marcolini et al., 2003), may have similar impacts on the appearance of the MDF as sub-grid metal diffusion. We explore this possibility in § 5.1 by analysing simulated dwarf galaxies from the Latte simulation (Wetzel et al., 2016).
4 Alpha Element Distributions
4.1 Narrowing of the Alpha-Element Abundance Ratio Distributions
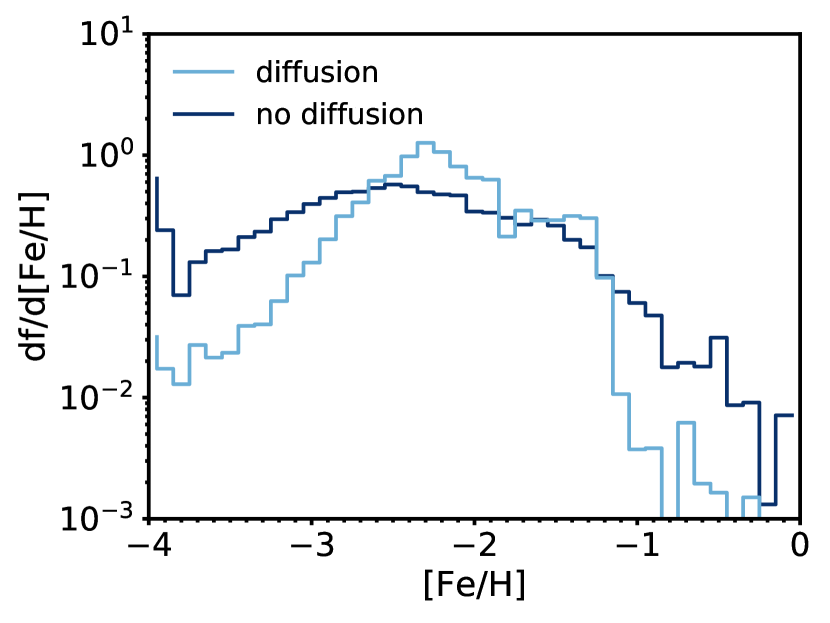
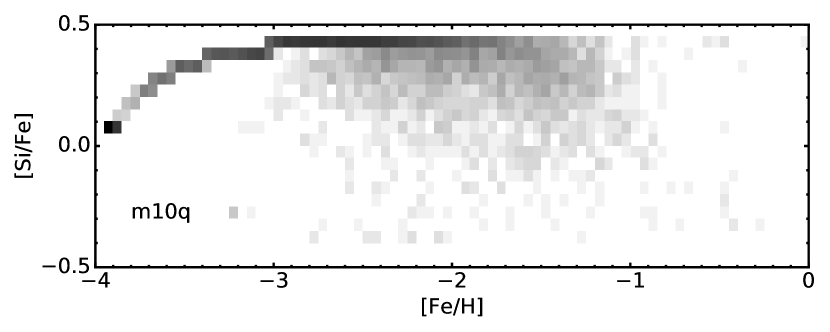
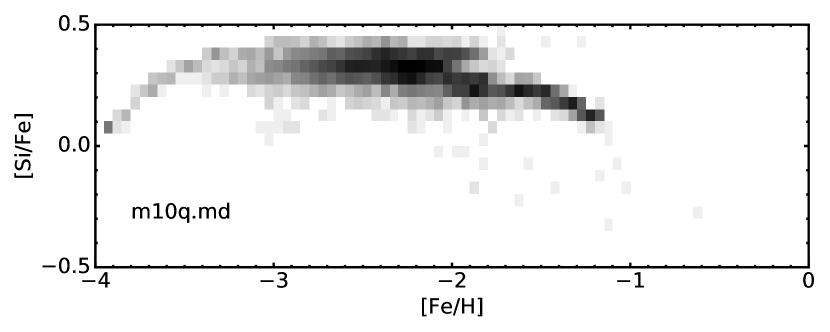
Here, we represent the scatter in [/Fe] using [Si/Fe] as a proxy, owing to the lack of a theoretical analogue to measurements of -enhancement (§ 4.3). Figure 4 illustrates that, for the simulations, we observe the same reduction in scatter as in the MDF width for the -element abundance ratio distributions. There is also an apparent reduction in the envelopes corresponding to enrichment events of a single type. The envelopes originate from the initialization of the star particles at [Fe/H] = 4 and [/Fe] = 0, where enrichment by only Type II (Type Ia) SNe results in the upper (lower) envelope. The faint lower envelope disappears entirely with the inclusion of TMD. Sub-grid metal mixing reduces the probability that any given progenitor gas particle, where the star particle inherits the gas particles’ metallicity, will only contain elements yielded from a single type of enrichment event.
In an analogous fashion to the MDF widths, we quantify the reduction in dispersion in the -element abundance ratio distributions caused by sub-grid turbulent metal diffusion. The intrinsic scatter in [/Fe] as a function of [Fe/H] has physical implications for metal mixing and chemical evolution. [Fe/H] correlates with stellar age, and so can be used as a proxy for time. Thus, a quantification of the intrinsic scatter in -enhancement contains information about the homogeneity of the ISM on typical galaxy evolution timescales.
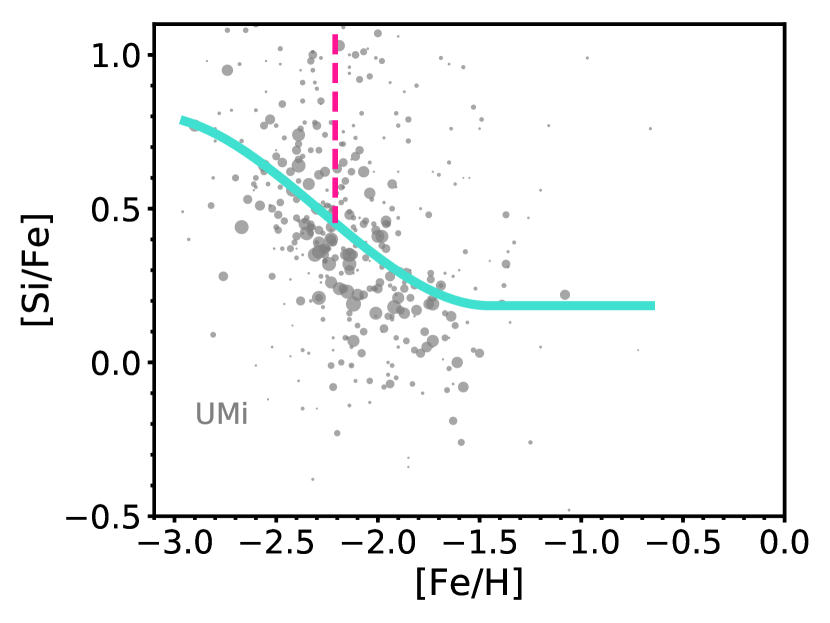
We analyse the intrinsic scatter, , in the -element abundance ratios as a function of metallicity for the simulations with and without sub-grid metal diffusion. We calculate by fitting a cubic spline (error-weighted for observations) in the range 3 [Fe/H] 0.5 to the abundance ratios as a function of metallicity for both the simulated and observed LG dwarf galaxies. We assume that [Si/Fe] either remains constant or monotonically decreases with [Fe/H]. To calculate the intrinsic scatter at fixed [Fe/H], we first determine the distance in [Si/Fe] from the curve for each data point (Figure 5). The distribution of distances provides a standard deviation, which is the intrinsic scatter for the simulated data. Table 3 contains the results for the simulations.
The scatter for m10q reduces from = 0.14 dex to 0.06 dex with sub-grid diffusion, whereas for m10v, which is dominated by late-time star formation, = 0.13 to 0.03 dex. This corresponds to a reduction in the width by a factor of 1.2 and 1.3 respectively, which is comparable to the narrowing factor of the MDF width (§ 3.2). The near zero value of in the case of TMD implies that metals in the cool gas of the ISM are well-mixed at any given [Fe/H], or time in the galaxy’s evolutionary history. We show this explicitly for the simulations in § 4.2.
4.2 The Intrinsic Scatter at Fixed Time
To identify the origin of the low intrinsic scatter in -elements at = 0 in the simulations, we calculate the scatter at a fixed time in a galaxy’s history. Using the formation times of star particles in the galaxy (within ; Table 1) at , we determine the dispersion in [Si/Fe], [Si/H], and [Fe/H] of star particles formed in 100 Myr time bins, a timescale comparable to the typical dynamical time of dwarf galaxies.
We base our analysis on = 0 star particles partly because it is analogous to observational methods. Additionally, we expect a negligible contribution from mergers to the stellar population in dwarf galaxies. As a check, we followed the evolution of simulated dwarf galaxy progenitors to high-redshift. Using a definition of in-situ formation within 10 kpc of the galactic centre, we found that 98% of star particles present in the galaxy at formed in-situ. Anglés-Alcázar et al. (2017) and Fitts et al., in prep. similarly found in a detailed study that ex-situ star formation contributes negligibly to the stellar mass growth of isolated dwarf galaxies. In principle, all star particles from these mergers could form a distinct [Si/Fe] vs. [Fe/H] track. In this way, all star particles brought in by mergers could contribute to, or even dominate the outliers of, the scatter in abundances at a given age. Despite this, we assume that a significant majority of stars present in simulated dwarf galaxies at formed in-situ, with a negligible contribution from mergers.
Figure 6 illustrates the scatter in [Si/Fe], presented as a standard deviation, ([Si/Fe]), with respect to lookback time for FIRE isolated dwarfs with and without sub-grid metal diffusion. We describe the scatter in terms of [Si/Fe] for consistency with the intrinsic scatter calculation (§ 4.1). We overplot the star formation rates, where m10q/m10q.md have SFHs dominated by early bursts, whereas late-time star formation dominates in m10v/m10v.md. The scatter in [Si/Fe] as a function of age clearly reduces with the inclusion of TMD. At any given time, the typical scatter in all quantities ([Si/Fe], as well as [Si/H] and [Fe/H]) ranges from 0.05 - 0.1 dex. The trend between scatter and age is characterized by mostly near-zero scatter, punctuated by periods of a relatively high rate of star formation that cause the ISM to become inhomogeneous and increase the scatter. We conclude that most of the scatter in [Si/Fe] (and [Si/H] and [Fe/H] by extension) at fixed time results from starbursts. However, the persistent near-zero scatter in the abundances of newly formed stars across cosmic time implies that most of the scatter present in stellar abundance distributions at is caused by time evolution, as opposed to significant scatter in the abundances of newly formed stars at any fixed time.
The fact that [Si/Fe] shows small scatter at any given time, where the naive expectation is that it should depend on both [Si/H] and [Fe/H], implies that Si enrichment correlates strongly with Fe enrichment. This is likely a result of the Type Ia and II yields (Iwamoto et al., 1999; Nomoto et al., 2006) and SN rates (Mannucci et al., 2006; Leitherer et al., 1999) employed in FIRE. Type Ia SNe produce a Fe yield an order of magnitude larger than that of Type II SNe, whereas the total Si yield integrated over several Gyr differs only by a factor of 2 between the SNe II and Ia. The cumulative number of core-collapse events per star particle at ages of 100 Myr - 1 Gyr (corresponding to the delay time of Ias in FIRE; Hopkins et al. 2017) is 10 - 20 times larger than the integral number of SNe Ia explosions. As a consequence, the total amount of Fe produced is comparable between SNe II and Ia channels, whereas core-collapse singly dominates Si production. Thus the correlation between Si and Fe enrichment.
We thus conclude that (1) the most likely value of the intrinsic scatter in the abundances of stars forming at any given time across a simulated galaxy’s evolutionary history is near-zero, (2) deviations from near-zero scatter at a given time result from starbursts, and (3) Si enrichment correlates strongly with Fe enrichment in FIRE. The ISM is well-mixed at all times in the simulations when taking into account TMD, excepting brief starburst periods. If the intrinsic scatter in [Si/Fe] vs. [Fe/H], where [Fe/H] approximates age, is also small for observations of LG dwarf galaxies, then observed dwarf galaxies have a nearly homogeneous ISM at a given time.
4.3 Observational Intrinsic Scatter
To determine if TMD produces results consistent with observations, we calculate the observational intrinsic (error-corrected) scatter. Despite having measured [/Fe] directly using spectral synthesis, simultaneously fitting all -element lines present in the spectra, we choose to represent the intrinsic scatter in the observations by a single -element. This is a consequence of the difficulty in interpreting a fit based on multiple chemical species and constructing a theoretical abundance ratio counterpart. [Mg/Fe] tends to have large uncertainties, resulting in fewer data points and a less precise determination of the scatter. Although [Ca/Fe] can be measured with higher precision, the theoretical [Ca/Fe] abundances do not agree with simulations for very low metallicity (§ 4.4). Thus, we adopt [Si/Fe] as a proxy for determining the intrinsic dispersion in -elements as a function of [Fe/H].
In the following calculation, we only consider the measurement uncertainty in [Si/Fe], as opposed to simultaneously taking into account the uncertainty in [Fe/H], [Fe/H]. In comparison to the range of the data and the scales over which the slope of the relationship between [Si/Fe] and [Fe/H] varies, [Fe/H] is insignificant. The typical value of d[Si/Fe]/d[Fe/H] varies between 0.1 - 0.2 and 0.2 - 0.8 for the simulations and observations respectively, which corresponds to a variation in [Si/Fe] of 0.01 - 0.02 and 0.02 - 0.08 dex for a typical [Fe/H] 0.1 dex. This is small compared to the variation in [Si/Fe] given a typical [Si/Fe] of 0.2 dex. We therefore conclude that the impact on our calculation of the intrinsic scatter owing to measurement uncertainty in [Fe/H] is negligible, such that the uncertainty in [Fe/H] can be reasonably neglected.
For the observational case, we first calculate , the variance of the distribution of distances for each galaxy (Figure 5), normalizing to the measurement uncertainty, i.e.,
| (8) |
where is the index for a given red giant with measurements of both [Fe/H] and [Si/Fe], [Si/Fe] is the measurement uncertainty in [Si/Fe], and is the intrinsic scatter in [Si/Fe] at fixed [Fe/H]. Eq. 8 follows a reduced chi-squared distribution with an expectation value of unity. We first calculate assuming zero intrinsic scatter, then enforce the condition = 1 to numerically solve for the most likely value of the intrinsic component, .
We calculate the uncertainty of each measurement of using an unbiased estimator for the standard deviation of the sample variance,
| (9) |
Eq. 9 is dependent on the number of [Si/Fe] measurements, , available for each dwarf galaxy, where in general < (Table 2). We then use to numerically solve for the corresponding upper and lower limits on . We present our results for observations in Table 3.
If = 1, = 0, whereas if 1, the most likely value of cannot be properly determined. As long as , we cannot reliably constrain the lower limit for , as in the case for Draco, Fornax, and Sculptor. In these cases, is consistent with zero within one standard deviation. However, we still present the most likely range of for these dwarf galaxies in Table 3. Even if , not all values have both upper and lower limits, given the functional relationship between and . If , as in the case of Peg dIrr, overestimated observational errors result in the lack of a well-determined .
Accordingly, the intrinsic scatter is highly dependent on the magnitude of [Si/Fe]. If [Si/Fe] is increased (decreased), decreases (increases). Thus, the measurement uncertainty in [Si/Fe] must be both accurate and precise to produce a reliable estimate of the intrinsic scatter. The uncertainties of the -enhancement of the observed dwarf galaxies, determined using the Kirby et al. (2008) method of spectral synthesis of medium-resolution spectroscopy, have been validated in terms of both precision and accuracy. Kirby et al. (2008) showed that errors in [/Fe] determined from medium-resolution spectroscopy remain below 0.25 dex for spectra with sufficiently high signal-to-noise ( 20 Å). Based on duplicate observations of red giants in dwarf galaxies and the comparison to measurements of error on [/Fe] from high-resolution spectroscopy, Kirby et al. (2010) showed that the estimated uncertainties on -element abundance ratios are accurate, and that the uncertainties have not been underestimated, even on an absolute scale. This indicates that our analysis sets upper limits on the true value of the intrinsic scatter for observed LG dwarf galaxies.
In most cases, we find that the most likely values of range from 0 - 0.1 dex, except Fornax (), with upper limits of 0.1 - 0.17 dex. All values are consistent with zero intrinsic scatter. We do not take into account the sampling bias associated with the observations, which primarily target the central, denser, and more metal-rich regions of the dwarf galaxies (Kirby et al., 2011b). However, the calculations of both the likelihood statistic, (§ 4.4, Eq. 11) and the intrinsic scatter, , take into account the limited observational sample size and observational uncertainties. For the most likely intrinsic scatter (Table 3), larger, non-zero values result from sample size (Eq. 9), excepting Fornax. Assuming that galaxies with larger sample sizes provide a more accurate measurement of the intrinsic scatter, we can conclude that it is near zero for a majority of LG dwarf galaxies.101010We note that medium-resolution spectroscopy data sets necessarily have larger uncertainties than those from high-resolution spectroscopy. Although high-resolution data sets do not contain as many stars, the smaller measurement uncertainties would provide a preferable data set for quantifying the intrinsic scatter. For example, high-resolution data sets for Sculptor (de Boer et al. 2012a, Hill et al., in prep) and Fornax (Letarte et al., 2010; de Boer et al., 2012b) could be used for this purpose.
If the ISM is indeed homogeneous at a given time, then we should find that the intrinsic scatter at a given metallicity is nearly zero (§ 4.2). We conclude that, based on the near zero intrinsic scatter in [Si/Fe] at a given [Fe/H] in both simulated and observational data, including sub-grid turbulent metal diffusion in simulations produces results consistent with observations. Based on this agreement, we infer that the ISM in LG dwarf galaxies is well-mixed, to within the given scatter, throughout a galaxy’s history.
| Galaxy | a (dex) | b (dex) | c (dex) |
|---|---|---|---|
| Simulations | |||
| m10q | 0.144 | ||
| m10q.md | 0.058 | ||
| m10v | 0.127 | ||
| m10v.md | 0.033 | ||
| MW dSphs | |||
| Canes Venatici I | 0.901 | 0.073 | 0.152 |
| Draco | 1.182 | 0.097+0.036 | 0.098 |
| Ursa Minor | 0.989 | 0.061 | 0.069 |
| Sextans | 1.003 | 0.013+0.103 | 0.181 |
| Leo II | 1.061 | 0.060+0.046 | 0.104 |
| Sculptor | 1.173 | 0.078 | 0.079 |
| Leo I | 0.991 | 0.055 | 0.056 |
| Fornax | 1.417 | 0.140 | 0.059 |
| dIrrs | |||
| Leo A | 0.962 | 0.159 | 0.171 |
| Peg dIrr | 0.667 | 0.174 | |
| NGC 6822 | 1.045 | 0.052+0.046 | 0.092 |
| IC 1613 | 1.083 | 0.089+0.082 | 0.160 |
-
•
Note. — All quantities calculated in terms of [Si/Fe] vs. [Fe/H] at = 0. The ranges of represent the most likely values for observational data, although all calculations are consistent with zero.
-
a
The initial calculation of the standard deviation of the differences between the data and the curve (Eq. 8), assuming zero intrinsic scatter.
-
b
The intrinsic scatter, numerically solved for using Eq. 8 such that = 1. Not all values of have both upper and lower limits, owing to limits on the range of the functional relationship between and . In some cases, where 1 (e.g., Ursa Minor), only an upper limit is possible to determine.
-
c
The standard deviation of the sample variance for observational data (Eq. 9).
4.4 Comparisons to Observed Alpha-Element Abundance Patterns
To determine whether the -element abundance ratio distributions with sub-grid metal diffusion improve statistical agreement with observations, we compare the simulations to LG dwarf galaxies. We compute a likelihood estimator, simultaneously using [Fe/H], [Mg/Fe], [Si/Fe], and [Ca/Fe], which are included in both simulated and observed data sets, as constraints.
For each red giant star in a given observed dwarf galaxy that has a measurement for all four abundance ratios, we define a 4D Gaussian per star,
| (10) |
where is an abundance ratio, is the associated error, is the index for the abundance, and is the index for a star. Again, we considered only measurements with errors below 0.5 dex and [Fe/H] 3 dex. The 4D probability distribution for an observed dwarf galaxy with measurements is therefore,
| (11) |
where the prefactor is included such that the integral of the function over 4D space is unity. This can be used to estimate the log-likelihood,
| (12) |
where is the number of star particles in a given simulated galaxy and is the index of each particle. In this case, we cite the average log-likelihood (§ 3.3) to enable comparisons between different simulation/LG dwarf galaxy pairs.
We choose to include calcium abundances in the statistic determination despite a systematic offset in [Ca/Fe] in the simulations relative to observations. The simulation yields for Type II SNe result in a maximum of [Ca/Fe] = 0.1 dex at low metallicity, despite observations indicating that [Ca/Fe] +0.2 - +0.4 dex (Venn et al., 2004; Kirby et al., 2011b). This is likely a consequence of our assumption that there is no strong dependence of the yield on metallicity for [Fe/H] 2 dex in GIZMO. This is in contrast to the predictions of Nomoto et al. (2006), which assumes metallicity dependence of the yields at low [Fe/H].
We computed the likelihoods both with (4D) and without (3D) including calcium in the product in Eq. 10. The results of the likelihood comparison for the abundance ratios do not differ substantially between the 3D (excluding calcium) and 4D cases in terms of the maximum likelihood matches, so we adopt the results from the 4D case, assuming that it includes additional information and subsequently provides a tighter constraint.
The comparison between the pairs of observed and simulated galaxies results in the highest likelihoods (compared to every simulation/LG dwarf galaxy pair) of and for m10q.md/UMi and m10v.md/Leo I respectively. In comparison to the simulations without sub-grid metal diffusion, m10v/UMi and m10q/UMi have the highest likelihoods of . By including TMD, we gain an increase in the statistical likelihood that the simulated and observed galaxies are similar. Thus, we further establish (§ 3.3) that Ursa Minor and Leo I are the most statistically similar dwarf galaxies in our sample to the simulations with metal diffusion, using abundance ratios in addition to MDFs. Including sub-grid diffusion enables galaxy simulations that provide good statistical analogues to observed dwarf galaxies.
5 Environmental Effects
We apply the same methodology outlined in § 3 and § 4 to analyse dwarf galaxy simulations captured in the high resolution regions of the Latte simulations (Wetzel et al., 2016). Latte is run with GIZMO in MFM-mode (Hopkins, 2015) and includes the standard FIRE-2 implementation of gas cooling, star formation, stellar feedback, and metal enrichment as summarized in § 2.1 (Hopkins et al., 2017). We consider the m12i simulations, with baryonic mass resolution of 7070 M⊙ and star particle spatial resolution of 4 pc, run with and without TMD (§ 2.2). The original m12i did not include TMD. We present a version of the simulation, rerun with the same initial conditions and physics, including sub-grid metal diffusion in this paper. We consider (sub)halos uncontaminated by low-resolution dark matter particles in the stellar mass range 5.5 105 M⊙ M∗ 9.9 109 M⊙, where the lower limit is based on our metallicity convergence tests (Hopkins et al., 2017). We define “satellite” and “isolated” dwarf galaxies around the MW-like host (M∗ 6.5 1010 M⊙) by distance, , with 300 kpc and 300 kpc 1 Mpc respectively, considering only simulated dwarf galaxies within the distance range of the observed LG dwarf galaxies (Table 2). Using these criteria, we identify 10 satellite and 3 isolated dwarf galaxies for m12i with M∗ 7 105 - 2 108 M⊙, covering a majority of the mass range spanned by the observed dwarf galaxies.
The Latte m12i simulation with TMD (m12i.md) is statistically consistent with the satellite mass function and the stellar 1D velocity dispersion of m12i without TMD (Wetzel et al., 2016). m12i.md similarly falls between the mass functions for the Milky Way and M31 (excluding the LMC, M33, and Sagittarius). Although m12i.md produces fewer satellites at M∗ 106 M⊙, this likely arises because of stochasticity in when satellites are disrupted by the host (Garrison-Kimmel et al., 2017): the mass functions of isolated dwarf galaxies (d 300 kpc), which are not affected by disruption, are nearly identical. Qualitatively, the stellar mass-metallicity relation between runs is in broad agreement, where the simulated dwarf galaxies agree with observations for M∗ 106 M⊙ for a definition of the mean metallicity based on average mass fractions (§ 3.1). This is consistent with our previous results, where including TMD narrows the scatter in the metallicity distribution, but does not significantly change the galaxy-averaged mean metallicity.
5.1 Satellite and Isolated MDFs
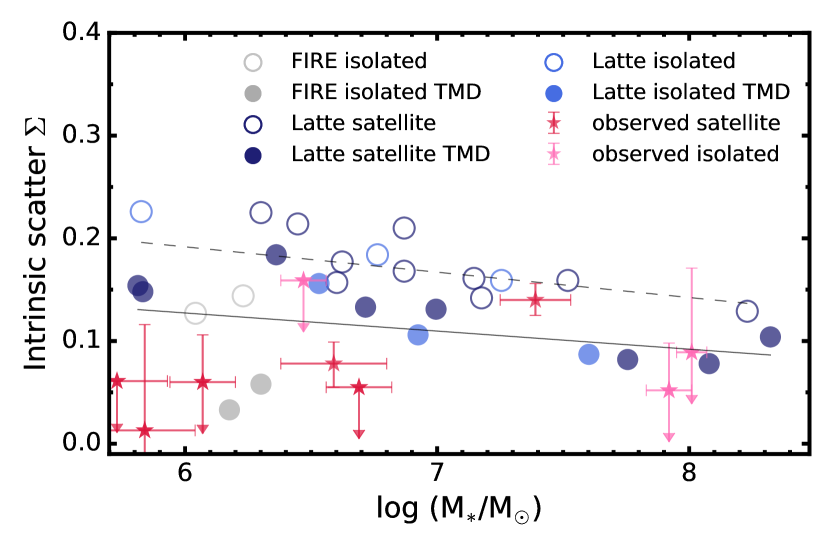
Including TMD, we observe the same narrowing effect in the widths of the MDFs for the Latte satellite and isolated dwarf galaxies as in the isolated FIRE dwarf galaxies. Figure 7 shows the average MDF for dwarf galaxies with M∗ 106 M⊙, excluding and including TMD. We show the MDFs for both satellite and isolated dwarf galaxy populations, where we normalize each individual dwarf galaxy MDF to its mean metallicity before averaging. The reduction in the width of the MDF is apparent, narrowing from 0.50 dex to 0.42 dex (a factor of 1.2) on average for combined satellite and isolated galaxy populations. This agrees with our higher-resolution isolated dwarf galaxy simulations in § 3.2.
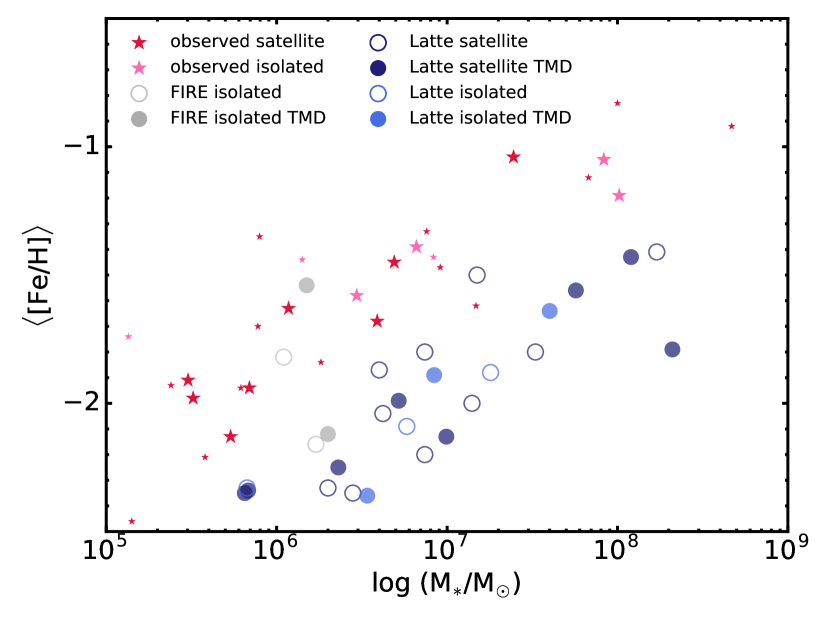
Figure 8 shows the MDF width, as a function of stellar mass, for all simulated and observed data sets. As also illustrated in Figure 7, the Latte dwarf galaxies with TMD have narrower MDF widths on average. The values for the Latte dwarfs are consistent with those from the FIRE isolated dwarfs, albeit potentially exhibiting more scatter. Figure 8 emphasizes that the simulations with TMD show reasonable agreement with observational, error-corrected MDF widths (Table 2), as opposed to runs without TMD. This is especially true for satellite dwarf galaxies. No apparent trend between MDF width and stellar mass exists for both simulated and observed dwarf galaxies. This implies that factors other than stellar mass, such as the star formation history, dictate the MDF width. In addition, it suggests that the MDF width converges in the simulations (Appendix E), since there is no mass-dependent behavior that may result from secondary resolution effects (§ 5.2).
For the simulations, both Figures 7 and 8 do not show any systematic differences between MDF width for satellite versus isolated galaxies. The differences between the average individual MDF widths (mass-weighted and un-smoothed) across the entire stellar mass range of simulated satellite (0.51 to 0.43 dex, or a factor of 1.2) and isolated (0.47 dex to 0.39 dex, or a factor of 1.2) galaxies without and with TMD are comparable. For both m12i with and without TMD, the average MDF width of isolated dwarf galaxies is narrower than the corresponding average for satellite dwarf galaxies for M∗ 106 M⊙ and 1 Mpc. Within these constraints, there are only a few isolated dwarf galaxies in each run of m12i, as compared to the more numerous satellite dwarf galaxies. Expanding the sample size by incorporating a couple of uncontaminated isolated dwarf galaxies (dhost > 1 Mpc and 107 M⊙ M∗ 109 M⊙) from the m12i simulated volume brings the average individual MDF width of isolated dwarf galaxies up to 0.50 dex and 0.42 dex, without and with TMD respectively. Thus, the average individual MDF widths between the simulated satellite and isolated dwarf galaxies are similar.
By including sub-grid metal diffusion, the average simulated MDF widths better approximate the averages of the error-corrected MDF width of individual observed galaxies (Table 2 across the entire stellar mass range for each galaxy population. The observed average satellite MDF width is 0.35 dex, whereas the observed average isolated MDF width is 0.42 dex, in comparison to 0.43 dex and 0.42 dex respectively for m12i.md. The observed average satellite MDF width is 80% that of the observed isolated galaxies, at odds with predictions from our simulations.
Figure 7 shows the analogous observational average MDFs, separated according to satellite and isolated dwarf galaxy populations. In contrast to the simulations, the average satellite MDF is more sharply peaked and narrow (0.41 dex) than the broader average isolated MDF (0.46 dex), including scatter due to observational uncertainty. Kirby et al. (2013) found a less than 0.02 % likelihood that the distributions originate from the same parent distribution, attributing the disparity to differences between star formation histories (truncated vs. extended) for satellite and isolated dwarf galaxies (Mateo, 1998; Orban et al., 2008; Weisz et al., 2014). Despite the similarity of the simulated satellite and isolated MDFs, both the Latte simulations and observations show no systematic difference in [Fe/H] at a given stellar mass for satellite and isolated dwarf galaxies. Further investigation of this discrepancy, such as quantifying impact of observational bias, is beyond the scope of this paper.
However, the similarity between satellite and isolated galaxy MDFs for the same stellar mass range in the simulations indicates that TMD ultimately produces better agreement with observations. The alternate hypothesis, in which TMD mimics the impact of environmental effects (§ 3.3), such as ram-pressure stripping, on the appearance of satellite MDFs, is thus excluded for the FIRE simulations. This is further supported by a likelihood estimation comparison between the observed MDFs and the Latte simulations, in which the most similar simulated galaxies to observations were dictated solely by MDF shape, i.e., stellar mass range and star formation history, as opposed to any innate separation between isolated and dwarf galaxy MDFs. In general, the simulation suite including TMD provides better matches to the observed MDF shapes compared the case without TMD.
Figure 7 illustrates that TMD ultimately better reproduces the narrowness of the observed MDFs, the truncation of stars at high metallicity, and the skew toward high metallicity. We do not observe the latter effect in the average (or any individual) MDFs for the Latte simulations without sub-grid diffusion, for both isolated and satellite galaxies. The characteristic cutoff at high metallicity in MDFs can be attributed to ram-pressure stripping and the subsequent quenching of star formation (Bosler et al., 2007). Despite this, we see similar cutoffs at high metallicity for both satellite and isolated galaxies, where isolated galaxies remain star-forming to = 0. It is unclear to what extent the cutoff is driven by environmental effects versus internal chemical evolution. Nonetheless, the cutoff appears in the simulations for M∗ 107 M⊙ only in the case of sub-grid metal mixing. This suggests that turbulent metal diffusion is the primary source of agreement between simulations and observations, in contrast to any significant role played by interaction with the host galaxy in the simulations.
5.2 Intrinsic Scatter in the Latte Simulations
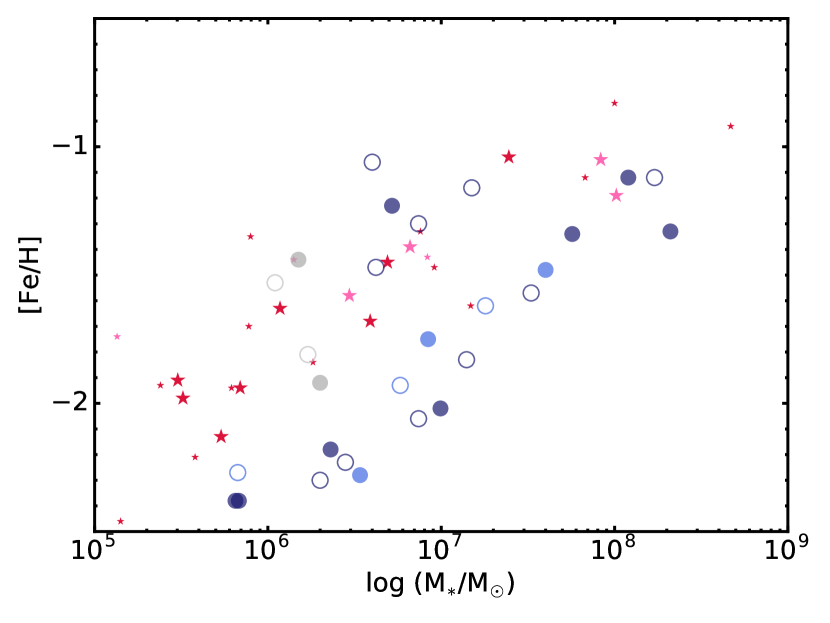
We calculate the intrinsic scatter for Latte dwarf galaxies, with and without TMD. The average reduction in the intrinsic scatter for galaxies with M∗ 106 M⊙ is from 0.16 to 0.12 dex, or a factor of 1.1. This is comparable to the reduction in the width of the MDF and the average reduction factor for the FIRE isolated dwarfs ( 1.2). However, the reduction in intrinsic scatter including TMD at a given stellar mass is less pronounced (Figure 9) in the lower-resolution Latte simulations, as compared to the higher-resolution isolated FIRE dwarf galaxies. In addition, the Latte dwarf galaxies have larger intrinsic scatter overall as compared to the FIRE isolated dwarf galaxies at M∗ 106.5 M⊙.
This is likely caused by secondary resolution effects (Appendix E). Numerically enhanced burstiness (Hopkins et al., 2017) results in stronger periods of inhomogeneity for the less well-resolved low-mass (M∗ 106.5 M⊙) Latte dwarf galaxies. By definition, the intrinsic scatter is more sensitive to inhomogeneities than the MDF width, which is more sensitive to the long-term star formation history, artificially increasing the dispersion in the -element abundances at fixed metallicity. For this reason, low-mass Latte dwarf galaxies do not agree with most observations of the MW dSphs with near-zero intrinsic scatter ( 0.1 dex), which have more reliable measurements of -enhancement than LG dIrrs (Figure 9). The impact of turbulent metal diffusion is more important for higher-resolution simulations, in which the effects of numerical noise become more pronounced (Appendix A, B), in terms of bringing simulations of dwarf galaxies into agreement with observations.
6 Summary & Discussion
We have examined the metallicity distribution functions and enrichment histories, including [Fe/H] -element abundances, of dwarf galaxies using the FIRE-2 cosmological simulations of dwarf galaxies, to investigate the chemical enrichment histories of dwarf galaxies. We have shown that turbulent metal diffusion, at levels suggested by converged simulations, is necessary to include in Lagrangian, hydrodynamical simulations of the formation and evolution of dwarf galaxies to obtain realistic predictions of chemical evolution.
Contrary to a majority past studies of the chemical properties of simulated dwarf galaxies, we have successfully modelled full abundance distributions, in addition to global properties such as the stellar mass-metallicity relation. As a caveat, we note the presence of an offset in the normalization of our stellar mass-metallicity relation compared with observations of low-mass dwarf galaxies. This is likely caused by systematic effects, such as our choice of the Type Ia SNe delay time distribution. However, this does not impact properties such as the MDF width and the intrinsic scatter in [/Fe] at fixed [Fe/H].
Through statistical comparison of FIRE simulations to observations of LG dwarf galaxies, we have demonstrated that simulations including TMD are in agreement with the width of the MDF and the intrinsic scatter in [/Fe] vs. [Fe/H]. For both the MDF and the -element abundance ratios, a reduction in the scatter occurs compared to simulations without TMD, as well as a reduction in numerical artifacts such as star particles with [Fe/H] 3 and envelopes corresponding to Type Ia/Type II SNe yields.
The same effects are present in both satellite and isolated dwarf galaxies from the Latte simulation, albeit the reduction in [/Fe] vs. [Fe/H] scatter is subdued owing to resolution effects. Most significantly, we find that a distinction between satellite and isolated dwarf galaxies does not factor into our conclusions on the agreement between simulations and observations in terms of the shape and width of the MDF and dispersion in the -element abundance ratio distributions. Just as simulated and isolated dwarf galaxies are similar in these quantities, all dwarf galaxies, both observed and simulated, lie on the same stellar mass-metallicity relation regardless of environment or star formation history (Skillman et al., 1989; Kirby et al., 2013). In addition, both satellite and isolated dwarf galaxies primarily form as dispersion-dominated systems regardless of current proximity to the host (Wheeler et al., 2017; Kirby et al., 2017). This also poses a challenge to the traditional separation between dwarf galaxy populations. Our work suggests that galactic chemical evolution depends predominantly on the stellar mass of dwarf galaxies.
We analyse realistic galaxy evolution and formation simulations, taking into account a multi-phase ISM, explicit stellar feedback, and the impact of cosmological accretion. Our analysis serves as a robust confirmation of previous work done in the case of idealized, non-cosmological simulations. We have illustrated that a sub-grid turbulent diffusion model, owing to the physically-motivated nature of the implementation and its ability to match observations, is a valid alternative to methods such as a smoothed-metallicity scheme (Wiersma et al., 2009; Revaz et al., 2016). Similar to Williamson et al. (2016), we find that the strength of mixing due to turbulent diffusion is stable against variations in the diffusion coefficient within an order of magnitude above a minimum diffusion strength (Appendix D).
In addition, for the first time, we have presented an explicit calculation of the intrinsic scatter from medium-resolution spectroscopy of 12 LG dwarf galaxies. Previous studies of metal poor Galactic stars (Carretta et al., 2002; Cayrel et al., 2004; Arnone et al., 2005) similarly found near-zero intrinsic scatter for -elements at fixed metallicity. Based on -element abundance ratios (see Hirai & Saitoh 2017 for an analysis based on barium abundances), we conclude that the timescale for metal mixing is shorter than the typical dynamical timescale for dwarf galaxies. This is evidenced by the homogeneity of the ISM, as implied by the near zero intrinsic scatter for LG dwarf galaxies.
The implication of a well-mixed ISM for one-zone chemical evolution models (e.g., Lanfranchi & Matteucci 2003, 2004, 2007, 2010; Lanfranchi et al. 2006) is that 3D hydrodynamical models (Mori et al., 2002; Revaz et al., 2009; Sawala et al., 2010) may not be necessary to relax the instantaneous mixing approximation, since the cool gas of the ISM becomes homogeneous within approximately a dynamical time for dwarf galaxies. This is in contrast to previous studies (Marcolini et al., 2008) that investigated the effects of inhomogeneous pollution by SNe on chemical properties in 3D hydrodynamical simulations of isolated dSphs. However, Marcolini et al. (2008) did not include a prescription for sub-grid metal mixing, which washes out temporary inhomogeneities in the ISM. Based on our analysis, one-zone approximations in chemical evolution models may be appropriate for dwarf galaxies.
Turbulent metal diffusion is important for accuracy in modelling the ISM as well as processes relevant for chemical evolution. The inclusion or exclusion of TMD will therefore influence predictions drawn from simulated chemical abundances. For example, Bonaca et al. (2017) justified the use of the Latte m12i primary halo as a Milky Way analogue for comparison to data from Gaia Data Release 1 (Gaia Collaboration et al., 2016a, b) using the width of the MDF including TMD. The authors then drew inferences on the hierarchical formation of the Galaxy and its halo structure based on the simulation.
Including turbulent metal diffusion can enable the use of simulations in detailed, chemical abundance based investigations of galaxy formation and evolution.
Acknowledgements
IE would like to thank the anonymous referee, in addition to Shea Garrison-Kimmel, Matthew Orr, and Denise Schmitz, for helpful comments that improved this paper. Numerical calculations were run on the Caltech computing cluster “Zwicky” (NSF MRI award #PHY-0960291) and allocation TG-AST130039 granted by the Extreme Science and Engineering Discovery Environment (XSEDE) supported by the NSF. IE was supported by Caltech funds, in part through the Caltech Earle C. Anthony Fellowship, and a Ford Foundation Predoctoral Fellowship. AW was supported by a Caltech-Carnegie Fellowship, in part through the Moore Center for Theoretical Cosmology and Physics at Caltech, and by NASA through grants HST-GO-14734 and HST-AR-15057 from STScI. ENK was supported by NSF Grant AST-1614081. Support for PFH was provided by an Alfred P. Sloan Research Fellowship, NASA ATP Grant NNX14AH35G, NSF Collaborative Research Grant #1411920, and CAREER grant #1455342. CW was supported by the Lee A. DuBridge Postdoctoral Scholarship in Astrophysics. DK was supported by NSF grant AST-1715101 and the Cottrell Scholar Award from the Research Corporation for Science Advancement. CAFG was supported by NSF through grants AST-1412836 and AST-1517491, by NASA through grant NNX15AB22G, and by STScI through grant HST-AR-14293.001-A. EQ was supported in part by a Simons Investigator Award from the Simons Foundation and NSF grant AST-1715070.
References
- Agertz et al. (2007) Agertz O., et al., 2007, MNRAS, 380, 963
- Aguirre et al. (2005) Aguirre A., Schaye J., Hernquist L., Kay S., Springel V., Theuns T., 2005, ApJ, 620, L13
- Anders & Grevesse (1989) Anders E., Grevesse N., 1989, Geochim. Cosmochim. Acta, 53, 197
- Anglés-Alcázar et al. (2017) Anglés-Alcázar D., Faucher-Giguère C.-A., Kereš D., Hopkins P. F., Quataert E., Murray N., 2017, MNRAS, 470, 4698
- Arnone et al. (2005) Arnone E., Ryan S. G., Argast D., Norris J. E., Beers T. C., 2005, A&A, 430, 507
- Asplund et al. (2009) Asplund M., Grevesse N., Sauval A. J., Scott P., 2009, ARA&A, 47, 481
- Bonaca et al. (2017) Bonaca A., Conroy C., Wetzel A., Hopkins P. F., Kereš D., 2017, ApJ, 845, 101
- Bosler et al. (2007) Bosler T. L., Smecker-Hane T. A., Stetson P. B., 2007, MNRAS, 378, 318
- Brook et al. (2014) Brook C. B., Stinson G., Gibson B. K., Shen S., Macciò A. V., Obreja A., Wadsley J., Quinn T., 2014, MNRAS, 443, 3809
- Carretta et al. (2002) Carretta E., Gratton R., Cohen J. G., Beers T. C., Christlieb N., 2002, AJ, 124, 481
- Cayrel et al. (2004) Cayrel R., et al., 2004, A&A, 416, 1117
- Chan et al. (2015) Chan T. K., Kereš D., Oñorbe J., Hopkins P. F., Muratov A. L., Faucher-Giguère C.-A., Quataert E., 2015, MNRAS, 454, 2981
- Colbrook et al. (2017) Colbrook M. J., Ma X., Hopkins P. F., Squire J., 2017, MNRAS, 467, 2421
- Dekel & Silk (1986) Dekel A., Silk J., 1986, Astrophysical Journal, 303, 39
- El-Badry et al. (2016) El-Badry K., Wetzel A., Geha M., Hopkins P. F., Kereš D., Chan T. K., Faucher-Giguère C.-A., 2016, ApJ, 820, 131
- Faucher-Giguère et al. (2009) Faucher-Giguère C.-A., Lidz A., Zaldarriaga M., Hernquist L., 2009, ApJ, 703, 1416
- Frebel & Norris (2015) Frebel A., Norris J. E., 2015, ARA&A, 53, 631
- Gaia Collaboration et al. (2016a) Gaia Collaboration et al., 2016a, A&A, 595, A1
- Gaia Collaboration et al. (2016b) Gaia Collaboration et al., 2016b, A&A, 595, A2
- Gallazzi et al. (2005) Gallazzi A., Charlot S., Brinchmann J., White S. D. M., Tremonti C. A., 2005, MNRAS, 362, 41
- Garrison-Kimmel et al. (2017) Garrison-Kimmel S., Bullock J. S., Boylan-Kolchin M., Bardwell E., 2017, MNRAS, 464, 3108
- Greif et al. (2009) Greif T. H., Glover S. C. O., Bromm V., Klessen R. S., 2009, MNRAS, 392, 1381
- Hirai & Saitoh (2017) Hirai Y., Saitoh T. R., 2017, ApJ, 838, L23
- Hopkins (2015) Hopkins P. F., 2015, MNRAS, 450, 53
- Hopkins et al. (2011) Hopkins P. F., Quataert E., Murray N., 2011, MNRAS, 417, 950
- Hopkins et al. (2014) Hopkins P. F., Kereš D., Oñorbe J., Faucher-Giguère C.-A., Quataert E., Murray N., Bullock J. S., 2014, MNRAS, 445, 581
- Hopkins et al. (2017) Hopkins P. F., et al., 2017, preprint
- Iwamoto et al. (1999) Iwamoto K., Brachwitz F., Nomoto K., Kishimoto N., Umeda H., Hix W. R., Thielemann F.-K., 1999, ApJS, 125, 439
- Jeon et al. (2017) Jeon M., Besla G., Bromm V., 2017, ApJ
- Kawata et al. (2014) Kawata D., Gibson B. K., Barnes D. J., Grand R. J. J., Rahimi A., 2014, MNRAS, 438, 1208
- Kirby et al. (2008) Kirby E. N., Guhathakurta P., Sneden C., 2008, ApJ, 682, 1217
- Kirby et al. (2010) Kirby E. N., et al., 2010, ApJS, 191, 352
- Kirby et al. (2011a) Kirby E. N., Lanfranchi G. A., Simon J. D., Cohen J. G., Guhathakurta P., 2011a, ApJ, 727, 78
- Kirby et al. (2011b) Kirby E. N., Cohen J. G., Smith G. H., Majewski S. R., Sohn S. T., Guhathakurta P., 2011b, ApJ, 727, 79
- Kirby et al. (2013) Kirby E. N., Cohen J. G., Guhathakurta P., Cheng L., Bullock J. S., Gallazzi A., 2013, ApJ, 779, 102
- Kirby et al. (2014) Kirby E. N., Bullock J. S., Boylan-Kolchin M., Kaplinghat M., Cohen J. G., 2014, MNRAS, 439, 1015
- Kirby et al. (2017) Kirby E. N., Rizzi L., Held E. V., Cohen J. G., Cole A. A., Manning E. M., Skillman E. D., Weisz D. R., 2017, ApJ, 834, 9
- Kroupa (2002) Kroupa P., 2002, Science, 295, 82
- Lanfranchi & Matteucci (2003) Lanfranchi G. A., Matteucci F., 2003, MNRAS, 345, 71
- Lanfranchi & Matteucci (2004) Lanfranchi G. A., Matteucci F., 2004, Mon. Not. R. Astron. Soc, 351, 1338
- Lanfranchi & Matteucci (2007) Lanfranchi G. A., Matteucci F., 2007, A&A, 468, 927
- Lanfranchi & Matteucci (2010) Lanfranchi G. A., Matteucci F., 2010, A&A, 512, A85
- Lanfranchi et al. (2006) Lanfranchi G. A., Matteucci F., Cescutti G., 2006, A&A, 453, 67
- Leitherer et al. (1999) Leitherer C., et al., 1999, ApJS, 123, 3
- Letarte et al. (2010) Letarte B., et al., 2010, A&A, 523, A17
- Lin & Faber (1983) Lin D. N. C., Faber S. M., 1983, ApJ, 266, L21
- Ma et al. (2016) Ma X., Hopkins P. F., Faucher-Giguère C.-A., Zolman N., Muratov A. L., Kereš D., Quataert E., 2016, MNRAS, 456, 2140
- Ma et al. (2017) Ma X., Hopkins P. F., Wetzel A. R., Kirby E. N., Anglés-Alcázar D., Faucher-Giguère C.-A., Kereš D., Quataert E., 2017, MNRAS, 467, 2430
- Manning & Cole (2017) Manning E. M., Cole A. A., 2017, MNRAS, 471, 4194
- Mannucci et al. (2006) Mannucci F., Della Valle M., Panagia N., 2006, MNRAS, 370, 773
- Maoz & Graur (2017) Maoz D., Graur O., 2017, preprint
- Marcolini et al. (2003) Marcolini A., Brighenti F., D’Ercole A., 2003, MNRAS, 345, 1329
- Marcolini et al. (2008) Marcolini A., D’Ercole A., Battaglia G., Gibson B. K., 2008, MNRAS, 386, 2173
- Martin et al. (2008) Martin N. F., de Jong J. T. A., Rix H.-W., 2008, ApJ, 684, 1075
- Mateo (1998) Mateo M., 1998, Annu. Rev. Astron. Astrophys, 36, 435
- Mori et al. (2002) Mori M., Ferrara A., Madau P., 2002, ApJ, 571, 40
- Muratov et al. (2015) Muratov A. L., Kereš D., Faucher-Giguère C.-A., Hopkins P. F., Quataert E., Murray N., 2015, MNRAS, 454, 2691
- Nomoto et al. (2006) Nomoto K., Tominaga N., Umeda H., Kobayashi C., Maeda K., 2006, Nucl. Phys. A, 777, 424
- Oñorbe et al. (2014) Oñorbe J., Garrison-Kimmel S., Maller A. H., Bullock J. S., Rocha M., Hahn O., 2014, MNRAS, 437, 1894
- Oñorbe et al. (2015) Oñorbe J., Boylan-Kolchin M., Bullock J. S., Hopkins P. F., Kereš D., Faucher-Giguère C.-A., Quataert E., Murray N., 2015, MNRAS, 454, 2092
- Orban et al. (2008) Orban C., Gnedin O. Y., Weisz D. R., Skillman E. D., Dolphin A. E., Holtzman J. A., 2008, ApJ, 686, 1030
- Orr et al. (2016) Orr M. E., et al., 2016, MNRAS, 000, 1
- Pilkington et al. (2012) Pilkington K., et al., 2012, MNRAS, 425, 969
- Recchi et al. (2001) Recchi S., Matteucci F., D’Ercole A., 2001, MNRAS, 322, 800
- Revaz & Jablonka (2012) Revaz Y., Jablonka P., 2012, A&A, 538, A82
- Revaz et al. (2009) Revaz Y., et al., 2009, A&A, 501, 189
- Revaz et al. (2016) Revaz Y., Arnaudon A., Nichols M., Bonvin V., Jablonka P., 2016, A&A, 588, A21
- Sawala et al. (2010) Sawala T., Scannapieco C., Maio U., White S., 2010, MNRAS, 402, 1599
- Shen et al. (2010) Shen S., Wadsley J., Stinson G., 2010, MNRAS, 407, 1581
- Shen et al. (2013) Shen S., Madau P., Guedes J., Mayer L., Prochaska J. X., Wadsley J., 2013, ApJ, 765, 89
- Skillman et al. (1989) Skillman E. D., Kennicutt R. C., Hodge P. W., 1989, ApJ, 347, 875
- Smagorinsky (1963) Smagorinsky J., 1963, Monthly Weather Review, 91, 99
- Sneden et al. (1992) Sneden C., Kraft R. P., Prosser C. F., Langer G. E., 1992, AJ, 104, 2121
- Su et al. (2017) Su K.-Y., Hopkins P. F., Hayward C. C., Faucher-Giguère C.-A., Kereš D., Ma X., Robles V. H., 2017, MNRAS, 471, 144
- Suda et al. (2008) Suda T., et al., 2008, PASJ, 60, 1159
- Tolstoy et al. (2009) Tolstoy E., Hill V., Tosi M., 2009, ARA&A, 47, 371
- Venn et al. (2004) Venn K. A., Irwin M., Shetrone M. D., Tout C. A., Hill V., Tolstoy E., 2004, AJ, 128, 1177
- Wadsley et al. (2008) Wadsley J. W., Veeravalli G., Couchman H. M. P., 2008, MNRAS, 387, 427
- Weisz et al. (2014) Weisz D. R., Dolphin A. E., Skillman E. D., Holtzman J., Gilbert K. M., Dalcanton J. J., Williams B. F., 2014, ApJ, 789, 147
- Wetzel et al. (2016) Wetzel A. R., Hopkins P. F., Kim J.-h., Faucher-Giguère C.-A., Kereš D., Quataert E., 2016, ApJ, 827, L23
- Wheeler et al. (2017) Wheeler C., et al., 2017, MNRAS, 465, 2420
- Wiersma et al. (2009) Wiersma R. P. C., Schaye J., Theuns T., Dalla Vecchia C., Tornatore L., 2009, MNRAS, 399, 574
- Williamson et al. (2016) Williamson D., Martel H., Romeo A. B., 2016, ApJ, 831, 1
- Woo et al. (2008) Woo J., Courteau S., Dekel A., 2008, MNRAS, 390, 1453
- de Boer et al. (2012a) de Boer T. J. L., et al., 2012a, A&A, 539, A103
- de Boer et al. (2012b) de Boer T. J. L., et al., 2012b, A&A, 544, A73
Appendix A Stochastic IMF Sampling
Here, we note that additional scatter can be introduced into the MDFs and abundances as a consequence of stochastic IMF sampling at sufficiently high resolutions, such that a star particle no longer approximates a single stellar population. Estimates from Revaz et al. (2016) for SPH methods suggest that the single stellar population approximation no longer holds for star particles with M∗ 1000 M⊙, which includes the standard FIRE dwarf galaxies with mass resolution of 250 M⊙.
We do indeed expect that the IMF is not being individually well-sampled at these masses. However, we anticipate that this is more of an issue in ultra-faint dwarf galaxies, which have sufficiently low stellar masses such that the star formation history of the galaxy is substantially impacted by a single SN. In contrast, a majority of the FIRE dwarf galaxies have M∗ 106 M⊙, such that the effects of individual SNe on galaxy-scale properties are negligible, or weak at most (Su et al., in prep.).
We expect that the additional numerical scatter introduced by IMF sampling is offset by the inclusion of IMF-averaged yields (Iwamoto et al., 1999; Nomoto et al., 2006). Ultimately, we are concerned with total metallicity distributions and the behaviour of -element abundance ratios as a function of metallicity, as opposed to detailed abundance patterns. In the latter case, the effects of IMF sampling would be more pronounced, and would require proper quantification. Particularly in the case of metal diffusion, we do not anticipate that stochastic IMF sampling will have a significant effect on the MDFs and abundance ratios, since metal diffusion drives the metallicity of a star particle toward the average metallicity of the galaxy, and so can reduce artificial noise from a number of different sources.
Sub-grid metal mixing, which we have argued is necessary to include in hydrodynamical simulations of galactic chemical evolution, has interesting implications for modelling individual abundance patterns. That is, the presence of sub-grid diffusion or the lack thereof dictates the amount of information that can be extracted from detailed abundance patterns. With the inclusion of metal diffusion, only the first few SN explosions individually affect a galaxy, after which metals are quickly homogenized.
Overall, this study will be informative for addressing how much scatter can be attributed to IMF sampling, and to what degree numerical artifacts can be reduced via sub-grid metal mixing.
Appendix B Metal deposition
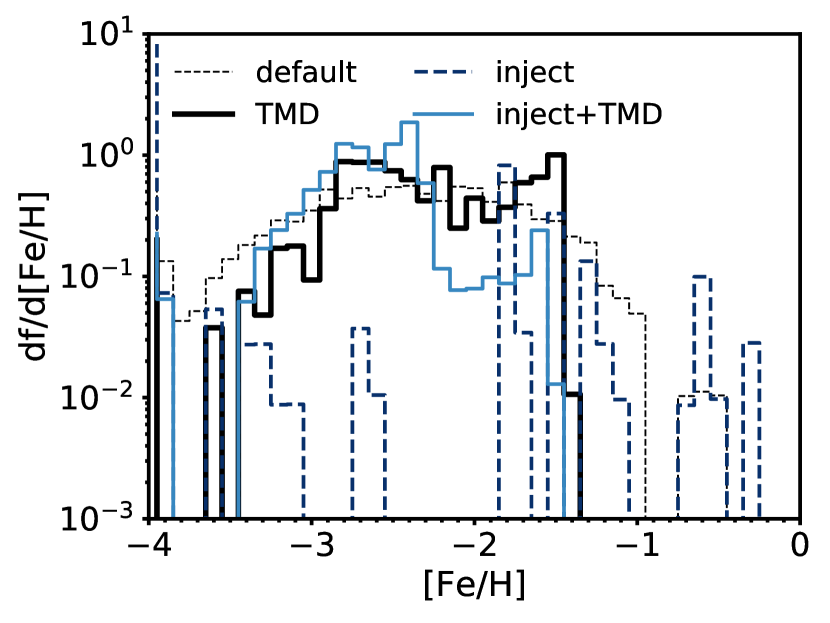
Altering the metal deposition algorithm could potentially impact the MDF and abundances by introducing an additional source of numerical scatter. For example, gas particles with different distances from the “exploding” star particle may receive varying amounts of metals, a fixed number of particles may be injected with metals, or a fixed volume surrounding such an exploding star particle may be enriched. A more realistic metal deposition prescription , or one in which the metals are dispersed more uniformly, will intuitively introduce less scatter into chemical evolution observables as compared to, e.g., the injection of all metals from a SN into a single gas particle.
To illustrate the robustness of our results with respect to the details of mechanical feedback when including diffusion, we compare the unphysical, extreme case of single-particle metal injection to that of the standard FIRE implementation. In the standard method, an effective neighbour number is determined based on a kernel function and search radius within a sphere defined by these quantities, such that the resulting distribution of ejecta is isotropic, including regions with highly disordered gas particle positions (Hopkins et al., 2017).
Figure 10 shows the logarithmic MDFs of four simulations run at a comparatively lower mass resolution of 2100 M⊙ for m10q. As expected, the MDF for the case of single-particle injection, without TMD, exhibits an unrealistically large scatter characterized by a series of disconnected peaks. In this prescription, some star particles are never enriched, whereas others are enriched to high values of metallicity ([Fe/H] 0.5) that are not observed in LG dwarf galaxies.
The inclusion of TMD brings the single-particle injection method into better approximate agreement with standard FIRE MDFs with and without sub-grid diffusion in terms of the shape of the distribution (Figure 10). All simulations presented in Figure 10 have approximately the same stellar mass at z = 0 (M∗ 1.2 - 1.7 106 M⊙). The same narrowing effect of the MDF is exhibited, with a reduction in the width from [Fe/H] = 0.41 dex to 0.30 dex. This accompanies a significant shift of the average metallicity from -1.51 dex to -2.49 dex (as compared to average metallicity values of [Fe/H] = -2.18 and -2.15 for the standard metal deposition scheme with and without sub-grid diffusion). The narrowing effect is not as pronounced in the runs with standard metal deposition, with [Fe/H] = 0.50 and 0.46 dex with and without diffusion respectively, most likely owing to lower mass resolution (2100 M⊙ as compared to 250 M⊙).
Thus, we conclude that the presence of diffusion stabilizes the MDFs and abundances against differences in the specific numerical implementation of metal deposition.
Appendix C Diffusion coefficient calibration
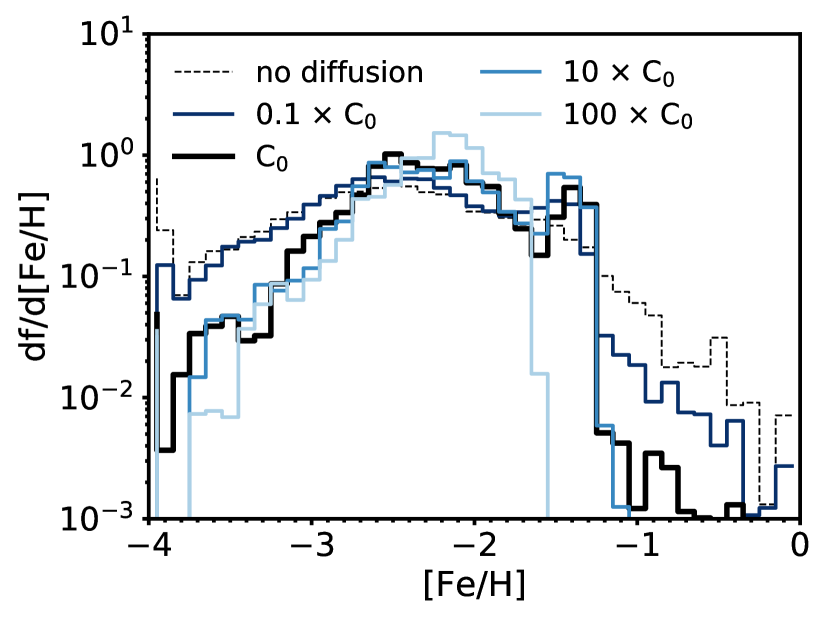
While the implementation of turbulent metal diffusion is more physical, given the nature of turbulence in the ISM, the diffusion coefficient must be calibrated independently for different numerical methods, owing to the different “effective resolution scale” of the turbulent cascade associated with each simulation. For example, the relevant scale at standard FIRE dwarf resolution ( 250 M⊙) will differ compared to other simulations, since a majority of the mixing is resolved. Colbrook et al. (2017) tested the FIRE implementation of turbulent metal diffusion in idealized, converged turbulent box simulations, verifying that the prescription is valid with 0.05, where = , given our definitions of h and S. This is further confirmed by a more comprehensive study by Rennehan et al. (in prep.), which similarly indicates that 0.03 - 0.05. Thus, a proper calibration of the coefficient is necessary to ensure that sub-grid metal diffusion approximates a physical process at a given resolution-scale. We emphasize through the numerical tests shown in § D that the method is not especially sensitive to the exact value of the coefficient for a given calibration.
Appendix D Robustness of Results with respect to the Diffusion Coefficient
A potential drawback of the sub-grid turbulent metal diffusion implementation is possibly unphysical amounts of diffusion. To address the possibility of significant over-mixing, we varied the diffusion coefficient, (§ 2.2), to test the impact on the strength of metal diffusion on the MDF.
As illustrated in Figure 11, an increase in the coefficient by an order of magnitude for runs of m10q does not significantly change the appearance of the MDF above a minimum diffusivity. A reduction of the diffusion strength by an order of magnitude (0.1 C0), relative to the standard adopted diffusion strength ( = 0.003), results in a broader MDF (0.50 dex). Although the detailed distribution at the high-metallicity tail changes for a diffusion strength of 0.1 C0, the low-metallicity tail and main body of the MDF are comparable to the case without any sub-grid metal diffusion. We calibrate the value of such that it corresponds to the minimum diffusion strength that results in significant sub-grid metal mixing. Above = 0.003, increasing the diffusion strength results in some reduction in the number of stars present in both the high- and low-metallicity tails. Despite the increase in the diffusion coefficient, the widths of the distributions remain approximately constant at 0.44 dex and 0.46 dex for diffusion coefficients of C0 and 10 C0 respectively. However, in the case of an increase in the coefficient by two orders of magnitude (100 C0), the effects of over-mixing become apparent with a reduction in the width to 0.29 dex, as well as in the complete absence of the tails of the distribution.
This suggests that MDF predictions are not extremely sensitive to the exact diffusion coefficients above a minimum diffusivity within an order of magnitude, as long as some degree of sub-grid turbulent mixing is present. Together, the insensitivity of the MDF to the diffusion coefficient and the narrowing of the MDF relative to runs without TMD (§ 3.2) imply that the timescale for metal mixing is shorter than a dynamical time for dwarf galaxies. As we show explicitly in § 4.2, with any given burst of star formation, we can assume that the ISM is well-mixed and nearly homogeneous, resulting in a stellar population born with approximately the same metallicity.
Previous work by Williamson et al. (2016) involving idealized, non-cosmological simulations of dwarf galaxies came to a similar conclusion concerning the robustness of the diffusion strength relative to the diffusion coefficient. However, this work does not include the infall of pristine gas, galaxy interactions, galaxy evolution through cosmological time, the initialization of star particles at low-metallicity at early times (to approximate the Population III to Population II transition), and self-regulated star formation, which are essential for an accurate model of the chemodynamical evolution of a galaxy. Thus, we confirm that the addition of diffusion still contributes to the robustness of results in the case of more realistic galaxy evolution simulations.
Appendix E Mass resolution
We consider the impact of mass resolution on the width of the MDF and the intrinsic scatter in [/Fe] vs. [Fe/H]. The star particle mass resolution for the isolated FIRE dwarfs is 250 M⊙ whereas the Latte dwarf galaxies are at lower mass resolution (7070 M⊙), and thus resolution effects may factor into our comparisons between isolated FIRE dwarf galaxies and dwarf galaxies from the Latte simulations.
First, we establish that most results, such as the stellar mass and star formation rates, converge with mass resolution after the Toomre scale (i.e. the largest self-gravitating structures) is resolved (Hopkins et al., 2011, 2017). The metallicity and burstiness of dwarf galaxy star formation histories converge to within 10 % (to 20% maximum) differences for (1) 100, where is the number of star particles in a galaxy, such that the self-enrichment history is well-sampled, and (2) star particle mass 104 M⊙ for M 1010 M⊙, such that numerically enhanced burstiness does not occur (Hopkins et al., 2017).
Figure 12 illustrates the results of mass resolution tests for the MDF width. Data from the FIRE isolated dwarfs, including an ultra high-resolution (30 M⊙) run of m10q (Wheeler et al., in prep), in addition to isolated dwarf galaxies in the zoom-in region of both m11q, a LMC mass halo, and m12i are shown. We consider only isolated dwarfs for the resolution test to account for differences in the disruption of satellites by the host (§ 5). All runs include TMD, where runs without TMD contain star particles with more improbable metallicites and have comparatively enhanced numerical noise in the MDF.
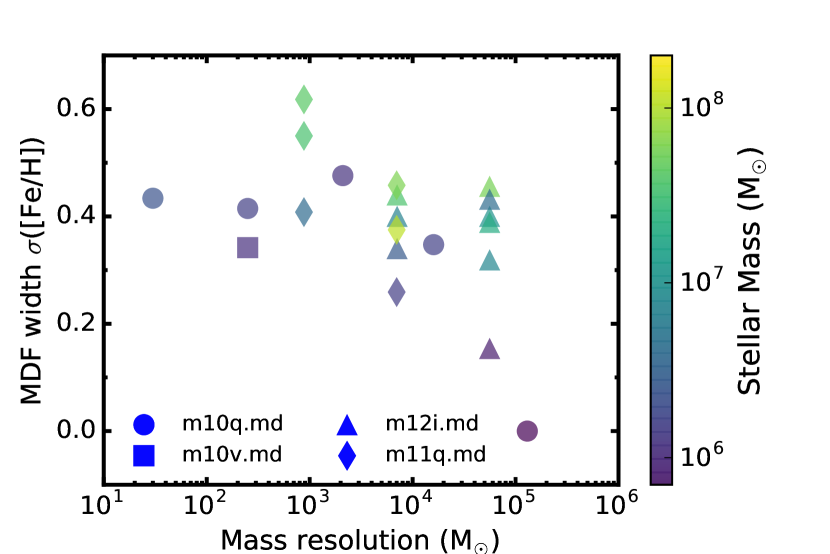
Although the MDF width exhibits some variation for the isolated dwarf galaxies in simulations with a primary host, it can be attributed to the typical scatter (standard deviation 0.1 dex) at a given stellar mass expected from stochastic effects. Nonetheless, the mean MDF width appears to systematically decrease for mass resolution 104 M⊙. We note that the lowest resolution run, at baryonic particle mass of 160,000 M⊙, has a near zero MDF width likely owing to a truncated SFH caused by numerically enhanced burstiness, a secondary resolution effect. Excluding the lowest resolution run and taking into account the typical scatter at a given stellar mass, we conclude that the MDF width of the FIRE isolated dwarfs and Latte satellite and isolated dwarf galaxies are converged for mass resolution 105 M⊙.
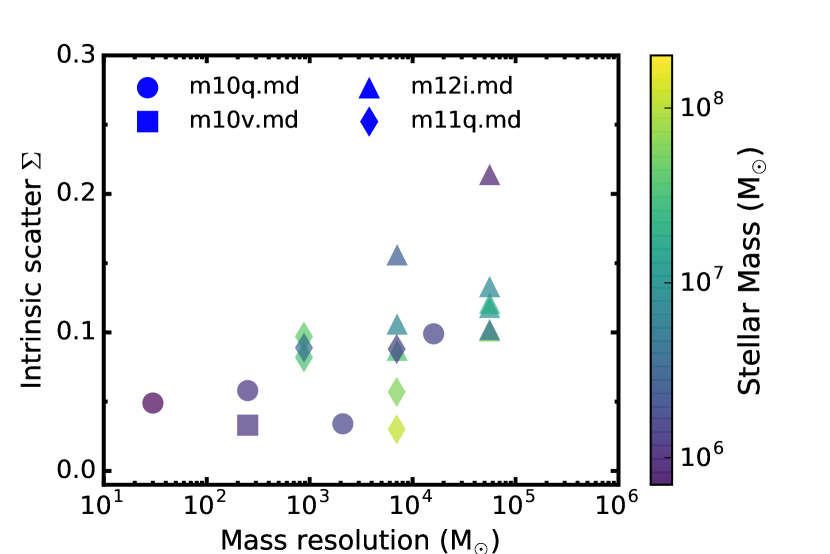
Similarly, Figure 13 shows mass resolution tests for the intrinsic scatter in [Si/Fe] at fixed [Fe/H]. In contrast to the MDF width, the intrinsic scatter increases with mass resolution 103 M⊙ for the lowest mass simulated dwarf galaxies (M∗ 106.5 M⊙). This is due to secondary resolution effects resulting in numerically enhanced burstiness, as discussed in § 5.2. We quantify the degree of burstiness as a the fraction of the total = 0 stellar mass formed when the star formation rate averaged over short timescales ( 10 Myr) exceeds (by a factor of 1.5) the average star formation rate averaged over longer timescales ( 100 Myr). We find that burstiness converges for baryonic particle mass resolution 103 M⊙. For mass resolution 103, burstiness in dwarf galaxies increases with decreasing mass resolution, while simultaneously exhibiting mass-dependent behaviour, such that lower-mass dwarf galaxies are burstier.
Hence, the intrinsic scatter in Latte dwarf galaxies with baryonic particle mass 7070 M⊙increases for less well-resolved, lower-mass dwarf galaxies. The intrinsic scatter converges at higher mass resolution than the MDF width, because the burstiness is more sensitive to mass resolution than the long-term ( 10 Gyr) star formation history. Since we cannot separate resolution effects from stochastic variation in the intrinsic scatter at a given stellar mass for these dwarf galaxies, we do not quantify the typical variation expected in the intrinsic scatter, , as in the case of the MDF width, ([Fe/H]). Considering only the better resolved, high-mass dwarf galaxies (M∗ 106.5 M⊙), no trend exists in the intrinsic scatter with baryonic particle mass resolution for 104 M⊙ for both the FIRE isolated and Latte dwarf galaxies.