Photoionisation of Ca+ ions in the valence-energy region 20 eV – 56 eV : experiment and theory
Abstract
Relative cross sections for the valence shell photoionisation (PI) of ground level and metastable Ca+ ions were measured with high energy resolution by using the ion-photon merged-beams technique at the Advanced Light Source. Overview measurements were performed with a full width at half maximum bandpass of meV, covering the energy range 20 eV – 56 eV. Details of the PI spectrum were investigated at energy resolutions reaching the level of meV. The photon energy scale was calibrated with an uncertainty of meV. By comparison with previous absolute measurements the present experimental high-resolution data were normalised to an absolute cross-section scale and the fraction of metastable Ca+ ions that were present in the parent ion beam was determined to be 184%. Large-scale R-matrix calculations using the Dirac Coulomb approximation and employing 594 levels in the close-coupling expansion were performed for the Ca and Ca levels. The experimental data are compared with the results of these calculations and previous theoretical and experimental studies.
Keywords: photoionisation, calcium ions, valence shells, photon-ion merged-beams, synchrotron radiation, high-resolution spectra, interference profiles
Short title: Photoionisation of Ca+ ions in the valence region
J. Phys. B: At. Mol. Opt. Phys.
1 Introduction
Multiply excited states play an important role in electron-ion and photon-ion interactions; cross sections are often dominated by indirect processes, forming intermediate autoionizing states which then decay into the different final channels that are observed in various types of experiments. In particular, autoionizing states are most relevant in photoionisation (PI) and its time-reversed analog, photorecombination (PR) of ions, where they produce resonances superimposed on smooth cross sections for direct reaction channels. The pathways of a reaction via direct and resonance channels may not always be distinguishable. If the initial and final states are identical, the amplitudes of the pathways interfere and, as a result, the associated cross sections show resonance contributions with distorted line shapes, the so called Fano profiles ([1] and references therein). Studying such interference in detail can provide deep insights into the quantum dynamics of atomic-scale systems [2].
While Fano line shapes are commonly observed in PI, electron-ion recombination experiments rarely show direct evidence for interference phenomena. Because of the importance of such effects, theoretical attempts have been made to predict interference of resonant (indirect) and direct PR channels as well as interference of interacting resonances [3, 4]. A particular example is the prediction of an asymmetric resonance profile in PR of Sc3+ ions by Gorczyca et al [5] involving the following transitions
| (1) | |||||
The two indistinguishable pathways to the final term with a photon emitted produce an asymmetric resonance line shape, and the fact that the intermediate term can decay by a very fast Super-Koster-Cronig transition makes this resonance extremely broad, facilitating its detailed mapping in a recombination experiment.
This carefully chosen example set the starting point for a very fruitful research initiative on PR of argon-like and PI of potassium-like ions both in theory and experiment aiming at the detailed spectroscopy of multiply excited levels of potassium-like ions in low charge states. First experiments on the recombination of Ar-like Sc3+ ions [6, 7] did not show the predicted asymmetric resonance in the expected energy range, indicating the difficulties to correctly predict level energies in an atomic system where the and subshells compete for providing the lowest binding energy for an electron and where an additional vacancy is present. Therefore, experiments were started on PR of Ti4+ [8] which is isoelectronic with Sc3+. It became clear that the prediction of resonance energies, i.e., energies of autoionizing levels in K-like ions, and of their decay properties is much more challenging than previously anticipated. New measurements on PR of Sc3+ ions [9], conducted under greatly improved experimental conditions, clearly revealed the existing discrepancies between calculated and observed resonance energies and cross sections. Motivated by this unsatisfying situation the experimental efforts were extended to PI of potassium-like Sc2+ [10, 11] and Ti3+ ions [12] and by exploiting the principle of detailed balance based on time-reversal symmetry, the measurements on PR and PI provided a very consistent picture confirming the initial prediction of asymmetric resonances as a consequence of interference of resonant and direct interaction channels. Within this same spectroscopy-oriented initiative, experiments were conducted on PI of potassium-like Ca+, for which preliminary results were reported [13], and on PI of Fe7+ ions [14].
Substantial progress was achieved on the theory side in the treatment of PR of argon-like ions and PI of potassium-like ions [15, 16, 17, 18, 19, 20]. The PI and PR spectra of scandium and titanium ions of relevance in the present context appear to now be well understood. However, the existing calculations for PI of Fe7+ ions [18, 21] do not reproduce the experimental findings [14] in a satisfying manner, and the reason for this is not yet clear. The situation for Ca+, the lightest ion in the potassium isoelectronic sequence, is the topic of the present investigation. Complications in the theoretical treatment are to be expected because of the low parent-ion charge state and the corresponding strong influence of electronic correlations and inter-channel coupling which give rise to the subtle interplay of the and subshells.
The detailed investigation and understanding of electronic structure observable in PI of Ca+, and consequently also in PR of Ca2+ ions, is not the only motivation for research on calcium ions in low charge states. Properties of the Ca+ ion are of great interest and importance in astrophysics. For example, the absorption spectrum of the Ca+ ion in its ground level or its long-lived excited levels is used to explore the structure and properties of interstellar dust clouds [22, 23]. The interstellar lines of Ca II (IS CaII K and IS Ca II H) have been observed in the spectrum of the bright Seyfert galaxy NGC 3783 [24]. Emission in the Ca II H and K line cores has long been known to be a good proxy for magnetic activity in the Sun [25]. PI of Ca+(Ca II) ions out of the metastable excited term is important for understanding the Sun and sunspot atmospheres [26, 27]. Ca II H spectra [28, 29] have been used to examine whether spicules can be detected in the broad-band Ca II H filter imaging data on the solar disc [30]. Spectral lines of Ca II have also been observed in the photospheric spectra of luminous supernovae [31]. Fundamental atomic data on Ca II are required to understand all these observed spectra.
Few measurements have been made on the Ca+ ion. Spectroscopic measurements on photoabsorption by Ca, Ca∗, and Ca+ in the range of excitations of a electron were first reported by Sonntag et al [32] who produced a plasma by laser-irradiation of Ca vapour and observed the absorption of quasi-continuum VUV backlight emitted by a second laser-generated plasma. Absolute photoionisation cross sections were first measured by Lyon et al [33], who merged beams of tunable monochromatic VUV synchrotron radiation (282 Å 498 Å) and ground-level Ca+ ions. Electron spectroscopy experiments were performed on Ca+ by Bizau et al [34] and a similar attempt was undertaken on metastable Ca+ ions by Gottwald et al [35]. Valence-shell PI studies on the ground and metastable levels of Ca+ were carried out by Kjeldsen et al [36] in the photon energy range 28.0 – 30.5 eV. PI along the sequence of ions from Ca+ to Ni+ in the range of transitions was studied experimentally by Hansen et al [37].
Diverse theoretical methods have been used to study PI of neutral and singly ionized calcium. Altun and Kelly [38] used many-body perturbation theory (MBPT) to study PI of the neutral atom with excitation to the residual Ca+ and levels. For the Ca+ ion the first ab initio calculations using the R-matrix method in an -coupling scheme were carried out by Miecznik et al [39] for the energy range from above the first ionisation threshold to a photon energy of 43.54 eV. Configuration-interaction wavefunctions generated from the ( = , , and ), where is a pseudo-orbital, were included in the R-matrix close-coupling expansion. The corresponding Rydberg series of resonances were analyzed and compared with the early experimental data of Lyon et al [33]. The -coupling scheme used by Miecznik et al in their pioneering work on Ca+ neglected relativistic effects.
Following the work of Miecznik et al [39], calculations by Ivanov and West [40], using the non-relativistic, spin polarized version of the random-phase approximation with exchange (RPAE), determined positions and intensities of the resonances seen experimentally in the PI spectrum of Ca+ in the range 27 – 43 eV [33]. Values for the oscillator strengths and energy positions for the main one-electron transitions were obtained, and this information was used to tentatively identify the most prominent features in the experimental spectrum. Hansen and Quinet carried out calculations on subshell excitation from metastable Ca+ ions using the Cowan code [41] with 26 interacting configurations. They provided resonance energies for the 26 strongest transitions as well as the associated oscillator strengths. Large-scale configuration interaction calculations for ground-level Ca+ in intermediate coupling by Hibbert and Hansen [42] using a total of 206 configurations provided recommended level assignments for the spectrum obtained by Lyon et al together with resonance energies and oscillator strengths. Many-body perturbation theory was used by Jiang et al [43] to calculate the resonance structure of transitions in ground-level Ca+ ions.
More recently, PI cross-section calculations for Ca+ were extended by Sossah et al [19] using the R-matrix method in both and intermediate coupling () approximations. Configuration interaction wavefunctions, generated from , ( = , , , , , and ), where are pseudo-orbitals, were included in the R-matrix expansion. The work of Sossah et al [19] was restricted to including 17 fine-structure levels in the close-coupling calculations, where the residual states were represented by highly sophisticated correlated configuration wavefunctions generated from selective one and two-electron promotions. The results of Sossah et al [19] were in very respectable agreement with the previous experimental work performed by Kjeldsen et al [36].
The availability of large-scale computational facilities now makes it possible to extend previous theoretical work by using close-coupling calculations within the Dirac Coulumb () R-matrix approximation with very large basis sets. Corresponding results are compared with previous experimental studies and with the present measurements, which were performed over a wider energy range and at higher energy resolution as compared to previous experiments using undulator radiation from a third-generation synchrotron source.
The layout of this paper is as follows. Section 2 presents the experimental procedures and section 3 outlines the corresponding theoretical approach. In section 4 the results from the present findings are discussed. Finally in section 5 the results of this work are summarised.
2 Experiment
The experiments on PI of Ca+ ions made use of the Ion-Photon Beam (IPB) endstation of undulator beamline 10.0.1.2 at the Advanced Light Source (ALS) in Berkeley, California, USA. The merged-beams technique [44, 45] was employed. Experimental methods for studying photoabsorption by ions and typical results of such experiments have been reviewed by Müller et al [46, 47]. The most recent publication of experimental results from the IPB addressed PI of W4+ ions [48]. The general layout of the IPB setup and the associated experimental procedures were described in detail by Covington et al [49]. Here, only a brief overview of the experiment is presented with details specific to the present measurements.
Beams of Ca+ ions of 6 keV energy were produced using a commercial hot-filament, low-pressure-discharge ion source on a positive potential of 6 kV. Metallic calcium was deposited inside the source body and evaporated into the discharge plasma. The source had been developed on the basis of the electron-bombardement plasma source described by Menzinger and Wåhlin [50]. This type of ion source has often been employed in experiments where pure beams of ions in their ground level were desired. For producing such beams the anode voltage in the source is kept sufficiently low that electrons do not gain enough energy to reach excited ionic levels from the ground state of the neutral atom. In contrast, the anode voltage was purposely set at a relatively high voltage (80 V) in the present experiment. The associated electron energy of 80 eV is far above the threshold for the production of the Ca excited term. This was desired for the determination of the energy and the width of the doubly excited levels (see equation 1) that can be populated by photoexcitation of Ca ions. The lifetimes of Ca and Ca have been determined to be 1195(8) ms [51] and 1168(7) ms [52], respectively. These lifetimes are more than four orders of magnitude longer than the flight time of the Ca+ ions from the source to the photon-ion interaction region. Collisional quenching of the metastable levels by interactions with the residual gas can be neglected in the high to ultra-high vacuum of the apparatus. Hence, an initial population of the long-lived excited levels does not change while the ions travel to the interaction region. Analysis of the data taken in the experiment showed that 18% of the ions in the primary beam were in the metastable term (for details see below).
The ion beam extracted from the source was analysed with respect to mass per charge by a 60∘ dipole bending magnet. The selected 40Ca+ beam component was collimated and transported by suitable electrostatic lens and steering elements to an electrostatic 90∘ spherical deflector, the merger, which directed the parent ion beam onto the axis of a monoenergetic beam of photons from the beamline monochromator. In the merging section between the 90∘ spherical deflector and a subsequent 45∘ bending magnet, the demerger, parent 40Ca+ ions were excited and ionized by photons. After ion charge-state separation by the demerger magnet the parent beam was collected in a Faraday cup and the Ca2+ product ions were detected by a microsphere-plate detector. The photon flux was measured by a calibrated Si X-ray diode. The photon energy was scanned in steps of 5 meV for the overview spectrum covering the range from 20 to 56 eV at 17 meV resolution. The step size was reduced in narrower energy ranges when smaller bandwidths of photon energies were employed (e.g. 0.5 meV steps for 4.6 meV resolution). At each photon energy, data were alternately taken for 1 s with both beams ”on” and then again for 1 s with the photon beam ”off”. The integrated ion current, the photon flux, and the number of product Ca2+ ions collected in each of the ”on” and ”off” phases were recorded, permitting subtraction of the detector background which arises mainly from collisions of the parent ions with the residual gas and from stray particles and photons produced when the ions hit surfaces.
In one energy scan a range of typically 1 eV was covered assuming that the form factor[44], which quantifies the overlap of the photon beam and the ion beam, does not significantly change over such a short energy interval. For checking the reproducibility and consistency of the measurements, additional scans were recorded in energy ranges spanning up to 5.2 eV. Numerous overlapping scans were measured to cover the total energy range of interest. The resulting overview spectrum at 172 meV resolution comprises more than 7200 data points. In addition, shorter energy ranges were scanned at higher resolution, including bandpasses of 8.8 meV, 4.6 meV, and 3.3 meV. Because of the availability of absolute cross sections for PI of Ca+ in smaller energy regions and at lower resolving powers [33, 36] no attempt was made to carry out absolute measurements in the present study. The focus was rather on well calibrated photon energies and high-resolution spectroscopy of autoionizing levels in the Ca+ ion.
For the determination of the ion-rest-frame photon energy the Doppler effect resulting from the counter-propagation of photons and the 1.7 cm/s Ca+ ions was taken into account. These corrections were between 10 and 30 meV in the investigated energy range. The photon energy was calibrated by an ionisation-threshold measurement with 6 keV K+ ions (31.62500(19) eV [53]) and the observation of resonances in the Ca+ ion ( at 28.1995 eV and at 28.5441 eV [53]). The total absolute uncertainty of the energy scale is estimated to be 5 meV. In the determination of specific resonance energies from the scan measurements the statistical uncertainties of the measured cross sections can introduce additional uncertainties.
The raw spectrum obtained in the experiment was corrected for effects of higher-order radiation known to be present at the ALS photon beamline employed in the present measurements. These effects depend on the photon energy and are significant below approximately 25 eV. The necessary corrections have been discussed previously by Müller et al [54]. With these corrections the ion yield was normalised to ion current and photon flux, i. e., the relative cross section function for PI of Ca+ ions was obtained.
The present relative PI cross sections were normalised to the previous absolute measurements by Lyon et al and Kjeldsen et al . In a first step, the overview scan spectrum was normalized to the data of Lyon et al which cover a relatively wide range of photon energies from 28 to 42.5 eV. Lyon et al used a surface ionisation source that produced only ground-level Ca ions. Hence, the normalized scan spectrum which was taken with a mixture of ground-state and metastable Ca+ ions was still to be corrected for the metastable-ion fraction in the parent ion beam. Kjeldsen et al were able to produce mixed beams of Ca+ ions in the ground-level and metastable ions with different fractional compositions. From the measured absolute cross sections for different mixtures they were able to infer the absolute cross sections for ground-level Ca and for metastable Ca. The complete resonance strength contained in the measured spectrum in the energy range 28.1 –30.1 eV is 20.6 Mb eV in the Kjeldsen et al data and 23.1 Mb eV in the Lyon et al measurement. The two numbers differ by about 11%, well within the combined error bars of the two data sets. In the present experiment a mixed beam was used with the fraction of metastable ions not known a priori. Thus, the measured relative cross section can be described as
| (2) |
where is an overall calibration factor. Fortunately, most of the resonances observed in the spectrum in the energy range 28 – 30.5 eV could be unambiguously assigned to either the ground-level component or the metastable fraction of the ion beam. Only few resonances are not sufficiently well resolved to make such an assignment. The cross sections , , and were integrated over distinct energy regions and containing only ground-level resonances and only metastable-level resonances, respectively. The resulting resonance strengths are denoted , , , and . According to equation 2, the following relations hold
| (3) | |||
| (4) |
The ratio of the two equations yields the fraction of metastable ions in the parent ion beam
| (5) |
Once is known, immediately follows from either one of the equations 3 or 4 and hence the normalised cross section for the mixed beam . If one considers that the cross sections measured by Lyon et al are 11% higher than those of Kjeldsen et al it seems justified to introduce an additional average correction factor of 1.055. In the following the cross section measured for a mixed beam of metastable and ground-level ions in the present study is called . It follows from by multiplication of the correction factor 1.055 which essentially normalises the present measurement to the average of the results obtained by Lyon et al and Kjeldsen et al . The analysis of the measured PI spectrum and the data provided by Kjeldsen et al yielded a fraction of metastable ions in the parent ion beam used in the present experiment.
The uncertainties of and quoted by Kjeldsen et al are 10-15% and 25%, respectively. This results in an uncertainty of 0.04 for . The systematic uncertainty of the present cross section is estimated at about 30%. This number results from the combined uncertainties of the Aarhus measurements and the normalization procedure itself. Comparison of peak areas of resonances associated exclusively with ground-level parent Ca+ ions and resolved in both the present and the Lyon-et al spectra shows agreement within a factor . This factor has to be expected for a 82% fraction of ground-level ions in the present experiment indicating that 30% is a conservative estimate of the relative systematic uncertainty.
3 Theory
High-resolution PI cross-section measurements require state-of-the-art theoretical methods with relativistic effects [55], in order to obtain suitable agreement with experiment. This has been demonstrated for the Ca+ ion by Sossah et al [19] who compared nonrelativistic and relativistic (Breit-Pauli) R-matrix calculations with the experimental results available at the time. The present work employs an efficient parallel version [56, 57] of the Dirac-Atomic R-matrix-Codes (DARC) [58, 59, 60, 61, 62] developed for treating electron and photon interactions with atomic systems. This suite continues to evolve [63, 64, 65, 66] in order to provide for ever increasing larger expansions of target and collision models for electron and photon impact with heavy atomic systems.
The DARC suite of codes allows high-quality PI cross section calculations to be performed on heavy complex systems. PI cross-section calculations of Se+ [62], Se2+ [67], Xe+ [61], Kr+ [61, 68], Xe7+ [69], inner-shell studies on Si+ ions [70], Ar+ [71], and Co+ [72], valence-shell studies on neutral sulfur [73], sulfur-like chlorine, Cl+ [74], copper-like zinc, Zn+ [75], tungsten and its ions, W [76], W+ [54], W2+, W3+ [77], W4+ [48] and W63+ [78] have been made using these DARC codes. Suitable agreement of the DARC photoionisation cross-sections with high resolution measurements performed at leading synchrotron light sources was obtained.
| Level | State | Term | NISTa | GRASPb | GRASPc | GRASPd | AUTOSe | AUTOSf | MCHFg |
|---|---|---|---|---|---|---|---|---|---|
| (Ry) | (Ry) | (Ry) | (Ry) | (Ry) | (Ry) | (Ry) | |||
| 1 | 0.00000 | 0.00000 | 0.00000 | 0.00000 | 0.00000 | 0.00000 | 0.00000 | ||
| 2 | 1.85327 | 2.00695 | 1.82269 | 1.85481 | 1.84254 | 1.87953 | 1.76015 | ||
| 3 | 1.85764 | 2.01158 | 1.82740 | 1.85929 | 1.84754 | 1.88428 | 1.76449 | ||
| 4 | 1.86666 | 2.02106 | 1.83702 | 1.86885 | 1.85760 | 1.89391 | 1.77311 | ||
| 5 | 1.93471 | 2.09287 | 1.90927 | 1.93933 | 1.94250 | 1.95288 | 1.84398 | ||
| 6 | 1.94446 | 2.10324 | 1.91964 | 1.94970 | 1.95234 | 1.96321 | 1.85310 | ||
| 7 | 1.95316 | 2.11228 | 1.92875 | 1.95874 | 1.96138 | 1.97260 | 1.86119 | ||
| 8 | 2.05788 | 2.24472 | 2.06612 | 2.09184 | 2.07332 | 2.08651 | 1.97206 | ||
| 9 | 2.06250 | 2.24840 | 2.06274 | 2.08817 | 2.07134 | 2.08060 | 1.97626 | ||
| 10 | 2.07251 | 2.25538 | 2.07303 | 2.09861 | 2.08111 | 2.09323 | 1.98530 | ||
| 11 | 2.07211 | 2.25678 | 2.07472 | 2.10030 | 2.08280 | 2.09523 | 1.98484 | ||
| 12 | 2.08146 | 2.26471 | 2.08347 | 2.10831 | 2.09192 | 2.08146 | 1.99576 | ||
| 13 | 2.21025 | 2.36114 | 2.20408 | 2.19121 | 2.19563 | 2.31306 | 2.11402 | ||
| 14 | 2.22286 | 2.37496 | 2.21841 | 2.20474 | 2.21091 | 2.32712 | 2.12631 | ||
| 15 | 2.23818 | 2.39076 | 2.23414 | 2.22083 | 2.22495 | 2.34139 | 2.14026 | ||
| 16 | 2.25718 | 2.41325 | 2.25854 | 2.24141 | 2.25920 | 2.36902 | 2.16055 |
aNIST tabulations [53]
bGRASP, present 93-levels treatment
cGRASP, present 594-levels treatment
dGRASP, present 1153-levels treatment
eAUTOS, Sossah et al [19]
fAUTOS, Nikolić et al [17]
gMCHF, Froese Fischer et al [81].
For PI cross-section calculations on the Ca+ ion, close-coupling DARC computations were initially performed using 93 levels of the residual Ca2+ ion arising from single electron promotion to the =3, 4 and 5 levels from the ground-state configuration, , resulting in a total of eleven configurations. These configurations were , , , , , , , , , . In addition, effects of opening the 3s shell were included by adding the single configuration to the basis set.
Next, a model was used that included one-electron promotions , where , and two-electron promotions to the = 3 and 4 levels together with . In order to have compact target and scattering representations, it was necessary to restrict the two-electron configurations to , , , , , and , giving a total of 594 levels.
A final target model incorporating one-electron promotions where and the two-electron promotions and , giving 1153 levels was also investigated.
Table 1 shows a sample of results from selective models for the energy levels using the GRASP code for the lowest 16 levels of the residual Ca2+ ion. The present results are compared with previous theoretical studies from the AUTOSTRUCTURE (AUTOS) [17, 19] and MCHF codes [81] and with the NIST tabulated values [53]. From the results presented in table 1, it is clear that in order to achieve spectroscopic accuracy, much larger-scale configuration interaction models than considered here are required. This is due primarily to the very slow convergence of the external electron correlation incorporated into the models. Due to the limitations of available computation resources, even with access to world-leading computer facilities, the 594-level approximation was used as a compromise for the target and scattering approximations. It will be seen to reproduce the main features in the experimental PI cross sections.
The atomic structure calculations were performed with the GRASP code [79, 80, 55] to provide target wavefunctions for the various models of the residual ion used in the close-coupling PI cross section calculations. All these calculations were performed in the Dirac Coulomb R-matrix approximation using the parallel version of the DARC codes [60, 61, 62]. Fourteen continuum orbitals were employed to span the photon energy range of interest and a boundary radius of 29.76 atomic units was necessary to accommodate all the diffuse =5 orbitals of the residual doubly ionized calcium ion.
PI cross section calculations were performed for the ground level and the metastable levels of Ca+. The outer-region electron-ion collision problem was solved (in the resonance region below and between all thresholds) using a suitably chosen fine energy mesh of 8.010-7 Rydbergs ( 10.9 eV) to resolve the fine resonance structure in the photoionisation cross sections. The -coupled Hamiltonian diagonal matrices were adjusted so that the theoretical term energies matched the recommended experimental values of NIST [53].
4 Results and Discussion
The results of the present DARC PI cross-section calculations on the basis of the 93-level and 594-level models are presented in figure 1 for Ca, in figure 2 for Ca, and in figure 3 for Ca. The sizes of the cross sections which were convoluted with Gaussians of 17 meV full width at half maximum (FWHM) show energy-dependent variations of more than five orders of magnitude. Therefore, a logarithmic scale is chosen for the vertical axes. The cross sections obtained by the two different models are similar. Slight shifts in the energy scales, mainly towards lower energies for the more sophisticated calculations, are visible. The (non-resonant) cross sections for direct removal of an electron from Ca+ at energies beyond approximately 42 eV are smaller in the 594cc approximation as compared to the 93cc model. Very broad strong resonances are found at about 33 eV in the ground-level Ca+ PI spectrum and at about 29 eV in the PI spectra of metastable Ca+ ions. The profiles of these ”giant” resonances are jagged in the 93cc approximation and smooth in the 594cc calculations. The smooth profiles agree better with the experimental data as do the level energies of the broadest peaks obtained in the 594cc calculation (see below).


The PI calculations for ground-level Ca ions can be compared with and benchmarked by the absolute measurements carried out by Lyon et al [33]. Their experimental PI spectrum was measured at a resolution of 32 meV. It is displayed in panel a) of figure 4. For comparison, the theoretical results of the 17-level Breit-Pauli R-matrix [19] and the present 594-level DARC calculations are shown in panels b) and c), respectively. The theoretical spectra were convoluted by Gaussians of 32 meV FWHM in order to simulate the experimental photon-energy resolution. At energies up to about 34 eV the main features in the experimental spectrum can be readily associated with corresponding structures in the theoretical spectra. At higher energies it is more difficult to find corresponding features in the experimental and theoretical spectra. Slightly below 38 eV there is another broad, strong peak in the measured cross section which is also visible in the theoretical spectra. It is reproduced better by the present DARC calculation as compared to the Breit-Pauli result. The theoretical data reproduce the dominant features and overall spectral shape found in the experiment of Lyon et al reasonably well but deviate in the details of the smaller resonance contributions.

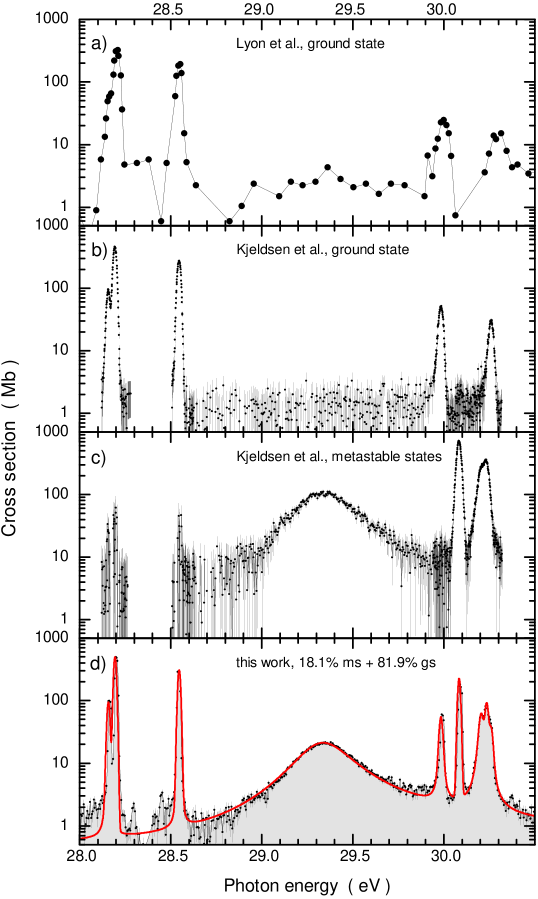
Measurements by Kjeldsen et al [36] on PI of ground-level and metastable Ca+ in the energy range 28.0 to 30.5 eV are key to the normalization of the present experimental spectrum. Their absolute cross sections for PI of ground-level Ca+ are shown in panel b) of figure 5 along with the data obtained in the pioneering experiment by Lyon et al [33] in the same energy range (see panel a) three decades ago. The superior resolution and statistical precision of the Kjeldsen et al data is obvious, emphasising advances in synchrotron radiation sources. A fit to the latter data yields a resolution of 21.2 meV compared to the 32 meV of the earlier measurement. The cross section derived by Kjeldsen et al for the metastable Ca parent-ion term is shown in panel c). A fit to these data suggests an energy resolution of about 28 meV.
The spectra in panels b) and c) were used to normalise the present relative cross sections for PI of a mixture of ground-level and metastable Ca+ parent ions (panel d) as described already in section 2. The present data are superior to the results of Kjeldsen et al with respect to resolution (17 meV) and statistical significance. The contributions of ground-level and metastable parent ions can be clearly and unambiguously distinguished at energies up to 30.13 eV. Only the multi-peak feature at photon energies between 30.14 and 30.30 eV is a mixture of contributions from the and initial terms and has therefore been excluded from the analysis. The comparison of the spectra in panels b), c) and d) provided the fraction of metastable Ca in the parent ion beam used in the present experiments. Since the cross sections obtained by Lyon et al for Ca parent ions are about 11% above the Kjeldsen et al result the present photoion yield data were normalised to the average of the two data sets for ground-level Ca parent ions, i.e. they were multiplied by another factor of 1.055 beyond the correction by the factor derived from the Kjeldsen et al data alone (see section 2 and equation 2).
The consistency of the data analysis is demonstrated by comparing the present PI spectrum for a mixed beam of metastable and ground-level ions (data points in panel d; cross section ) with the weighted sum (the solid (red) line in panel d) of the cross sections (panel b) and (panel c) obtained by Kjeldsen et al [36] with , . For the comparison five and four Voigt profiles, respectively, on top of constant background cross sections were fitted to the spectra for ground-level and metastable Ca+ measured by Kjeldsen et al . With the resonance parameters thus obtained, each of the two spectra, and , could be represented by a smooth function and the resolution adjusted to the 17 meV of the present experiment. There is a slight shift in energy between the present spectrum and the data of Kjeldsen et al . The latter spectrum is shifted with respect to the present experiment by approximately 8 meV towards lower photon energies, well within the calibration uncertainty of meV estimated by Kjeldsen et al and only slightly outside the present range of uncertainty ( meV).
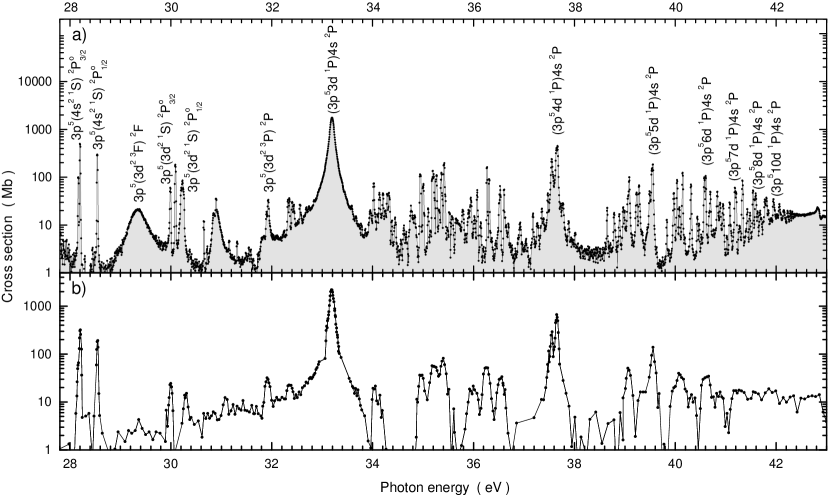
While the data taken by Kjeldsen et al [36] on PI of Ca+ are restricted to the energy range 28.0 to 30.5 eV the pioneering measurement carried out by Lyon et al [33] covers a range from 27 eV to 43 eV. Figure 6 compares the present normalised PI spectrum of Ca+ with the absolute cross sections for PI of ground-level Ca measured by Lyon et al . Since the parent ion beam used in the present experiment consisted of two components, Ca and Ca, the spectrum displayed in panel a) shows peak features arising from the metastable component (fractional abundance 18%) that are not present in the data in panel b) obtained with a pure ground-level Ca+ ion beam. One of the more prominent additional peaks with a large width seen in the present PI spectrum is associated with the term near 29.3 eV which is populated by excitation of metastable Ca ions.
Very strong, broad resonances arising from photoexcitation of ground-level Ca ions are known from the early experimental work of Lyon et al and since the theoretical treatment by Miecznik et al [39]. These ”giant” resonances are associated with Ca autoionizing terms. The strongest of these resonances with is near 33 eV. Its peak is at 2190 Mb in the Lyon et al data and at 1731 Mb in the present spectrum where the ground-level fraction is only 82%. When correcting for this fractional abundance, the present experiment yields a peak cross section of 2114 Mb, only 3.5% below the Lyon et al measurement, and well within their systematic experimental uncertainties. Higher members of the Rydberg sequence are seen in the Lyon et al spectrum () and in the present spectrum shown in panel a) with up to 12. A careful analysis and higher-resolution measurements reveal Rydberg contributions up to (see below). The peak assignments provided in figure 6 are discussed in more detail below in the context of observed level energies and peak widths.
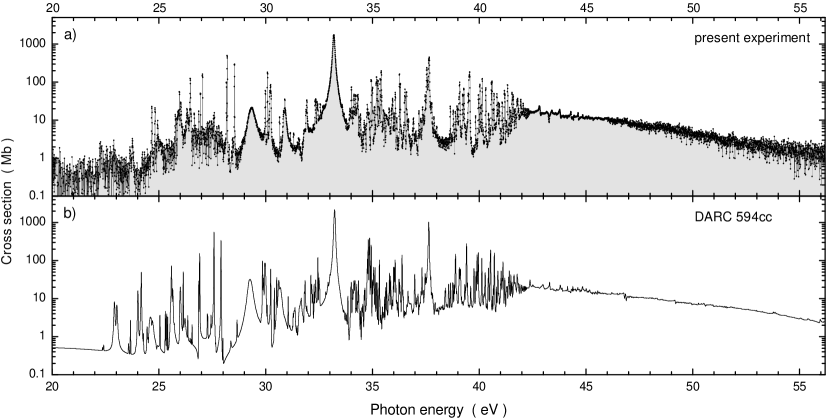
Figure 7 compares the present experimental and theoretical results obtained in the photon energy range 20 to 56 eV. Since the parent ion beam in the experiment was a mixture of Ca ions in their ground level and of Ca in their metastable levels, a weighted sum of the theoretical cross sections for each of these levels had to be constructed to model the experiment. The fractional abundances of ground-level and metastable-term ions have been inferred to be 82% and 18%, respectively (see section 2). For the relative population of the fine-structure components and of the metastable term statistical weights of 4/10 and 6/10, respectively, are a reasonable assumption (see for example [82]). The cross sections , , and for the participating initial levels are known from the present 594-level DARC calculations (see figures 1, 2 and 3). Thus, a model cross section representing the experimental spectrum was calculated as . It was convoluted with a Gaussian distribution of 17 meV FWHM to represent the experimental spectral distribution. The result is the solid line in panel b) of figure 7.
The experimental data show considerable statistical fluctuations in the regions of the lowest and the highest photon energies. This is due to the small cross sections and the resulting small signal rates. Moreover, the photon flux from the grating used in this experiment is low at energies below about 25 eV and above 45 eV. Nevertheless, small resonances with magnitudes of only a few Mb could be still investigated even in the unfavorable photon-energy regions. Larger resonances were observed with excellent statistical quality. The comparison with the DARC calculations shows good overall agreement of the experimental and theoretical cross sections. In particular, the magnitudes, shapes and energies of the most prominent features are well reproduced by theory.
An additional check on the theoretical data is a comparison of the integrated oscillator strength with experiment. The integrated oscillator strength of the PI spectra was calculated using [83],
| (6) |
The total oscillator strength from the present ALS measurements is 5.2 1.6. A similar procedure for the 594-level DARC theoretical cross-section model (from appropriately weighted initial states) gives a value of 5.69. The Breit-Pauli calculations of Sossah et al [19] yield 4.72. Both theory values are well within the experimental uncertainty. The oscillator strengths found in the energy range between 20 and 55 eV by theory and experiment account for most of the total oscillator strength ( 6 for 6 electrons) associated with the subshell. No significant resonance contributions arising from excitation of a electron are expected outside the present energy range.
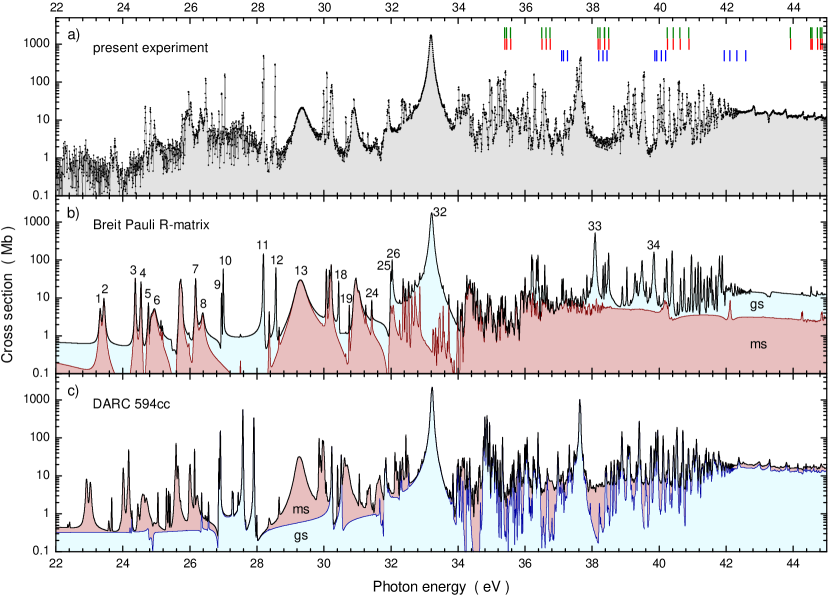
For a more detailed comparison of theory and experiment figure 8 focuses on the energy region where resonances are observed. Different from figure 7 it includes the results obtained by Sossah et al and shows the contributions of the metastable and ground-level parent ions separately. The experimental data in panel a) are the same as those displayed in panel a) of figure 7. Resonance features in the investigated energy range are primarily due to promotions of electrons. Excitation of a electron requires energies of about 50 eV or higher. PI thresholds for populating individual final excited levels of Ca2+ from Ca+ are indicated by three rows of solid vertical bars in the upper right region of panel a). They represent the onsets of processes such as . The lowest row is for direct PI from the ground level, the middle and upper rows of vertical bars are for the and metastable initial levels, respectively, which do not differ much from one another. The threshold energies are given by the minimum ionisation energy of the initial Ca+ level plus the excitation energy from the ground state of Ca2+ to the given excited level. The first sixteen of these levels are discussed in table 1. All energies were taken from the NIST tabulations [53].
All excited levels of Ca2+ that can be reached from one of the Ca+ ground and metastable initial levels are associated with Rydberg sequences of highly excited, autoionizing levels in Ca+. Given the number of PI thresholds in the photon energy range of interest it is understandable that the PI spectrum is very complex, especially near the series limits. Assignment of levels to the observed peak features in the energy range above 34 eV is difficult. Identification was possible mainly at energies lower than 34 eV. Peaks identified by Sossah et al [19] are marked by numbers in panel b) of figure 8 which shows the results of their Breit-Pauli R-matrix calculations combined in a manner identical to the treatment of the present DARC calculations for modeling the present experiment. Not all of the resonances are marked in panel b) because of the limited space available. Complete information is provided in the context of the subsequent figures, tables and the associated text. Panel c) displays the results of the present 594-level DARC calculations modeling the experimental spectrum as described in the context of figure 7.
The individual contributions to the model cross sections arising from the ground level and the metastable excited term are specified in the results of the theoretical work shown in figure 8. In panels b) and c) the light (blue) shaded areas represent the ground-level contributions to the model spectra, the darker-shaded areas represent the metastable-term contributions. In panel b) the ground-level contribution is added to the metastable-term contribution while in panel c) the metastable-term contribution is added to the ground-level contribution. This makes a difference in the appearance of the relative contributions because the logarithmic scale emphasizes small cross sections. The different presentations of the two theory spectra, which are quite similar to one another, make this effect of the nonlinear scale obvious and help assess the magnitudes of the individual contributions. This comparison clarifies which peak features arise from the metastable-term and which from the ground level.
The following figures display enlargements of smaller energy regions of the experimental spectrum on linear scales so that fine details in the spectra are evident.
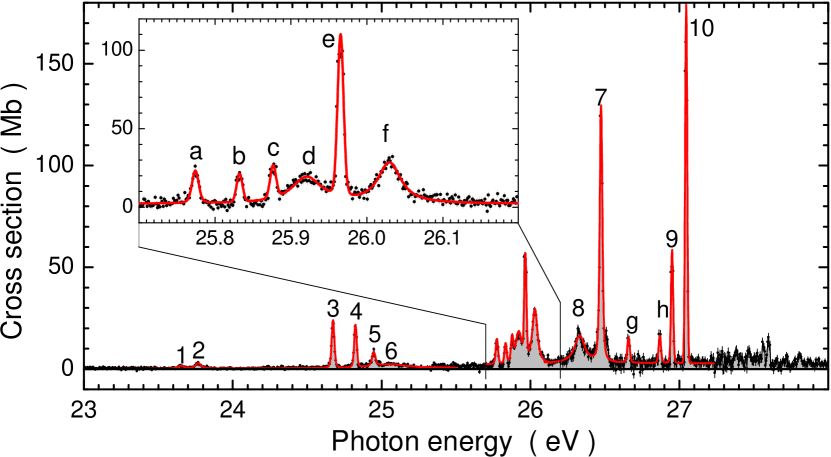
Figure 9 shows the present experimental spectrum in the energy range 23 to 28 eV. Peaks labeled by numbers are associated with level identifications provided by Sossah et al [19]. The assignments are made on the basis of similarities of the present experimental results with the calculated Breit-Pauli model spectrum shown in figure 8. Peaks labeled by letters could not be unambiguously identified. The complete set of cross-section features displayed in this figure has been fitted with eighteen Voigt profiles shown as a solid (red) line. The narrow energy region 25.7 to 26.2 eV was scanned with a resolution of 8.8 meV at 1.5 meV step width. The resulting high-resolution spectrum is shown in the inset. The numbered peaks are identified in table LABEL:Tab:identification where the peak energies, the Lorentzian peak widths inherent in the Voigt profiles, and the resonance strengths are also provided. These results are compared in the same table with the findings of Sossah et al in order to provide an assessment of the quality of their peak assignments. The fitting parameters for the peaks labeled by letters are presented in table LABEL:Tab:letters.
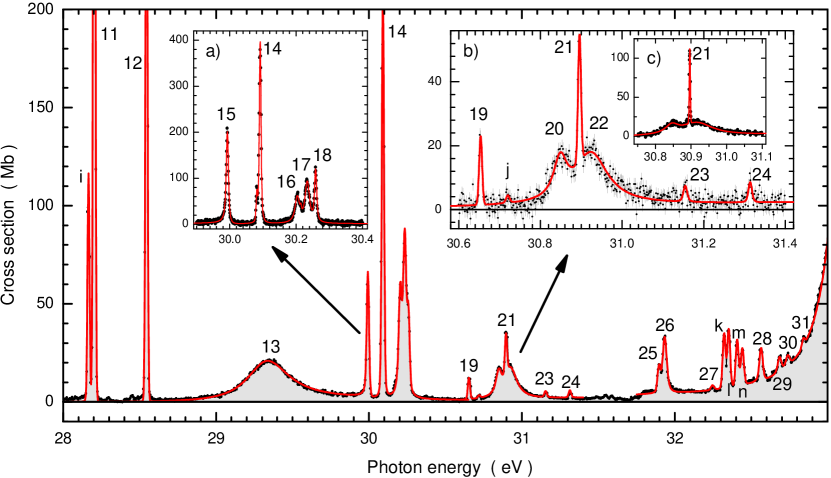
Figure 10 shows the present experimental spectrum in the energy range 28 to 33 eV. As in the preceding figure, peaks are labeled by numbers and letters. The complete set of cross section features displayed in this figure (and partly in figure 11) has been fitted with altogether twenty-eight Voigt profiles and, for the broadest peaks, two Fano profiles [83] convoluted with a Gaussian distribution function [84]. The fit curve is shown as a solid (red) line. The narrow energy region 29.9 to 30.4 eV was scanned with a resolution of 4.6 meV at 0.8 meV step width. The resulting high-resolution spectrum is shown in the left inset.
The energy range around 30.9 eV shows an intriguing resonance feature which suggests interference of a broad and a narrow resonance of the same symmetry. In order to get additional information, the energy region 30.6 to 31.4 eV was scanned at 8.8 meV resolution with a step width of 1.5 meV. At this resolution the interference hypothesis is not compelling. A fit with three Voigt profiles for the central multi-peak feature gives a satisfactory result. This is even more so in the measurement with a further enhanced resolution of 3.3 meV at a step width of 0.5 meV. Clearly, three Voigt profiles give a good fit of the measured multi-peak feature. It is interesting to note, though, that the theoretical calculations of both the present 594-level DARC and particularly the previous Breit-Pauli R-matrix models show clear signatures of interference of peak numbers 15 and 17 which arise solely from the metastable component of the parent ion beam. As for the preceding figure, the peak labels are explained in tables LABEL:Tab:identification and LABEL:Tab:letters, respectively.
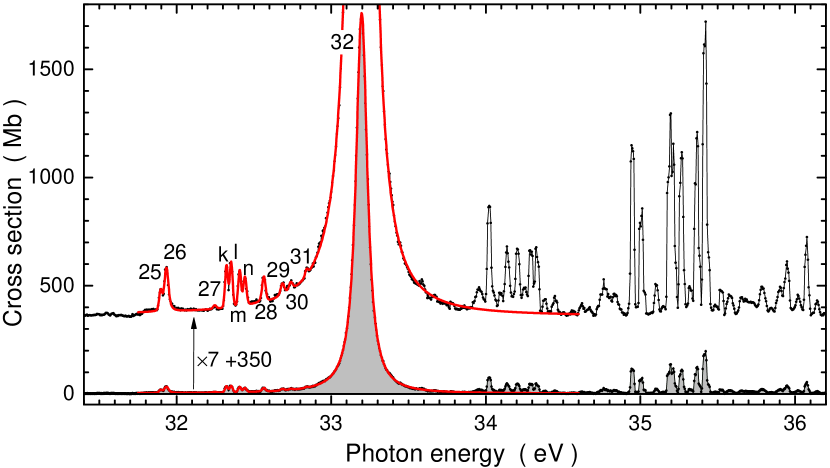
The strong increase of the PI cross section seen at energies beyond 32 eV in figure 10 is the low-energy tail of the well known ”giant resonance” that had been observed previously by Lyon et al . It is associated with the autoionizing term that is excited from the ground level. This resonance dominates the whole spectrum as figure 11 clearly demonstrates. In order to resolve the smaller peaks which still have tens of Mb of cross section, the measured spectrum is multiplied by a factor 7 and shown again in figure 11 with an offset of 350 Mb. At energies beyond 33.5 eV, i. e., beyond the giant resonance the spectrum becomes very complex with many overlapping, unresolved resonances. Therefore, peak identification is restricted in the following to some of the more outstanding higher-energy features. The energy region below 33.5 eV is still sufficiently simple that a good fraction of the observed peaks can be identified. The first half of the spectrum displayed in figure 11 has been fitted with eleven Voigt profiles plus a Fano profile convoluted with a Gaussian [84] representing the ”giant resonance”. Their energies and widths are provided in tables LABEL:Tab:identification and LABEL:Tab:letters.
While the fits give good representations of the experimental spectrum, one has to bear in mind that the broad peaks labeled with numbers 13 and 32 are not isolated single resonances. They are rather associated with unresolved (peak 13) and (peak 32) fine-structure levels. Moreover, resonance 13 can be excited from both metastable levels, Ca and Ca. Thus, the two broad peaks are mixtures of several unresolved individual resonances and hence fitting them with a single Gaussian convoluted Fano profile [84] each provides only an idea of the natural widths and the Fano asymmetry parameters of the individual resonances. This is particularly true for the resonance (13) where theory predicts the individual components to be up to 90 meV apart. The situation is better in the case of peak 32 which is populated from a single level, the ground level of the Ca+ ion. The fine-structure splitting is of the order of only 10 meV which is small compared to the Lorentzian width of meV found by fitting the experiment. The error bar of 1 meV is only the statistical uncertainty resulting from the fit of two fine-structure resonances with one Gaussian convoluted Fano profile [84]. The Fano asymmetry parameters found for peaks numbered 13 and 32 are q=-19.8 and q=-174.7, respectively. Because of the blending of several resonances these numbers are only indicative for the presence of interference between direct and resonant PI channels associated with the experimental peak structures.
As mentioned above, the numbers and letters provided as labels in the preceding figures are explained in tables LABEL:Tab:identification and LABEL:Tab:letters, respectively. From the fits to the peaks in those figures the resonance parameters were extracted. The peak areas are directly related to the oscillator strengths for photon absorption populating the associated excited levels. For an isolated resonance the integration in equation 6 has to be performed over the complete energy range to obtain the peak area from which the oscillator strength follows. Resonance energies, Lorentzian widths and resonance strengths found for the labeled peaks in figures 9, 10 and 11 are provided in the tables LABEL:Tab:identification and LABEL:Tab:letters together with the resonance energies and widths of the resonances identified by Sossah et al [19]. Extracting oscillator strengths requires knowledge of individual fractional abundances of Ca+ ions in the ground level and the metastable levels contributing to each peak feature. Since many of the peak features are blends of several fine-structure components a detailed level-to-level assignment of peaks is not possible and hence, the oscillator strength cannot be recovered from the observed resonance strengths.
Uncertainties of the resonance strengths are directly related to the uncertainties quoted for the present cross sections, i.e., they are of the order of % and may be larger because of statistical uncertainties. Many of the Lorentzian widths provided in the tables have large relative uncertainties. This is especially true when the fitted Lorentzian widths are comparable to or smaller than the photon energy bandwidths used in the experiments. The assignment of transitions (from a given initial level to an excited autoionizing level) to the experimental peaks is guided by the similarities seen in the experimental spectrum and the theory model spectrum displayed in figure 8. The knowledge of the initial level of a given transition from theory and partly also from the existing experiments is the key to an appropriate assignment. Similarities of the measured and calculated resonance energies and widths provide additional confidence in the level assignments inferred from the work by Sossah et al [19] for the present experimental resonances.
| no. | Eth | transition | Eres | Eres | S | S | |||
|---|---|---|---|---|---|---|---|---|---|
| eV | meV | eV | meV | meV | meV | Mb eV | Mb eV | ||
| 1 | 23.33 | 42.3 | 2D | 23.652 | 11 | 42 | 15 | 0.100 | 0.087 |
| 2 | 23.44 | 40.9 | 2D | 23.767 | 7 | 38 | 12 | 0.176 | 0.097 |
| 2 | 23.46 | 40.9 | 2D | 23.767 | 7 | 38 | 12 | 0.176 | 0.097 |
| 3 | 24.37 | 15.4 | 2D | 24.673 | 6 | 7 | 11 | 0.613 | 0.19 |
| 4 | 24.53 | 14.2 | 2D | 24.824 | 21 | 5 | 11 | 0.501 | 0.17 |
| 4 | 24.55 | 14.2 | 2D | 24.824 | 21 | 5 | 11 | 0.501 | 0.17 |
| 5 | 24.76 | 17.7 | 2D | 24.947 | 7 | 16 | 13 | 0.256 | 0.11 |
| 5 | 24.77 | 17.7 | 2D | 24.947 | 7 | 16 | 13 | 0.256 | 0.11 |
| 6 | 24.84 | 119.6 | 2D | 25.063 | 23 | 232 | 83 | 0.669 | 0.27 |
| 6 | 24.85 | 119.6 | 2D | 25.063 | 23 | 232 | 83 | 0.669 | 0.27 |
| 6 | 24.94 | 125.1 | 2D | 25.063 | 23 | 232 | 83 | 0.669 | 0.27 |
| 7 | 26.17 | 17.6 | 2D | 26.474 | 7 | 8 | 11 | 3.34 | 1.1 |
| 8 | 26.37 | 75.3 | 2D | 26.330 | 40 | 78 | 25 | 1.69 | 0.74 |
| 8 | 26.39 | 75.3 | 2D | 26.330 | 40 | 78 | 25 | 1.69 | 0.74 |
| 9 | 26.95 | 2.1 | 2S | 26.951 | 10 | 1 | 11 | 1.04 | 0.35 |
| 10 | 27.00 | 1.7 | 2S | 27.046 | 6 | 0 | 11 | 3.09 | 0.94 |
| 11 | 28.20 | 2.3 | 2S | 28.203111NIST energy is 28.1995 eV [53] | 5 | 0 | 11 | 8.93 | 2.7 |
| 12 | 28.57 | 1.8 | 2S | 28.545222NIST energy is 28.5441 eV [53] | 5 | 0 | 11 | 5.52 | 1.7 |
| 13 | 29.24 | 251.6 | 2D | 29.321333found at 29.33 eV by Kjeldsen et al [36] | 11 | 335 | 24 | 10.9 | 3.3 |
| 13 | 29.25 | 251.6 | 2D | 29.321 | 11 | 335 | 24 | 10.9 | 3.3 |
| 13 | 29.33 | 263.5 | 2D | 29.321 | 11 | 335 | 24 | 10.9 | 3.3 |
| 14 | 30.06 | 4.2 | 2D | 30.091 | 5 | 3 | 11 | 3.17 | 0.95 |
| 14 | 30.07 | 0.5 | 2D | 30.091 | 5 | 3 | 11 | 3.17 | 0.95 |
| 14 | 30.08 | 4.2 | 2D | 30.091 | 5 | 3 | 11 | 3.17 | 0.95 |
| 14 | 30.09 | 0.5 | 2D | 30.091 | 5 | 3 | 11 | 3.17 | 0.95 |
| 15 | 30.17 | 5.6 | 2S | 29.993444found at 29.99 eV by Kjeldsen et al [36] | 5 | 6 | 11 | 2.24 | 0.67 |
| 16 | 30.20 | 12.3 | 2D | 30.203 | 6 | 15 | 11 | 1.36 | 0.41 |
| 17 | 30.23 | 10.9 | 2D | 30.233 | 6 | 15 | 11 | 2.18 | 0.66 |
| 17 | 30.24 | 10.9 | 2D | 30.233 | 6 | 15 | 11 | 2.18 | 0.66 |
| 18 | 30.45 | 5.3 | 2S | 30.258555found at 30.26 eV by Kjeldsen et al [36] | 7 | 5 | 11 | 1.16 | 0.41 |
| 19 | 30.78 | 0.2 | 2D | 30.653 | 10 | 1 | 11 | 0.195 | 0.063 |
| 20 | 30.91 | 63.2 | 2D | 30.846 | 14 | 43 | 12 | 0.733 | 0.25 |
| 20 | 30.93 | 63.2 | 2D | 30.846 | 14 | 43 | 12 | 0.733 | 0.25 |
| 21 | 30.95 | 0.2 | 2D | 30.896 | 6 | 1 | 11 | 0.35 | 0.11 |
| 21 | 30.97 | 0.2 | 2D | 30.896 | 6 | 1 | 11 | 0.35 | 0.11 |
| 22 | 30.99 | 27.8 | 2D | 30.917 | 25 | 107 | 15 | 2.69 | 1.1 |
| 22 | 31.04 | 96.8 | 2D | 30.917 | 25 | 107 | 15 | 2.69 | 1.1 |
| 22 | 31.10 | 51 | 2D | 30.917 | 25 | 107 | 15 | 2.69 | 1.1 |
| 23 | 31.25 | 0.7 | 2D | 31.155 | 16 | 5 | 12 | 0.07 | 0.04 |
| 24 | 31.42 | 2.7 | 2D | 31.314 | 16 | 3 | 12 | 0.08 | 0.09 |
| 24 | 31.43 | 2.7 | 2D | 31.314 | 16 | 3 | 12 | 0.08 | 0.09 |
| 25 | 32.02 | 12.3 | 2S | 31.896 | 10 | 1 | 11 | 0.285 | 0.093 |
| 26 | 32.07 | 10.9 | 2S | 31.934 | 6 | 18 | 11 | 1.27 | 0.39 |
| 27 | 32.26 | 3.2 | 2D | 32.245 | 16 | 5 | 17 | 0.067 | 0.035 |
| 28 | 32.52 | 2.3 | 2D | 32.565 | 14 | 8 | 11 | 0.522 | 0.21 |
| 28 | 32.54 | 3.7 | 2D | 32.565 | 14 | 8 | 11 | 0.522 | 0.21 |
| 29 | 32.63 | 42.8 | 2D | 32.685 | 44 | 12 | 13 | 0.276 | 0.12 |
| 29 | 32.64 | 40.5 | 2D | 32.685 | 44 | 12 | 13 | 0.276 | 0.12 |
| 30 | 32.75 | 3.5 | 2D | 32.738 | 29 | 13 | 14 | 0.198 | 0.098 |
| 31 | 32.86 | 3.9 | 2D | 32.840 | 61 | 1 | 17 | 0.095 | 0.075 |
| 32 | 33.21 | 69.7 | 2S | 33.197 | 5 | 83 | 11 | 239 | 72 |
| 32 | 33.22 | 72.6 | 2S | 33.197 | 5 | 83 | 11 | 239 | 72 |
| 32 | present 594cc DARC calculation: | 33.224 | 60 | 225.8 | |||||
| 33a | 2S | 37.643 | 16 | 17 | 11 | 13.2 | 4.1 | ||
| 33b | 2S | 37.669 | 16 | 12 | 11 | 12.3 | 3.8 | ||
| 33 | present 594cc DARC calculation: | 37.641 | 38 | 63.25 | |||||
| 34a | 2S | 39.534 | 16 | 2 | 12 | 3.31 | 1.1 | ||
| 34b | 2S | 39.558 | 16 | 2 | 12 | 4.16 | 1.3 | ||
| label | Eres | Eres | S | S | ||
|---|---|---|---|---|---|---|
| eV | meV | meV | meV | Mb eV | Mb eV | |
| a | 25.774 | 12 | 3 | 11 | 0.256 | 0.085 |
| b | 25.832 | 22 | 1 | 11 | 0.173 | 0.064 |
| c | 25.877 | 14 | 1 | 11 | 0.21 | 0.076 |
| d | 25.921 | 14 | 45 | 13 | 1.21 | 0.42 |
| e | 25.965 | 6 | 1 | 11 | 1.05 | 0.32 |
| f | 26.030 | 7 | 34 | 12 | 1.42 | 0.46 |
| g | 26.659 | 40 | 6 | 16 | 0.29 | 0.19 |
| h | 26.869 | 33 | 4 | 16 | 0.298 | 0.18 |
| i | 28.166 | 5 | 1 | 11 | 1.97 | 0.60 |
| j | 30.720 | 80 | 3 | 14 | 0.029 | 0.026 |
| k | 32.322 | 7 | 1 | 11 | 0.663 | 0.20 |
| l | 32.353 | 7 | 1 | 11 | 0.708 | 0.22 |
| m | 32.408 | 33 | 1 | 11 | 0.563 | 0.21 |
| n | 32.442 | 10 | 4 | 11 | 0.508 | 0.16 |
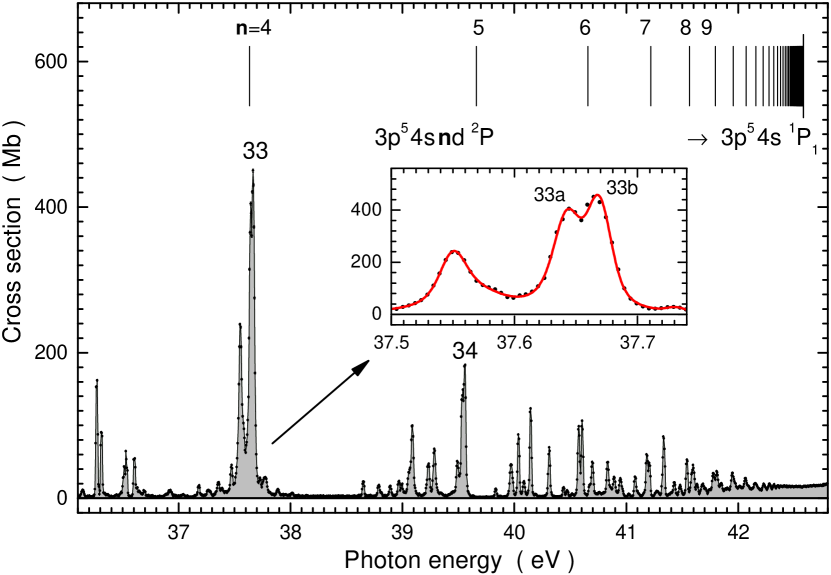
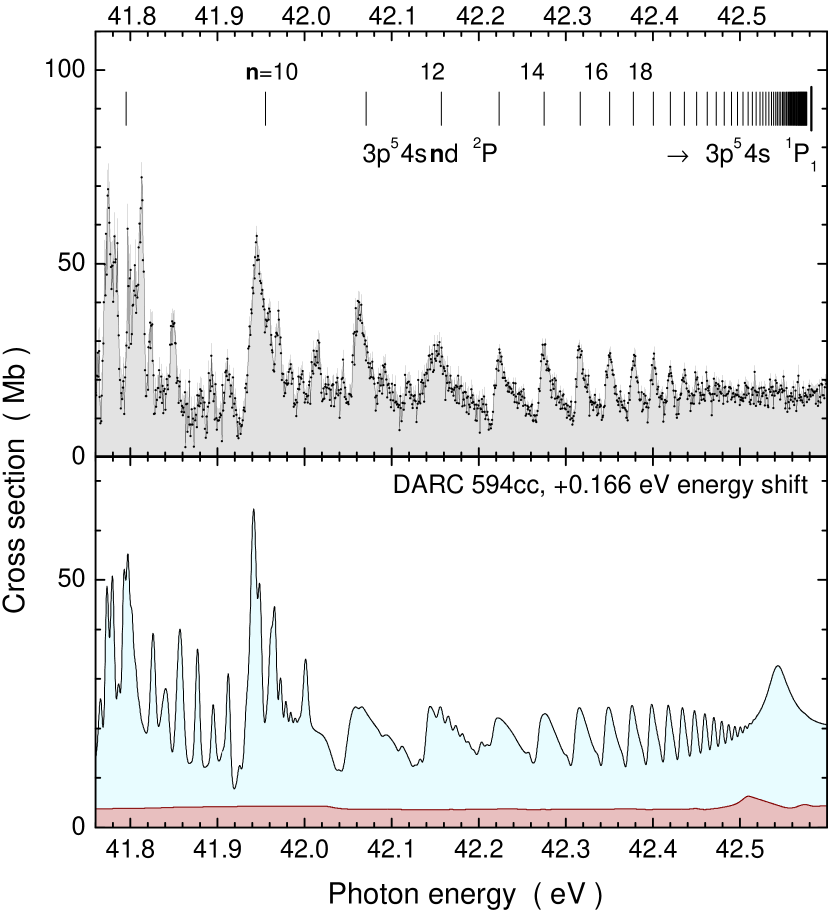
Figure 12 shows the present experimental spectrum at a resolution of 17 meV in the energy range 36.1 to 42.8 eV. At energies near 42 eV the high- members of a Rydberg sequence are clearly evident. This observation is confirmed by a measurement with better resolution (4.6 meV) covering the energy range 41.76 to 42.60 eV (see figure 13). Clearly, Rydberg resonances with principal quantum numbers up to are resolved. The energies of the peaks associated with can be determined straightforwardly. Peaks with lower principal quantum numbers show substantial fine structure and may be obscured by resonances from other overlapping sequences so that a determination of their energies is more difficult. The peak energies for can be fitted with a Rydberg formula considering a quantum defect that is independent of the principal quantum number
| (7) |
with . Actually, it is this fit that also determines which principal quantum numbers are associated with the individual Rydberg resonances. The best fit was obtained with resulting in eV. The series limit is the minimum energy required to lift one of the Ca+ electrons to the continuum leaving behind a Ca2+ ion possibly in an excited state. Since it is not known a priori whether the series is associated with an initial ground-level or metastable Ca+ ion, all the threshold energies shown as vertical bars in figure 8 have to be considered. These energies follow from the NIST tables [53] of levels of Ca+ and Ca2+ ions and are known with high accuracy. The threshold energy that matches the experimentally derived eV is that of the level populated by removing a electron from ground-level Ca. The next closest level would be at 42.324 eV, which is 258 meV below the derived . This is far outside the uncertainty of meV of the present energy scale and that of the fitting procedure. With the knowledge that the initial level is and the fact that the photon-induced dipole-allowed transitions populate solely levels it follows that a electron is transferred to a or a sublevel in the first step of the photoionisation process, the more likely channel being , while cannot be excluded. The second step is an Auger decay.
On the basis of the fit results, the sequence of Rydberg energies can be extrapolated towards lower values (). The upper panel of figure 13 shows that the extrapolated energies and fit rather well to peak features in the high-resolution measurement. In figure 12 the energies are indicated for down to and, indeed, they match prominent peak features in the experimental spectrum. The relatively broad, large peak (33) with is undoubtedly associated with the Ca term. The extrapolated fit of to is about 30 meV below the measured peak position. The energy deviation is understandable, considering the relatively low principal quantum number for which the quantum defect can no longer be expected to be independent of . The peak with the next lower is the ”giant resonance” with . The associated energy from the fit is 32.439 eV with the constant quantum defect . This is about 0.76 eV below the experimental peak position. In order to match the measured resonance energy the quantum defect for has to be adjusted to which is reasonable considering the low principal quantum number.
The lower panel of figure 13 displays the result of the present 594-level DARC calculation in the identical energy range. However, the theoretical spectrum was shifted by +0.166 eV towards higher photon energies in order to match the experimental peak features. The agreement of the (shifted) calculated peak positions and shapes with the experiment is remarkable. Only the resonance feature predicted near 42.55 eV is not exactly there in the experimental spectrum. This peak is rather found near 42.8 eV in the experiment (see figure 14). The theoretical spectrum is composed of relatively smooth cross section contributions arising from direct PI processes and of resonance contributions both predominantly associated with excitation of ground-level Ca+ ions. This is in accord with the experimental assignment of the Rydberg series to transitions.
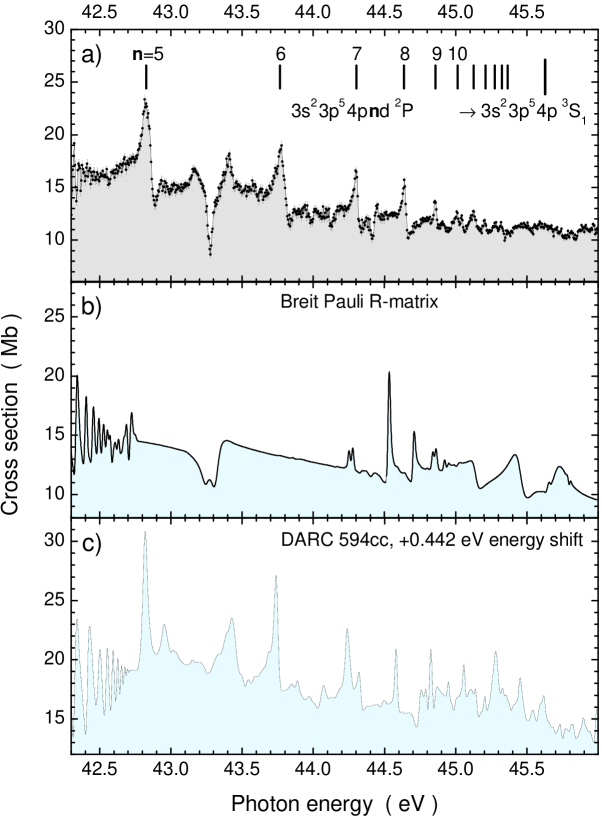
At energies beyond 42.6 eV further Rydberg series are observed in the measurement. Panel a) of figure 14 displays the present experimental spectrum at 17 meV energy resolution in the energy range 42.3 to 46.0 eV. The observed resonances have distinct Fano-type line profiles. Beside a pronounced window resonance near 43.28 eV, a number of resonances are present with an energy pattern of a Rydberg sequence starting with an asymmetric line at about 42.85 eV. A fit to this resonance suggests a Fano asymmetry parameter and a natural line width of meV. A tentative assignment of this resonance to a term populated by a double-excitation transition starting from ground level Ca+ is in agreement with the further findings of energies along the sequence with . The fit of the experimental resonance energies with a Rydberg formula of the type given by equation 7 yields a constant quantum defect and a series limit eV. A comparison with the available photoionisation thresholds in the same manner as discussed above for the two preceding figures shows that the series limit is associated with the Ca level at 45.619 eV [53] which can be reached from the ground level of Ca+ by removing a electron and simultaneously exciting the electron to the subshell. Hence the Rydberg sequence is most likely associated with double excitations .
The theoretical spectra obtained from the Breit-Pauli R-matrix approach and by the present 594-level DARC calculations are shown in panels b) and c) of figure 14, respectively. The resonance features in this energy range are due to photoexcitation of ground-level Ca+ ions to autoionizing levels. The calculation by Sossah et al shows the end of the Rydberg sequence identified from figures 12 and 13 near 42.5 eV. Apart from that there is little resemblance to the experimental spectrum, except for a double-window resonance feature near 43.3 eV which corresponds in energy to the distinct single window resonance seen in the experiment. The DARC calculation does not show this window resonance but features a Rydberg sequence whose resonance energies match the experimental peak positions - provided the theoretical spectrum is shifted up in photon energy by 0.442 eV.
5 Summary and Conclusions
High-resolution photoionisation cross-section measurements on the Ca+ ion at a resolution of 17 meV were carried out at the ALS synchrotron radiation facility. In smaller energy ranges the resolving power was substantially increased with photon energy bandpass values as small as 3.3 meV. The energy scale of the experiment was calibrated to within meV. On the basis of the resonance identifications provided by Sossah et al [19] it was possible to assign the appropriate spectroscopic notations to the most important peaks observed in the present experiment. The structures in the measured and calculated spectra are similar and resonances from theory and experiment can be associated, although resonance energies do not match perfectly. An additional criterion for the identification of specific autoionising levels is provided by the comparison of theoretical and experimental natural linewidths of resonances.
Asymmetries in resonance cross sections have been observed in the experiments indicating interference of specific PI channels. The extraction of individual Fano asymmetry parameters, natural line widths and lifetimes from the measurements is hampered by the blending of resonance features associated with experimentally unresolvable fine-structure contributions.
When compared with the present measurements, large-scale DARC calculations show suitable agreement over the photon energy region investigated and reproduce the main features in the experimental spectrum. Some minor discrepancies are found between the theoretical results obtained from the 594-level DARC collision model and the measurements. These are attributed to the limitations of electron-correlation incorporated in the present 594-level collision model. Larger-scale calculations, beyond the scope of the present investigation would likely be required to resolve this.
References
References
- [1] Müller A 2009 J. Phys. Conf. Ser. 194 012002
- [2] Kaldun A, Blättermann A, Stooß V, Donsa S, Wei H, Pazourek R, Nagele S, Ott C, Lin C D, Burgdörfer J and Pfeifer T 2016 Science 354 738–741
- [3] Connerade J P and Lane A M 1988 Reports on Progress in Physics 51 1439
- [4] Labzowsky L N and Nefiodov A V 1994 Phys. Rev. A 49 236–238
- [5] Gorczyca T W, Pindzola M S, Robicheaux F and Badnell N R 1997 Phys. Rev. A 56 4742–4745
- [6] Schippers S, Bartsch T, Brandau C, Linkemann J, Müller A, Saghiri A A and Wolf A 1998 Hyperfine Interact. 114 273–276
- [7] Schippers S, Bartsch T, Brandau C, Linkemann J, Müller A, Saghiri A A and Wolf A 1999 Phys. Rev. A 59 3092–3094
- [8] Schippers S, Bartsch T, Brandau C, Gwinner G, Linkemann J, Müller A, Saghiri A A and Wolf A 1998 J. Phys. B: At. Mol. Opt. Phys 31 4873–4886
- [9] Schippers S, Kieslich S, Müller A, Gwinner G, Schnell M, Wolf A, Bannister M, Covington A and Zhao L B 2002 Phys. Rev. A 65 042723
- [10] Schippers S, Müller A, Ricz S, Bannister M E, Dunn G H, Bozek J D, Schlachter A S, Hinojosa G, Cisneros C, Aguilar A, Covington A M, Gharaibeh M F and Phaneuf R A 2002 Phys. Rev. Lett. 89 193002
- [11] Schippers S, Müller A, Ricz S, Bannister M E, Dunn G H, Schlachter A S, Hinojosa G, Cisneros C, Aguilar A, Covington A M, Gharaibeh M F and Phaneuf R A 2003 Phys. Rev. A 67 032702
- [12] Schippers S, Müller A, Phaneuf R A, van Zoest T, Álvarez I, Cisneros C, Emmons E D, Gharaibeh M F, Hinojosa G, Schlachter A S and Scully S W J 2004 J. Phys. B: At. Mol. Opt. Phys 37 L209–L216
- [13] Müller A, Schippers S, Covington A M, Aguilar A, Hinojosa G, Phaneuf R A, Sant’Anna M M, Schlachter A S, Bozek J D and Cisneros C 2001 Photoionization of Ca+ Ions by Synchrotron Radiation XXII International Conference on Photonic, Electronic, and Atomic Collisions, Santa Fe, New Mexico, USA, July 18-24, 2001, Abstracts of Contributed Papers ed Datz S, Bannister M E, Krause H F, Saddiq L H, Schultz D and Vane C R (Princeton, New Jersey: Rinton Press) p 52
- [14] Gharaibeh M F, Aguilar A, Covington A M, Emmons E D, Scully S W J, Phaneuf R A, Müller A, Bozek J D, Kilcoyne A L D, Schlachter A S, Àlvarez I, Cisneros C and Hinojosa G 2011 Phys. Rev. A 83(4) 043412
- [15] Sossah A M, Zhou H L and Manson S T 2008 Phys. Rev. A 78 053405
- [16] Nikolić D, Gorczyca T W and Badnell N R 2009 Phys. Rev. A 79 012703
- [17] Nikolić D, Gorczyca T W, Korista K T and Badnell N R 2010 Astron. Astrophys. 516
- [18] Sossah A M, Zhou H L and Manson S T 2010 Phys. Rev. A 82 043416
- [19] Sossah A M, Zhou H L and Manson S T 2012 Phys. Rev. A 86 023403
- [20] Wang H, Jianga G, Fan Q, Li X and Duan J 2015 Eur. Phys. J. D 69 150
- [21] Tayal S S and Zatsarinny O 2015 Phys. Rev. A 91 013413
- [22] Hobbs L M, Lagrange-Henri A M, Ferlet R, Vidal-Madjar A and Welty D E 1988 Astrophys. J. 334 L41 – L44
- [23] Welty D E, Morton D C and Hobbs L M 1996 Astrophys. J. Suppl. Ser. 106
- [24] West K A, Pettini M, Penston M V, Blades J C and Morton D C 1985 Mon. Not. R. Astron. Soc. 215 481 – 497
- [25] Hall J C 2008 Living Rev. Solar Phys. 5 2
- [26] Linsky J L and Avrett E H 1970 Pub. Astron. Soc. Pac. 82 169 – 248
- [27] Rowe A K 1992 Photoionization of Ca ii by hydrogen Lyman- Seventh Cambridge Workshop on Cool Stars, Stellar Systems and the Sun (ASP Conf. Series vol 26) ed Giampapa M S and Bookbinder J A (San Francisco, CA: Astronomical Society of the Pacific) pp 561 – 563
- [28] Beck C, Schmidt W, Kentischer T and Elmore D 2005 Astron. Astrophys. 437 1159 – 1167
- [29] Beck C, Rezaei R and Puschmann K G 2012 Astron. Astrophys. 544 A46
- [30] Beck C, Rezaei R and Puschmann K G 2013 Astron. Astrophys. 556 A127
- [31] Gal-Yam A 2012 Science 337 927 – 932
- [32] Sonntag B F, Crome C L, Bridges J M, McIlrath T J and Lucatorto T B 1986 Laser-XUV excited state spectroscopy (AIP Conference Proceedings vol 147) (American Institute of Physics)
- [33] Lyon I C, Peart B, Dolder K and West J B 1987 J. Phys. B: At. Mol. Opt. Phys 20 1471–1477
- [34] Bizau J M, Cubaynes D, Richter M, Wuilleumier F J, Obert J, Putaux J C, Morgan T J, Källne E, Sorensen S and Damany A 1991 Phys. Rev. Lett. 67 576–579
- [35] Gottwald A, Anger S, Bizau J M, Rosenthal D and Richter M 1997 Phys. Rev. A 55 3941–3944
- [36] Kjeldsen H, Folkmann F, Innocenti F, Zuin L and Hansen J E 2002 J. Phys. B: At. Mol. Opt. Phys 35 L375–L380
- [37] Hansen J E, Kjeldsen H, Folkmann F, Martins M and West J B 2007 J. Phys. B: At. Mol. Opt. Phys 40 293–327
- [38] Altun Z and Kelly H P 1985 Phys. Rev. A 31 3711 – 3717
- [39] Miecznik G, Berrington K A, Burke P G and Hibbert A 1990 J. Phys. B: At. Mol. Opt. Phys 23 3305 – 3314
- [40] Ivanov V K and West J B 1993 J. Phys. B: At. Mol. Opt. Phys 26 2099 – 2113
- [41] Cowan R D 1981 The Theory of Atomic Structure and Spectra (Berkeley: University of California Press)
- [42] Hibbert A and Hansen J E 1999 J. Phys. B: At. Mol. Opt. Phys 32 4133–4151
- [43] Jiang D Q, Liu J C, Yang X D and Lu P F 2001 Phys. Lett. A 288 95 – 100
- [44] Phaneuf R A, Havener C C, Dunn G H and Müller A 1999 Rep. Prog. Phys. 62 1143–1180
- [45] Schippers S, Kilcoyne A L D, Phaneuf R A and Müller A 2016 Contemp. Phys. 57 215–229
- [46] Müller A 2015 Atoms 3 120–161
- [47] Müller A 2015 Phys. Scr. 90 054004
- [48] Müller A, Schippers S, Hellhund J, Kilcoyne A L D, Phaneuf R A and McLaughlin B M 2017 J. Phys. B: At. Mol. Opt. Phys 50 085007
- [49] Covington A M, Aguilar A, Covington I R, Gharaibeh M F, Hinojosa G, Shirley C A, Phaneuf R A, Álvarez I, Cisneros C, Dominguez-Lopez I, Sant’Anna M M, Schlachter A S, McLaughlin B M and Dalgarno A 2002 Phys. Rev. A 66 062710
- [50] Menzinger M and Wåhlin L 1969 Rev. Sci. Instrum. 40 102 – 105
- [51] Shao H, Huang Y, Guan H, Qian Y and Gao K 2016 Phys. Rev. A 94 042507
- [52] Barton P A, Donald C J S, Lucas D M, Stevens D A, Steane A M and Stacey D N 2000 Phys. Rev. A 62 032503
- [53] Kramida A E, Ralchenko Y, Reader J and NIST ASD Team 2017 NIST Atomic Spectra Database (ver. 5.4) online available from http://physics.nist.gov/asd National Institute of Standards and Technology, Gaithersburg, MD.
- [54] Müller A, Schippers S, Hellhund J, Holste K, Kilcoyne A L D, Phaneuf R A, Ballance C P and McLaughlin B M 2015 J. Phys. B: At. Mol. Opt. Phys 48 235203
- [55] Grant I P 2007 Relativistic Quantum Theory of Atoms and Molecules: Theory and Computation Springer Series on Atomic, Optical, and Plasma Physics (New York: Springer)
- [56] Ballance C P and Griffin D C 2006 J. Phys. B: At. Mol. Opt. Phys. 39 3617
- [57] Fivet V, Bautista M A and Ballance C P 2012 J. Phys. B: At. Mol. Opt. Phys. 45 035201
- [58] Norrington P H and Grant I P 1987 J. Phys. B: At. Mol. Phys. 20 4869– 4881
- [59] Wijesundera W P, Parpia F A, Grant I P and Norrington P H 1991 J. Phys. B: At. Mol. Opt. Phys. 24 1803
- [60] DARC codes URL http://connorb.freeshell.org
- [61] McLaughlin B M and Ballance C P 2012 J. Phys. B: At. Mol. Opt. Phys. 45 085701
- [62] McLaughlin B M and Ballance C P 2012 J. Phys. B: At. Mol. Opt. Phys. 45 095202
- [63] McLaughlin B M and Ballance C P 2015 Petascale computations for large-scale atomic and molecular collisions Sustained Simulated Performance 2014 Proceedings of the joint Workshop on Sustained Simulation Performance, University of Stuttgart (HLRS) and Tohoku University, 2014 ed Resch M M, Kovalenko Y, Fotch E, Bez W and Kobaysahi H (Cham Heidelberg New York Dordrecht London: Springer International Publishing) pp 173 – 185
- [64] McLaughlin B M, Ballance C P, Pindzola M S and Müller A 2015 PAMOP: petascale atomic, molecular and optical collisions High Performance Computing in Science and Engineering ’14 ed Nagel W E, Kröner D H and Resch M M (Cham Heidelberg New York Dordrecht London: Springer International Publishing) pp 47 – 61
- [65] McLaughlin B M, Ballance C P, Pindzola M S, Schippers S and Müller A 2016 PAMOP Project: Petaflop Computations in Support of Experiments High Performance Computing in Science and Engineering ’15 Transactions of the High Performance Computing Center, Stuttgart (HLRS) 2015 ed Nagel W E, Kröner D H and Resch M M (Cham Heidelberg New York Dordrecht London: Springer International Publishing) pp 51 – 74
- [66] McLaughlin B M, Ballance C P, Pindzola M S, Stancil P C, Schippers S and Müller A 2017 PAMOP Project: Computations in Support of Experiments and Astrophysical Applications High Performance Computing in Science and Engineering ’16 Transactions of the High Performance Computing Center, Stuttgart (HLRS) 2016 ed Nagel W E, Kröner D H and Resch M M (Cham Heidelberg New York Dordrecht London: Springer International Publishing) pp 33 – 48
- [67] Macaluso D A, Aguilar A, Kilcoyne A L D, Red E C, Bilodeau R C, Phaneuf R A, Sterling N C and McLaughlin B M 2015 Phys. Rev. A 92 063424
- [68] Hinojosa G, Covington A M, Alna’Washi G A, Lu M, Phaneuf R A, Sant’Anna M M, Cisneros C, Álvarez I, Aguilar A, Kilcoyne A L D, Schlachter A S, Ballance C P and McLaughlin B M 2012 Phys. Rev. A 86 063402
- [69] Müller A, Schippers S, Esteves-Macaluso D, Habibi M, Aguilar A, Kilcoyne A L D, Phaneuf R A, Ballance C P and McLaughlin B M 2014 J. Phys. B: At. Mol. Opt. Phys. 47 215202
- [70] Kennedy E T, Mosnier J P, Kampen P V, Cubaynes D, Guilbaud S, Blancard C, McLaughlin B M and Bizau J M 2014 Phys. Rev. A 90 063409
- [71] Tyndall N B, Ramsbottom C A, Ballance C P and Hibbert A 2016 Mon. Not. R. Astron. Soc. 456 366 – 373
- [72] Tyndall N B, Ramsbottom C A, Ballance C P and Hibbert A 2016 Mon. Not. R. Astron. Soc. 462 3350 – 3360
- [73] Barthel M, Flesch R, Rühl E and McLaughlin B M 2015 Phys. Rev. A 91 013406
- [74] McLaughlin B M 2017 Mon. Not. R. Astron. Soc. 464 1990 – 1999
- [75] Hinojosa G, Davis V T, Covington A M, Thompson J S, Kilcoyne A L D, Antillón A, Hernández E M, Calabrese D, Morales-Mori A, Juárez A M, Windelius O and McLaughlin B M 2017 Mon. Not. R. Astron. Soc. 470 4048 – 4060
- [76] Ballance C and McLaughlin B M 2015 J. Phys. B: At. Mol. Opt. Phys. 48 085201
- [77] McLaughlin B M, Ballance C P, Schippers S, Hellhund J, Kilcoyne A L D, Phaneuf R A and Müller A 2016 J. Phys. B: At. Mol. Opt. Phys 49 065201
- [78] Turkington M D, Ballance C P, Hibbert A and Ramsbottom C A 2016 Phys. Rev. A 94 022508
- [79] Dyall K G, Grant I P, Johnson C T, Parpia F A and Plummer E P 1989 Comput. Phys. Commun. 55 425
- [80] Parpia F A, Froese-Fischer C and Grant I P 2006 Comput. Phys. Commun. 175 745 – 747
- [81] Froese Fischer C, Tachiev G and Irimia A 2006 At. Data Nucl. Data Tables 92 607–812
- [82] Müller A, Schippers S, Phaneuf R A, Kilcoyne A L D, Bräuning H, Schlachter A S, Lu M and McLaughlin B M 2010 J. Phys. B: At. Mol. Opt. Phys 43 225201
- [83] Fano U and Cooper J W 1968 Rev. Mod. Phys. 40 441 – 507
- [84] Schippers S 2011 Int. Rev. At. Mol. Phys. 2 151 – 156