11email: mubhatt@vssc.gov.in 22institutetext: Lunar and Planetary Laboratory, University of Arizona, 1629 E, University Blvd, Tucson, AZ 85721-0092
22email: reddy@lpl.arizona.edu 33institutetext: Deutsches SOFIA Institut, Universität Stuttgart, Pfaffenwaldring 29, 70569 Stuttgart, Germany 44institutetext: SOFIA Science Center, NASA Ames Research Center, Mail Stop N211-1, Mo ett Field, CA 94035, USA
44email: schindler@dsi.uni-stuttgart.de 55institutetext: Department of Geography, University of Winnipeg, 515 Portage Avenue, Winnipeg, Manitoba, Canada R3B 2E9
55email: e.cloutis@uwinnipeg.ca, paul.mann347@gmail.com 66institutetext: Physical Research laboratory, Ahmedabad, 380009, Gujarat, India
66email: abhardwaj@prl.res.in 77institutetext: Planetary Science Institute, 1700 East Fort Lowell Road, Tucson, AZ, 85719, USA
77email: lecorre@psi.edu
Composition of Jupiter irregular satellites sheds light on their origin
Abstract
Context. Irregular satellites of Jupiter with their highly eccentric, inclined and distant orbits suggest that their capture took place just before the giant planet migration.
Aims. We aim to improve our understanding of the surface composition of irregular satellites of Jupiter to gain insight into a narrow time window when our Solar System was forming.
Methods. We observed three Jovian irregular satellites, Himalia (JVI), Elara (JVII), and Carme (JXI), using a medium-resolution 0.8-5.5 m spectrograph, SpeX on the National Aeronautics and Space Administration (NASA) Infrared Teselscope Facility (IRTF). Using a linear spectral unmixing model we have constrained the major mineral phases on the surface of these three bodies.
Results. Our results confirm that the surface of Himalia (JVI), Elara (JVII), and Carme (JXI) are dominated by opaque materials such as those seen in carbonaceous chondrite meteorites. Our spectral modeling of NIR spectra of Himalia and Elara confirm that their surface composition is the same and magnetite is the dominant mineral. A comparison of the spectral shape of Himalia with the two large main C-type asteroids, Themis (D176 km) and Europa (D352 km), suggests surface composition similar to Europa. The NIR spectrum of Carme exhibits blue slope up to 1.5 m and is spectrally distinct from those of Himalia and Elara. Our model suggests that it is compositionally similar to amorphous carbon.
Conclusions. Himalia and Elara are compositionally similar but differ significantly from Carme. These results support the hypotheses that the Jupiter’s irregular satellites are captured bodies that were subject to further breakup events and clustered as families based on their similar physical and surface compositions.
Key Words.:
Planets and satellites: individual: Himalia, Elara, Carme – surfaces – Techniques: spectroscopic1 Introduction
The Jovian planets of our solar system have both regular and irregular moons, which are grouped based on their orbital characteristics. Regular satellites are on prograde orbits (inclinations ) with low eccentricities and low orbital inclinations suggesting that they formed in a planetocentric disk depending on thermal and chemical conditions in the protoplanetary nebulae (Pollack et al., 1979). The irregular satellites, however, are smaller in size and their orbits are highly inclined and eccentric suggesting a distinct origin mechanism. Two competing hypotheses have been proposed to explain the origin of these irregular satellites. The first is aerodynamic capture by Jupiter of irregular satellites from heliocentric orbits (Heppenheimer & Porco, 1977; Pollack et al., 1979) or by disruptive collisions (Colombo & Franklin, 1971). Recent works invoke the capture of these irregular satellites from the outer solar system after the giant planets’ migration (Nesvorný et al., 2007, 2014). These captured objects are important to study as they may represent the planetesimals that coalesced and formed the core of the giant planets (Nicholson et al., 2008). Furthermore, the surface composition of the irregular satellites can be used to understand their origin and the conditions under which they formed in the solar nebula.
The irregular satellites of giant planets have been further divided into prograde (inclinations ) and retrograde groups (inclinations ) based on their orbital properties. These groups are further clustered into families according to their orbital period. Hartmann (1987) and Grav et al. (2003) used optical measurements for a larger set of irregular satellites, and found that the colour variations are homogeneous within a family, indicating that each retrograde and prograde family is the result of the capture of a single parent body followed by breakup events (e.g. Bailey, 1971a, b; Pollack et al., 1979; Rettig et al., 2001; Grav et al., 2003; Sheppard & Jewitt, 2003; Grav & Holman, 2004; Nesvorný et al., 2007; Jewitt & Haghighipour, 2007). Jupiter is known to have at least five such families, named after the largest member of each family, two of which (Himalia and Carpo) are prograde and the other three (Ananke, Carme, and Pasiphaë) are retrograde (Nesvorný et al., 2003; Sheppard & Jewitt, 2003). Here we present low-resolution telescopic spectra of three of Jupiter’s irregular satellites, Himalia, Elara, and Carme, in an effort to identify spectrally dominant minerals on their surfaces. These three objects have been selected based on the favourable observing conditions around two Jupiter oppositions in 2012 and 2013, as described in Table 1.
Himalia and Elara both belong to the Himalia dynamical family of the prograde group that orbits Jupiter at distances of about 11.5 million km (165 Jovian radii), with orbital periods of 250.6 days and 259.7 days, respectively (Jacobson, 2000). Carme belongs to the retrograde group and orbits Jupiter at a distance of about 23.4 million km (334 Jovian radii) with an orbital period of 702.2 days (Jacobson, 2000). Himalia is known to be an elongated object with axes of 150x120 km based on Cassini spacecraft measurements (Porco et al., 2003). Recent studies by Grav et al. (2015) suggest that Himalia has low thermal inertia, with significant surface roughness, and a visible albedo of 5.70.8%. Elara is comparatively small with a diameter of 80 km. The radiometric observations by Cruikshank (1977) derived an albedo of 31% for Elara. This value was refined to 4.60.7% by Grav et al. (2015) who reported a low beaming value of 0.790.03 indicating significant surface roughness. Carme, with a diameter of 50 km, is the biggest member of the Carme family, a dynamical family of 19 known irregular satellites. Grav et al. (2015) estimated its albedo to be 3.50.6%.
The large Jovian irregular satellites have been observed and analyzed using their light curves, colours, and reflectance spectra but the reported measurements are sometimes contradictory. The multicolour observation of some retrograde and prograde Jovian irregular satellites by Tholen & Zellner (1984) suggested C-class surface composition for prograde and more diverse colours for the retrograde families with a mixture of C- and D-type spectra. They noted that Carme had a flat visible wavelength reflectance spectrum, but with a strong upturn in the ultraviolet. Tholen & Zellner (1984) suggested that Carme might be showing low-level cometary activity with CN emission at 0.388 m. Luu (1991) identified C-and D-type asteroid spectral features for both prograde and retrograde families based on spectroscopic observations of JV-JXIII and suggested them to be similar to Jupiter’s Trojan asteroids. Based on 1.3-2.4 m near-IR observations, Brown (2000) reported their compositions as being similar to P- and D-class asteroids from the outer asteroid belt, while their visible spectra resemble C-class asteroids. Cruikshank (1977) and Degewij et al. (1980) observed Himalia in the near-IR and confirmed that its surface composition is similar to that of C-type asteroids. Brown (2000) concluded that NIR spectra of Himalia and Elara are featureless between 1.4 and 2.5 m and do not contain any water-ice absorption features. Subsequently, Brown & Rhoden (2014) supported these findings and suggested that these objects lacked aqueously altered phyllosilicates based on the absence of a 3 m absorption band. Brown et al. (2003) and Chamberlain & Brown (2004) studied Himalia using data acquired by the Visual and Infrared Mapping Spectrometer (VIMS) on-board Cassini spacecraft during Jupiter’s fly-by and found that its spectrum (0.3-5.1 m) has low reflectance, a slight red slope, and an apparent absorption near 3-m suggesting the presence of water in some form. In addition, Jarvis et al. (2000) reported a weak absorption at 0.7 m in Himalia’s spectrum and attributed it to oxidized iron. Contrary to this result, Brown & Rhoden (2014) found no evidence for aqueously altered phyllosilicates in the 2.2-3.8 m region.
2 Observation and data reduction
Spectral observations of Himalia (JVI), Elara (JVII) and Carme (JXI) were obtained remotely using a medium-resolution 0.8-5.5 m spectrograph, SpeX on the National Aeronautics and Space Administration (NASA) Infrared Teselscope Facility (IRTF). The instrument was operated in low-resolution (R 150) prism mode with a 0.8” slit. Observational circumstances for the three objects are listed in Table 1. Local G-type stars were observed before and after the satellites in order to correct for telluric features. Observing conditions were less than ideal (high cirrus) when we observed Elara on Dec. 12 2012, and hence its spectrum has lower SNR than Carme despite Elara being 1.3 magnitudes brighter. The Solar analogue star SAO93936 was also observed and used to correct for spectral slope variations that could arise due to the use of a non-solar extinction star. The slit was oriented along the parallactic angle in order to reduce the effects of differential atmospheric refraction during the observational period.
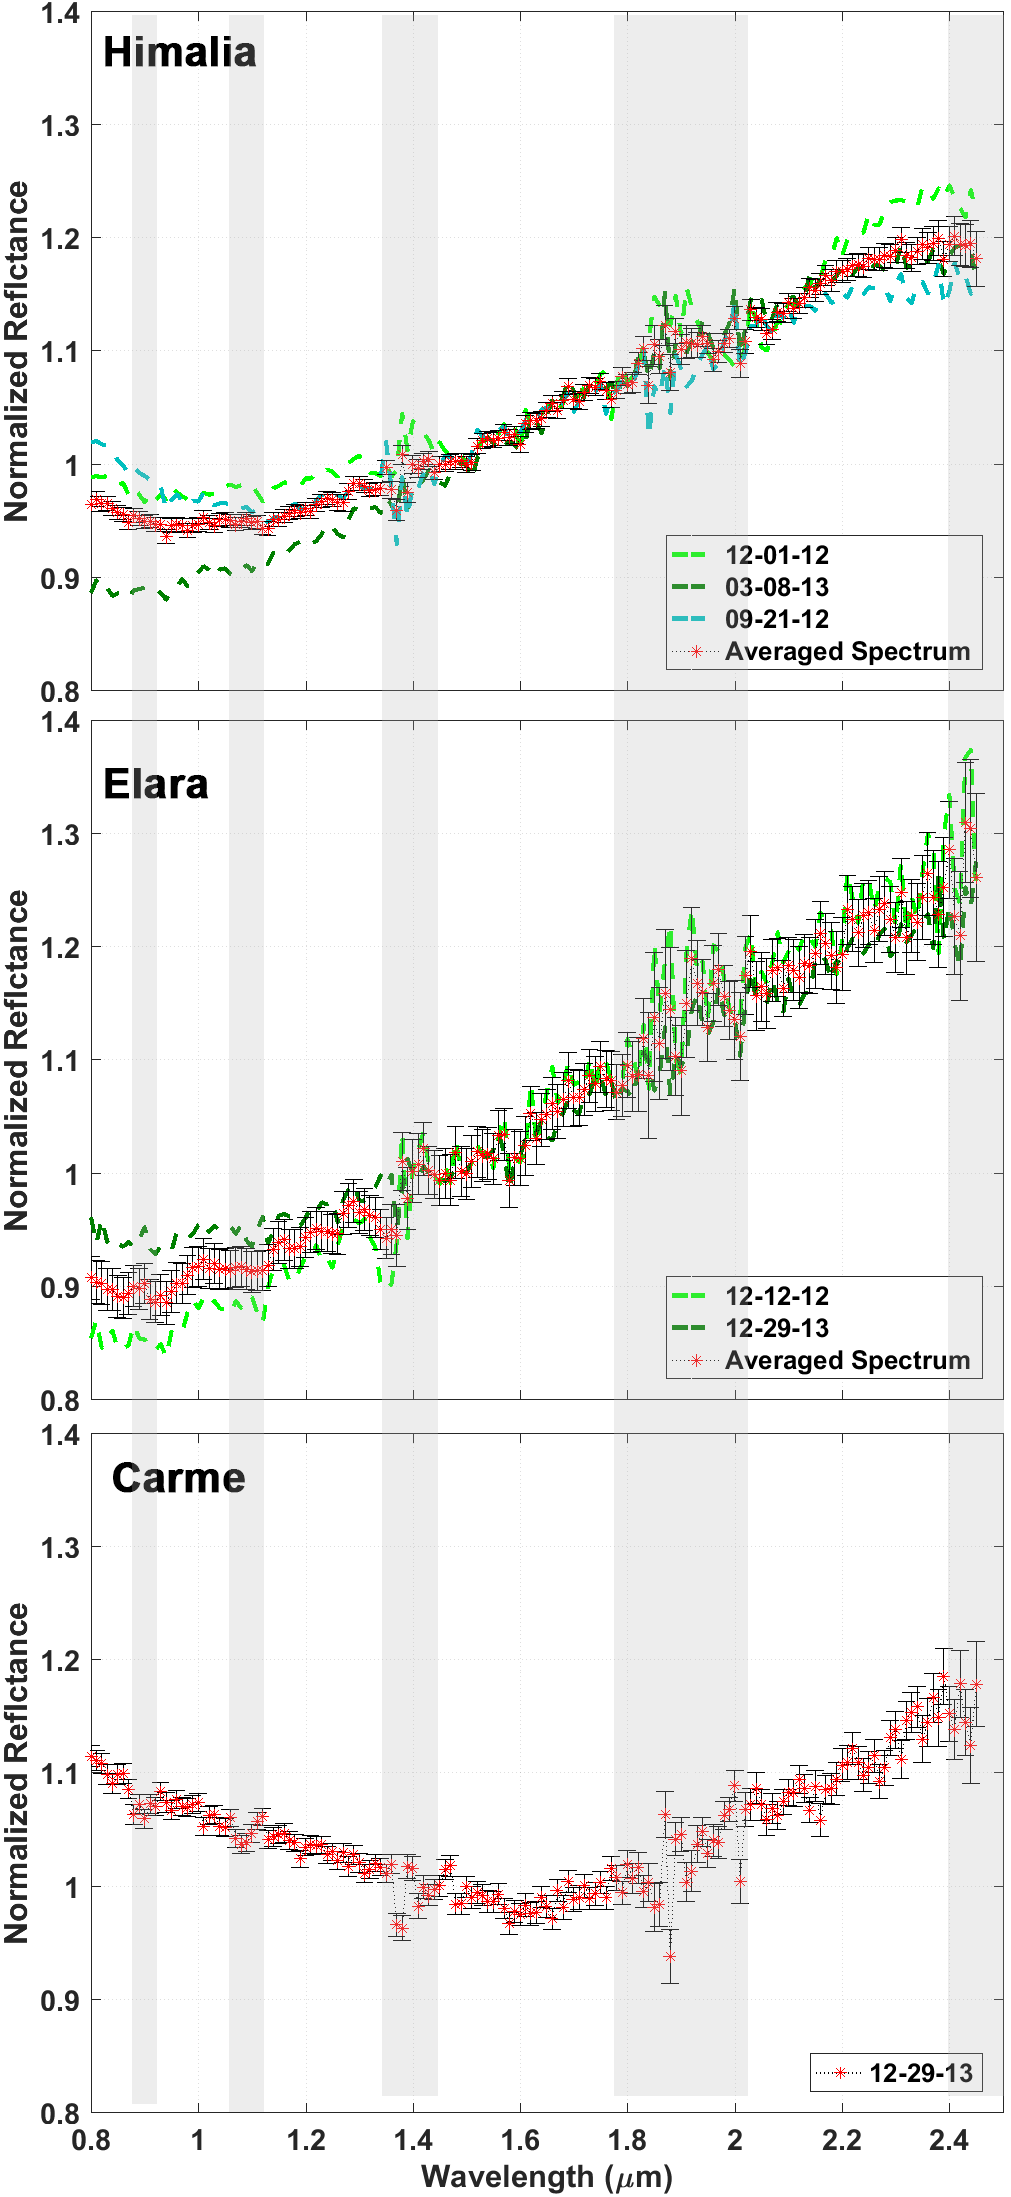
The prism data were processed using the IDL-based Spextool provided by the NASA IRTF (Cushing et al., 2004). A detailed description of the steps followed in the data reduction process can be found in Sanchez et al. (2013, 2015). Figure 1 shows the relative flux spectra of Himalia, Elara, and Carme normalised at 1.5 m. Each spectrum plotted in Fig. 1 is an average of all NIR spectra observed on a single night. The average spectrum have been obtained using Spextool. Higher data scatter for the wavelength region around 1.9 m and beyond 2.4 m is due to the incomplete telluric correction (grey bars on Fig. 1). The greater scattering for a specific wavelength region can introduce errors in spectral unmixing analysis. Therefore, we restricted the spectral unmixing analysis to wavelengths between 0.8 and 2.40 m with a wavelength interval of 0.01 m. We used the average spectrum for modeling the surface composition. Nightly average spectra for Himalia on three different epochs show a broad absorption feature at 1 m and a moderately red slope between 1.4 and 2.5 m. Similarly, Elara was observed on two nights and its spectra show a moderately red slope between 1.4 and 2.5 m but with a shallower absorption band at 1 m compared to Himalia. Carme was only observed for one night and its spectrum shows an absorption band at 1.6 m that is broader than the other two objects.
| Object | Date of observation | Start UTC | End UTC | V.Mag | Phase Angle | Airmass | Local standard star | Solar analogue |
|---|---|---|---|---|---|---|---|---|
| Himalia (JVI) | 09/21/2012 | 14:04 | 14:44 | 14.96 | 11.40 | 1.00-1.04 | GSC 01293-00022 | SAO93936 |
| 12/01/2012 | 11.10 | 11.45 | 14.76 | 0.35 | 1.02-1.07 | HD 29714 | SAO93936 | |
| 03/08/2013 | 5:10 | 5:50 | 15.9 | 11.20 | 1.06-1.10 | HD 284507 | SAO93936 | |
| Elara (JVII) | 12/12/2012 | 10:50 | 11:36 | 16.62 | 2.26 | 1.06-1.10 | SAO76633 | SAO93936 |
| 12/29/2013 | 08:44 | 09:20 | 14.78 | 2.05 | 1.08-1.17 | GSC 01896-01098 | SAO93936 | |
| Carme (JXI) | 12/29/2013 | 12:27 | 12:57 | 17.89 | 2.03 | 1.05-1.10 | GSC 01358-02213 | SAO93936 |
3 Modeling strategy: Linear spectral unmixing
Several spectral mixing algorithms have been proposed for studying the surface of various planetary bodies (e.g., Adams et al., 1986; Sunshine et al., 1990; van der Meer, 2000; Hapke, 2002; Shkuratov et al., 1999; Poulet et al., 2009; Horgan et al., 2014; Marsset et al., 2016; Zambon et al., 2016). Mixing models are specifically useful for determining mineral abundances when laboratory spectral calibrations are not available. Mixing models are complimentary to spectral parameter studies using absorption band centre because it allows for the mathematical description of the band shapes and the qualitative and quantitative assessment of the absorption features. However, in general, models do not provide a unique solution but a set of possible solutions. The observed reflectance spectra from any planetary body are mostly a non-linear mixture of spectra from different minerals due to multiple interactions of the incidence light before being reflected back in the direction of the detector. In many cases, modeling of these reflectance spectra has been successfully accomplished using linear and non-linear unmixing models with certain uncertainties. The non-linear models are more accurate than the linear models, however, they require additional information on scattering parameters, optical constants, mineral assemblages, and grain sizes (e.g., Hapke, 1981; Shkuratov et al., 1999). Linear unmixing, on the other hand, can be used to describe areal mixtures of surface materials by linear combinations of spectral components (e.g., Adams et al., 1986; Combe et al., 2008; Zambon et al., 2016). A limitation of this approach is that it is strictly valid only when the minerals are arranged in discrete patches at the surface, which is certainly not the case for all planetary surfaces.
In our study, we used a linear unmixing algorithm that has been successfully applied to several planetary bodies to constrain their surface composition (e.g. Combe et al., 2008; Poulet et al., 2009; Horgan et al., 2014; Marsset et al., 2016; Zambon et al., 2016). Our goal is not to estimate the mineral distribution, but to constrain the contribution of major minerals to the spectrum. We selected a classical Spectral Mixture Analysis (SMA) approach. Our assumption is that the reflectance spectra of these irregular bodies is a mixture of a linear combination of a maximum of four components, selected from a large pool of laboratory data sets. The SMA unmixing model is based on a least square inversion and can be represented in a standard way of a linear combination of end members:
| (1) |
where is the observed spectrum, x1 to xn are the normalised laboratory spectra, and a1 to an are their respective mixing coefficients. We constrain the algorithm output by fixing the additional condition that all the mixing coefficients should be positive and their total contribution should be equal to unity (Ramsey & Christensen, 1998).
The solution of Eq. 1 is as follows:
| (2) |
where A is a vector containing the mixing coefficients of the reference spectra (a1 to an) and X is a matrix of the end members (with N being the number of end members and M the number of spectral channels).
We included the option of automatic selection of multiple end members and evaluated the model fit by computing the coefficient of determination . We selected a combination of three end members as an initial case and allowed a fourth reference spectrum in case the fit was not optimal. We did not observe any significant improvement in value when allowing a fifth or sixth reference spectrum in the model. We also observed that setting the number of end members to two decreases the quality of the model and the model becomes unstable.
The coefficient vector A derived from the linear spectral unmixing model does not represent true mineral proportions in a rock, but rather indicates the major minerals with a qualitative estimate of their presence on the surface. We used the simplex-projection unmixing algorithm from Heylen et al. (2011) for computing the coefficient vector A.
The model gives the best match based on the best value obtained. We considered the results of the ten best model runs out of all possible combinations of three or four end members from Table 2. The model is considered stable if minor changes in do not change the used end members significantly.
3.1 End members selection
| S.N. | Sample id | Sample Type |
|---|---|---|
| 1. | LCA101 | Amorphous Carbon |
| 2. | GRP101 | Graphite |
| 3. | GRP102 | Amorphous Graphite |
| 4. | MAG101 | Magnetite |
| 5. | MAG102 | Magnetite |
| 6. | ILM101 | Ilmenite |
| 7. | BER101 | Berthierine |
| 8. | CHM101 | Chamosite |
| 9. | CRO102 | Cronstedtite |
| 10. | GRE001 | Greenalite |
| 11. | ILL101 | Illite |
| 12. | MIN003 | Minnesotaite |
| 13. | MON102 | Montmorillonite |
| 14. | NON101 | Nontronite |
| 15. | SAP102 | Saponite |
| 16. | SRP104 | Serpentinite |
| 17. | SRP105 | Serpentinite |
| 18. | TOC101 | Tochilinite |
| 19. | TRO202 | Troilite |
| 20. | OOHOO2 | Bauxite |
| 21. | OOHOO4 | Gibbsite |
| 22. | OLV002 | Chrysolite |
| 23. | OLV106 | Forsterite |
| 24. | PYX003 | Bronzite |
| 25. | PYX036 | Augite |
| 26. | PLG103 | Albite |
| 27. | PLG125 | Plagioclase |
| 28. | SPI101 | Spinel |
| 29. | SPI127 | Spinel |
| 30. | CHR103 | Chromite |
The selection of suitable end members is the most challenging and important step in the linear unmixing modelling because the results of the model are dependent on this selection. The selection of reference spectra must be a representative of surface composition and should be based on some prior knowledge of the surface composition. Prior knowledge of physical properties is also required for selection of end members. If the end members selection is incorrect in a physical sense, then the fractional abundance output results of the model are also potentially meaningless. Thus, the end members should be selected through an educated guess based on laboratory studies. We have chosen the reference spectra based on our knowledge of primitive meteorite composition.
We selected a total of 30 end members that were supplied to the mixing algorithm from a larger spectral library obtained from the University of Winnipeg Planetary Spectrophotometer Facility (PSF) in the wavelength range 0.8 to 2.45 m. Details of the PSF are available on the PSF web site (http://psf.uwinnipeg.ca). Table 2 lists the samples selected that broadly includes magnetites, clays and silicates. The ‘dark’ minerals which are expected to be found on irregular satellites based on previous studies (e.g. Adams, 1974; Adams & Goullaud, 1978; Cloutis et al., 1986; Clark et al., 1990; Cloutis & Gaffey, 1991; Cloutis et al., 2004; Klima et al., 2007) are specifically included in our list of end members. Metal, magnetites, and amorphous carbon are variably effective at suppressing mafic silicate absorption bands (Cloutis et al., 1990). The carbon in the list is a synthetic amorphous carbon (LCA101,0.021 m grain size). The iron oxide group is represented by natural magnetite MAG101 and MAG102 (). The presence of magnetites is indicative of past aqueous alteration in any planetary body (e.g. Bunch & Chang, 1980; Hua & Buseck, 1999; Rubin et al., 2007). Troilite, a dark and spectrally red absorber, is also added to the suite of end members because it has been detected in minor amounts in ordinary chondrite meteorites and up to 60% in Fe-Ni meteorites (Britt et al., 1992). Silicates that are expected to be present initially have also been included in our end members. Clay minerals have also been included because they are formed as alteration products of mafic minerals only in the presence of water at the surface or in the sub-surface of C-type asteroids (Rivkin et al., 2002). All sample spectra correspond to bidirectional reflectance acquired with a incidence angle, a emergence angle, and grain size 45 m. The only exception is the sample LCA101, which has a grain size 0.021 m and whose spectra were obtained with a configuration of incidence and emergence angles.
3.2 Application to laboratory mixtures

We present two case studies where we attempt to constrain the possible mineral abundances using spectra of two and three mineral mixtures. Our aim is to validate the model on known composition and estimate the model accuracy. The results are then compared with the measured values by considering and values. Our model is based on normalised values and cannot distinguish albedo differences. We selected two sets of mixtures, one is a two-mineral mixture of carbonaceous chondrite simulants and another a three-mineral mixture of Augite, Pargasite, and Labradorite. Figures 2 and 3 summarise the modelling results obtained using the known mineral mixture compositions.
In the case of Jupiter’s irregular satellites, we are interested in modelling minerals with low albedo, that is, iron oxides, amorphous carbon, clays and phyllosilicates. Thus, we selected intimate mixtures of carbonaceous chondrite simulants (intimate mixtures of magnetite and saponite) from the PSF spectral database; the modelling results are shown for two cases in Fig. 2. The values are for all cases. We observed that the model’s absorption band depth systematically increases with increasing amounts of magnetite. The maximum deviation in model estimation is observed for a 20:80 mixing ratio of MAG200 and SAP103. The model in this case estimated a 18:82 mixing ratio. We tested our model for a few more two-mineral mixtures and found that the model follows systematic trends. However, the absolute values may differ by 10-15 % in some cases. We considered one extreme example in this scenario by modelling intimate mixtures of synthetic brucite (OOH032) and LCA101. The absolute coefficients are overestimated by 20 % for intimate mixtures containing more than 0.5 % brucite, despite a good cross-correlation (85%). However, the values significantly decreased (0.65). Thus, we consider a model result reliable only if the value is 0.70.
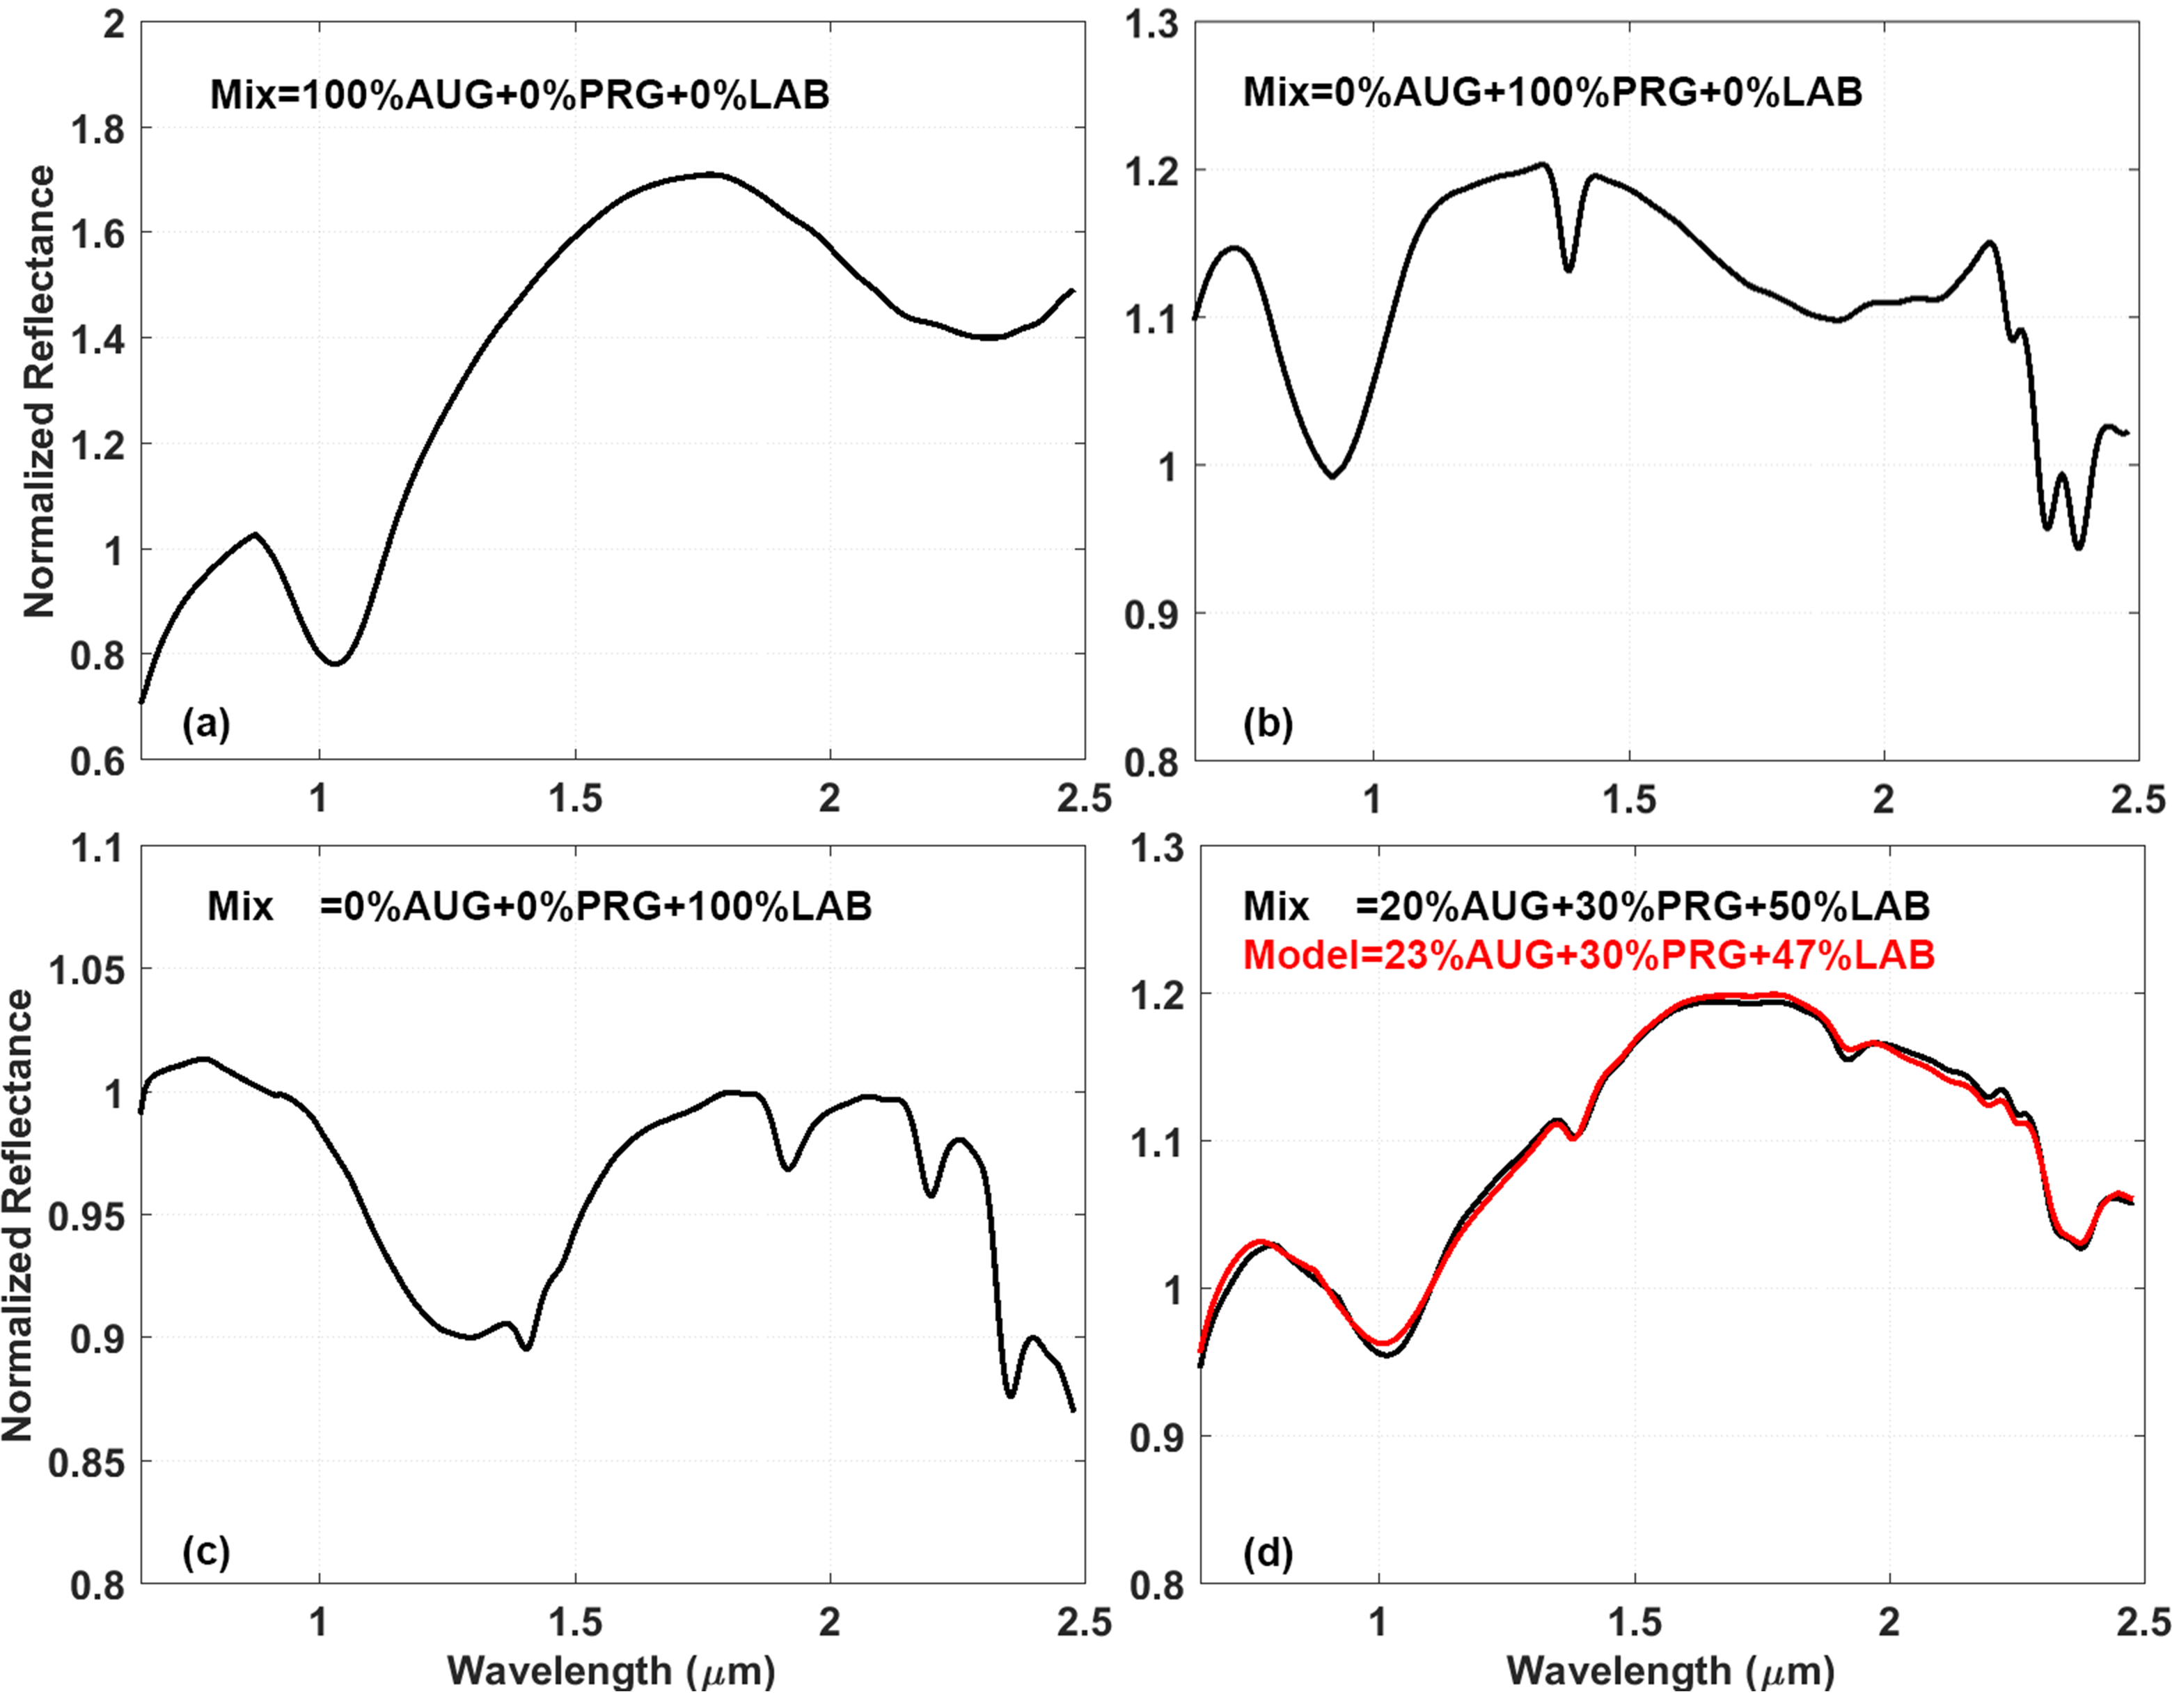
In another case study, we selected a mixture of three known minerals. We could only find a limited number of three-mineral mixtures on public spectral databases and none of them represent carbonaceous chondrite composition. Therefore, we selected the laboratory-based measurements reported recently by Rommel et al. (2017). We do not have a series of laboratory measurements in this case by gradually changing the mixing ratios of the end-members. Therefore, we considered one available combination of end-members as shown in Fig. 3. The model result is in good agreement with the measured spectrum with =0.9. We also tested our model on a few more mixtures of three minerals from the PSF spectral database and found that we can identify the increasing/decreasing trends of the minerals in three-mineral mixtures; however, the absolute quantification of the mineral percentages may deviate by more than 10 % in some cases.
4 Results
4.1 Himalia spectral comparison with C-type asteroids

The average spectrum of both Himalia and Elara exhibits a broad absorption band centred around 1.2 m which is also present in some CM2 carbonaceous chondrites that imply the presence of ferric iron with little or no ferrous iron present on the surface (Cloutis et al., 2011b, a). However, Brown & Rhoden (2014) did not find a one to one correspondence between the spectral features of Himalia and a limited set of CM carbonaceous chondrites. Instead, Brown & Rhoden (2014) found spectral similarities between Himalia and (52) Europa in the wavelength range 2.2 to 3.8 m. We compared a normalised average spectrum of Himalia in Fig. 4 with the NIR spectrum of large asteroids, (52) Europa and (24) Themis. (52) Europa and (24) Themis are classified as C type under the Bus-DeMeo taxonomic system (DeMeo et al., 2009). The absorption band shape and depth of Himalia show a closer resemblance to (52) Europa than to (24) Themis. Our results from Fig. 4 support Brown & Rhoden (2014) findings that spectral characteristics of Himalia fit into one of the four spectral categories identified by Takir & Emery (2012) for dark asteroids in the outer asteroid belt. The surface composition of the asteroids with Europa-like spectra is unknown and the only way to constrain their surface composition is by comparing them with the end members of known mineral compositions. The average spectrum of Elara, however, closely resembles that of Himalia up to 1.4 m, but with greater scattering.
4.2 Modelling Himalia spectra
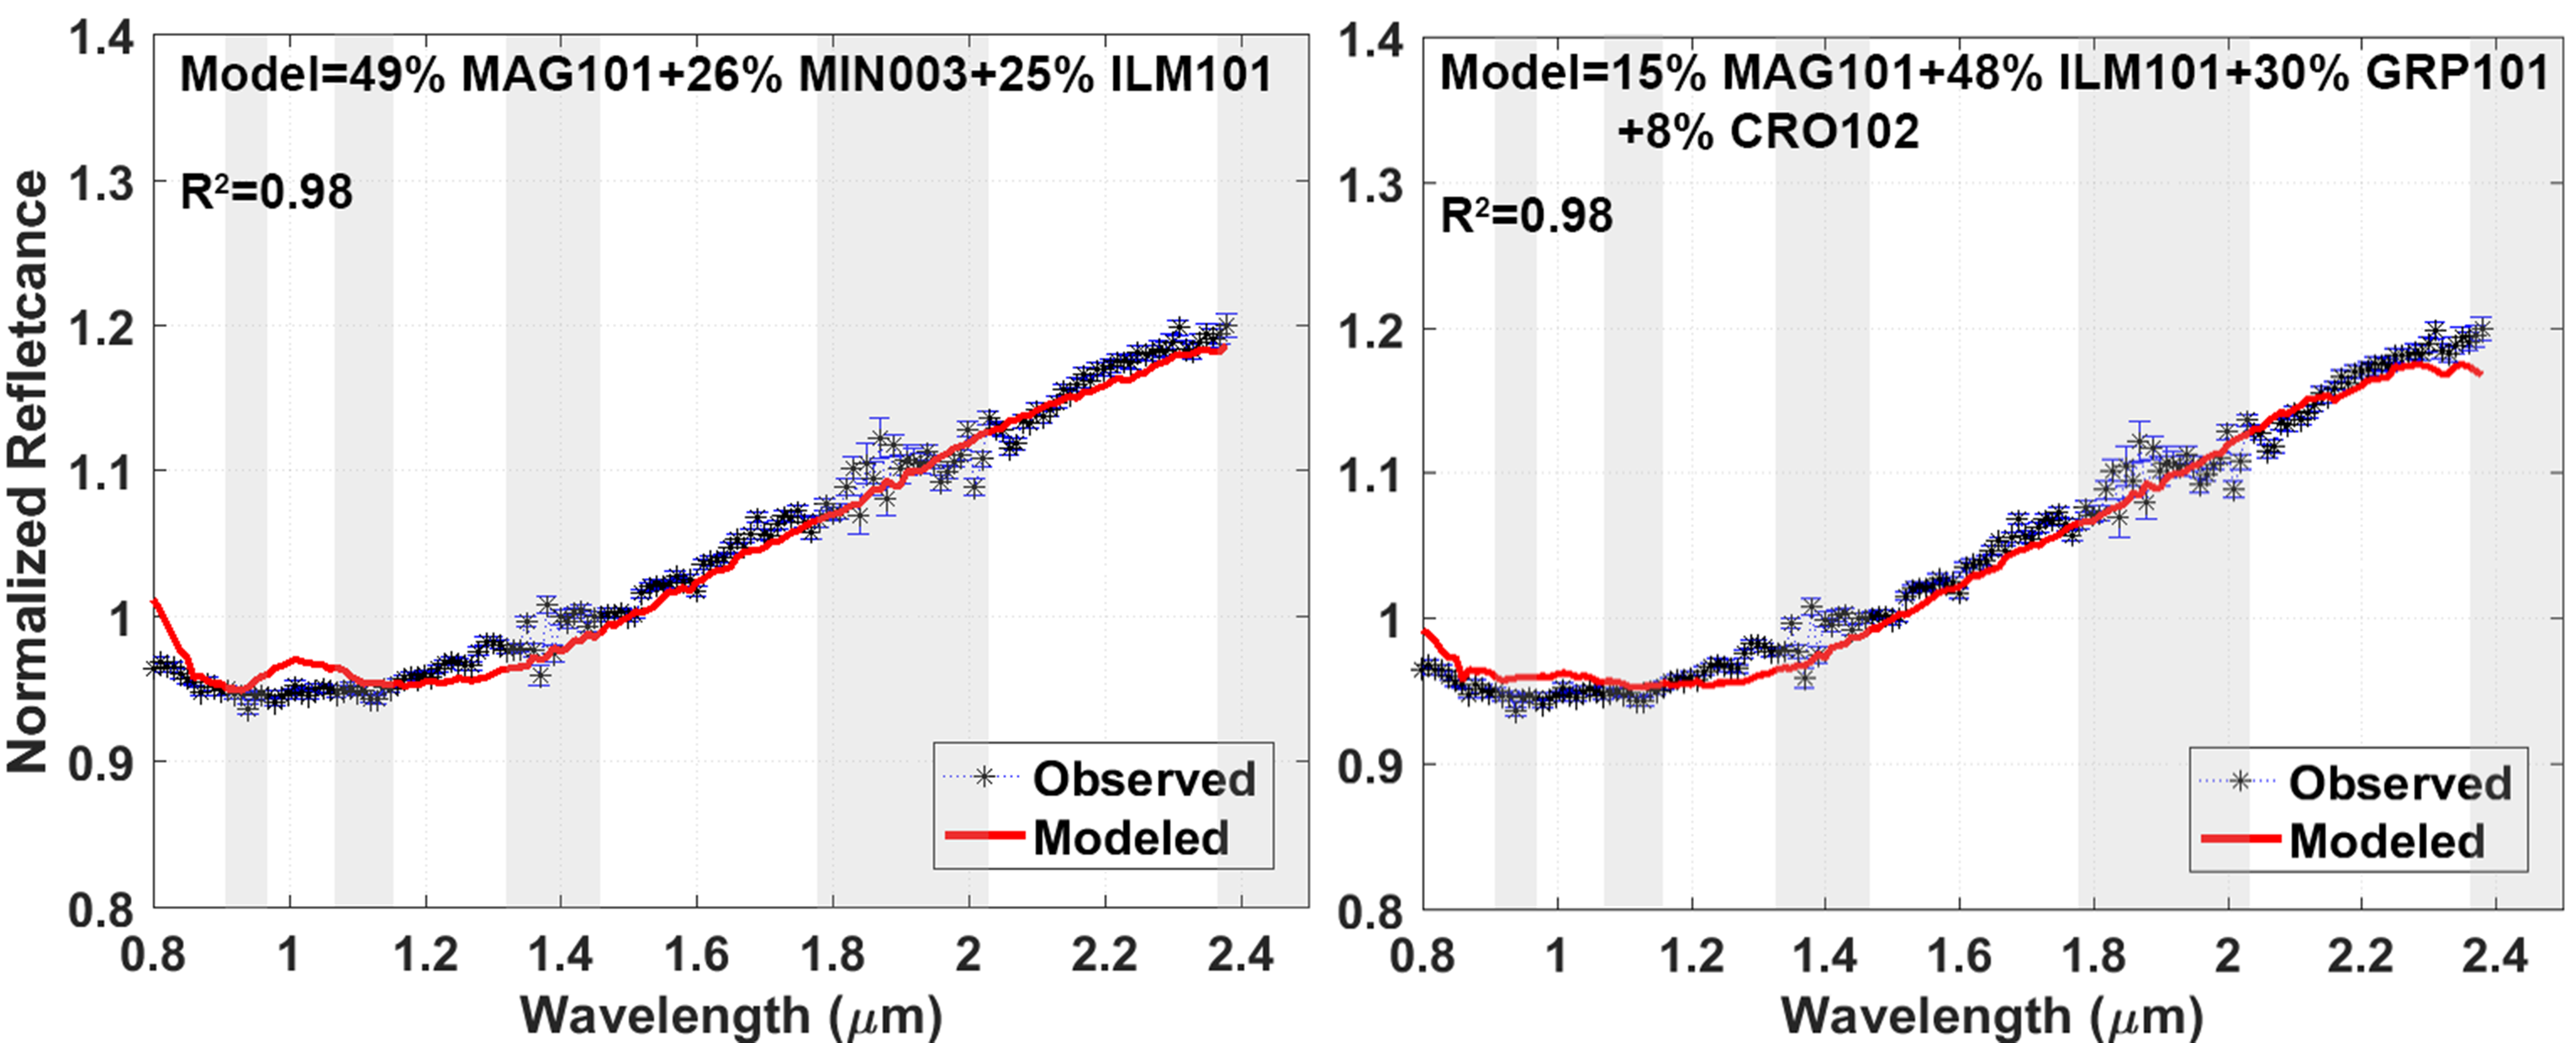
Fig. 5 shows the results obtained using a linear unmixing model for Himalia. The best match is a mixture of iron oxides (magnetite and ilmenite) with a ferric phyllosilicate (minnesotaite) considering three end members in the linear unmixing algorithm. The model mainly deviates from the observations in the shorter wavelength range from 0.8 to 1.4 m. Therefore, to further improve the model we increased the end members from three to four. The best fit result using four end members is also shown in Fig. 5 and gives a better match for the full wavelength region with no significant change in the values. In this case, minnesotaite has been replaced by a combination of carbon (graphite) and a different ferric phyllosilicate, cronstedtite, which is also present in CM2 carbonaceous chondrites. The model does not match the observations in the wavelength range 1.2-1.4 m even if we further increase the end members from four to five.
Jarvis et al. (2000) suggested the possible presence of phyllosilicates based on the presence of 0.7 m absorption feature and classified the parent body of Himalia as large main belt asteroid, a subclass of C, and proposed that it belongs to the Nysa asteroid family. Our modelling results support the findings of Jarvis et al. (2000) by estimating phyllosilicates using three and four end members models as shown in Fig. 5.
4.3 Modelling Elara Spectra
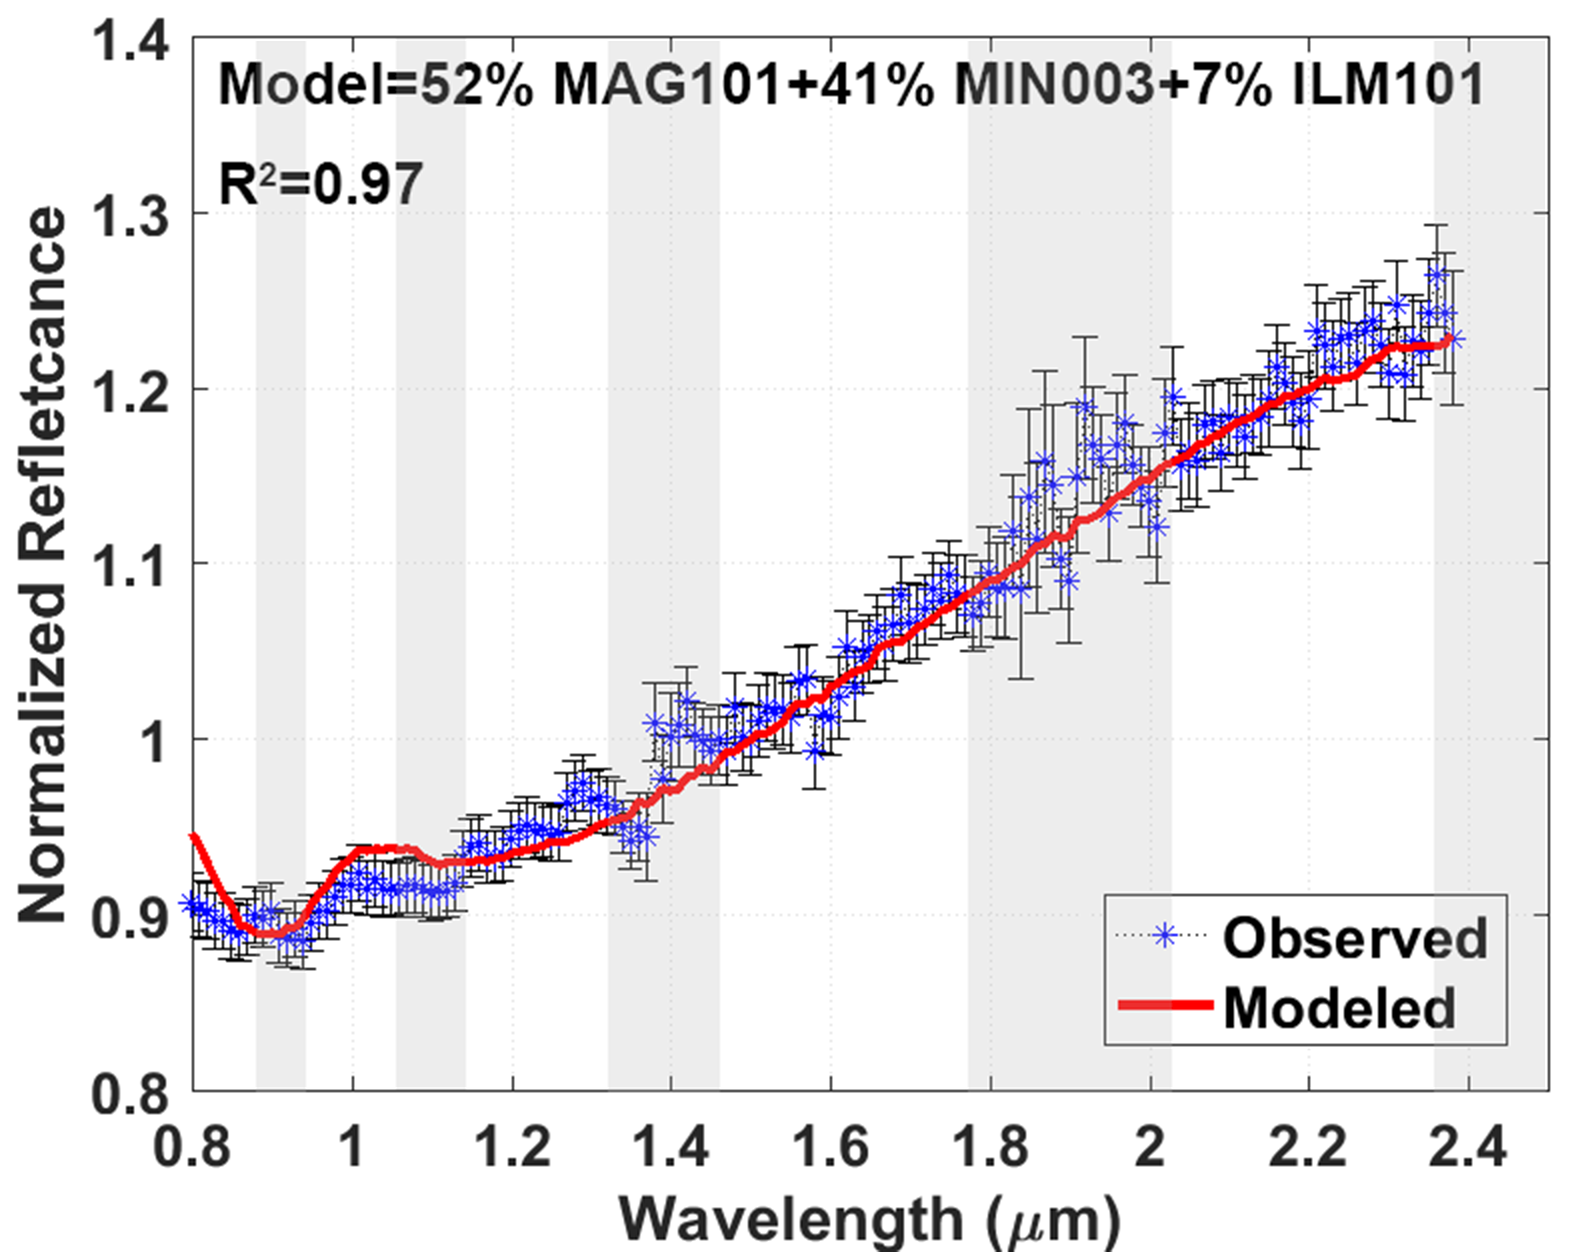
Elara has been suggested as having a similar surface composition as Himalia because it belongs to the Himalia spectral family (Luu, 1991; Rettig et al., 2001; Grav et al., 2003; Grav & Holman, 2004). Figure 6 shows the modelling results for Elara where we find the same set of minerals for Elara as we found for Himalia, indicating a composition dominated by iron oxides and phyllosilicates. We also checked the model result by increasing the end members to four in order to improve the fit at shorter wavelength region (1.4 m) but did not find any significant improvement in the fit. This analysis confirms that Himalia and Elara plausibly belong to a single parent body. However, we note that Elara has redder slope compared to Himalia, which may also indicate different surface alteration processes.
4.4 Modelling Carme Spectra
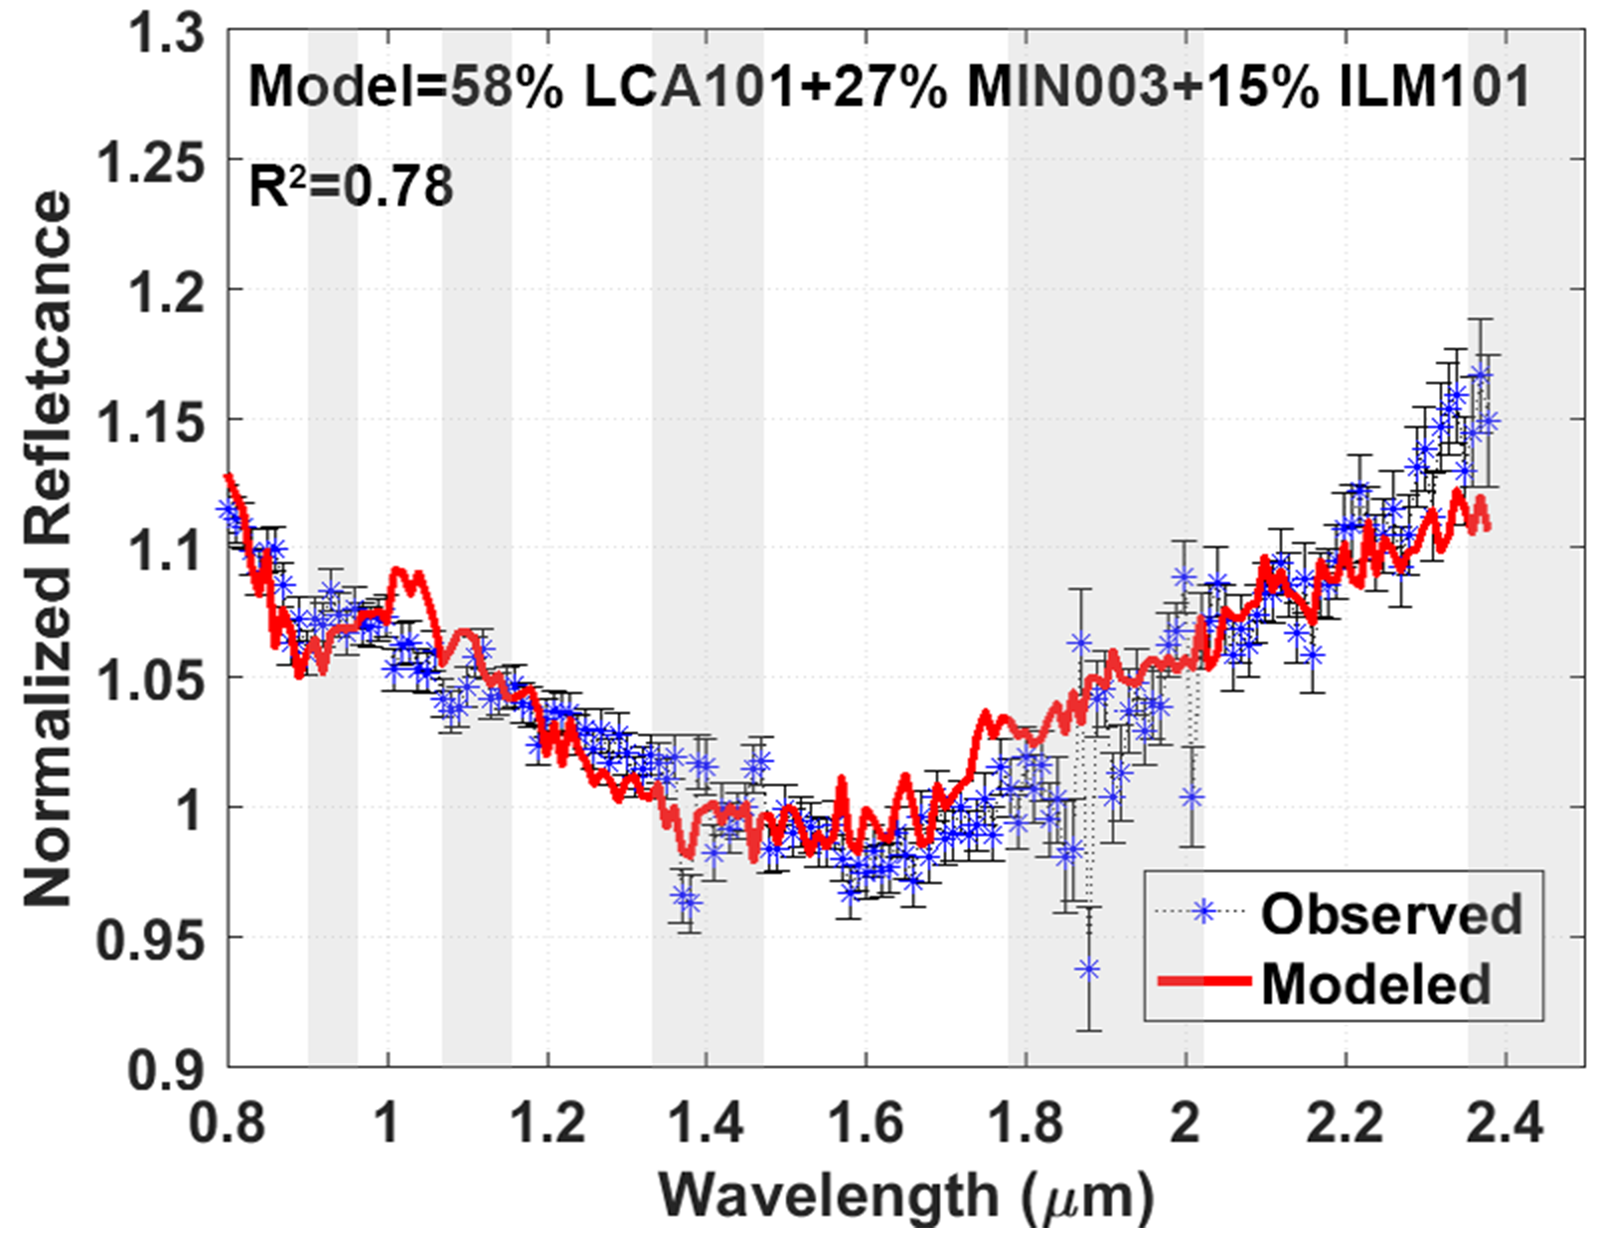
Figure 7 shows the best spectral fit obtained using our model for Carme. Carme’s normalised reflectance spectrum has a broad absorption band centered around 1.6 m. We find that the Carme spectrum has several interesting spectral features in the NIR wavelength range not previously detected. The overall spectral shape and absorption features of Carme are unique and distinguish it from other satellites. Our model suggests that the main constituents of the surface are black carbon, minnesotaite, and ilmenite. The model failed to match the telescopic spectrum at the wavelength range 0.9 to 1.1 m even when we increased the number of end members to four.
Luu (1991) and Tholen & Zellner (1984) reported the visible spectrum of Carme as consistent with D-type asteroids due to red slope from 0.4 to 0.7 m. However, our near-IR observations are significantly different from visible wavelength observations of Luu (1991) and Tholen & Zellner (1984). The multicolour photometry observations in the ultraviolet (UV) wavelength region by Tholen & Zellner (1984) found a strong upturn around 0.3 m that could be due to possible low-level cometary activity at Carme. This characteristic of Carme is unique and distinguishes it from other irregular satellites. As we do not cover observations in UV or the visible wavelength regions we could not confirm these findings.
5 Discussion
Our modelling and spectral shape comparison results in the NIR wavelength range for Himalia and Elara suggest similar surface composition as also demonstrated by several previous studies (e.g. Cruikshank, 1977; Degewij et al., 1980; Tholen & Zellner, 1984; Luu, 1991; Brown, 2000; Rettig et al., 2001; Grav et al., 2003). However, our Carme observations in the near-IR wavelengths distinguish this study from previous visible observations (Tholen & Zellner, 1984; Luu, 1991). Our analysis of these three irregular satellites provides information on the major mineral contributors by comparing observations with laboratory-based studies. The modelling approach proposed in this study, however, has certain limitations. One of the main limitations is that the model depends on the defined initial conditions such as selection of end members, grain sizes, viewing geometry, and so on. We compared the laboratory measured reflectance spectra with known physical conditions to the spectra observed from distant objects at surface temperature much lower than ambient temperature on Earth. Another limitation is that we could not consider wavelengths shorter than 0.8 m due to poor signal to noise ratio, limiting our ability to detect the 0.7 m absorption feature. Our telescopic observations do not cover the 3 m region, which would help to improve our understanding of the primordial parent body of these irregular satellites. The 3 m region includes several features of water, ice, and hydroxyl-bearing minerals, such as the 3.1 m absorption feature due to the water molecule in ice, and the 2.9 m absorption feature due to the O-H bond in hydroxyls (Aines & Rossman, 1984; Jones et al., 1990). Howell et al. (1999) and Rivkin et al. (2002) concluded that the presence of the 0.7 m absorption feature in a spectrum always indicates the presence of the 3.0 m feature, although the reverse is not always true.
A comparison of NIR spectra of Himalia with the two large main belt asteroids (24) Themis and (52) Europa suggests that the parent body(ies) of the Himalia family might have been derived from the main asteroid belt. This conclusion has been advanced by several studies (e.g. Cruikshank, 1977; Degewij et al., 1980; Tholen & Zellner, 1984; Luu, 1991; Brown, 2000; Rettig et al., 2001; Grav et al., 2003). The origin of the parent body(ies) of irregular satellites is still an open question and a more definitive answer requires observations of several irregular satellites from each dynamical family with higher signal-to-noise ratio at full wavelength coverage from 0.6 to 3 m. Planetesimals from different regions of the solar system are expected to show different spectral signatures in this wavelength range, and identifying these absorption features is the key to resolving the question of the origin of the parent bodies of the irregular satellites.
The low albedo values of Himalia, Elara, and Carme (Grav et al., 2015) suggest that a darkening agent is mixed in the surface material and also that the absorption features we observe are actually very intense in order to appear in reflectance spectra with low albedos. The darkening agent was identified as magnetite for Himalia and Elara, and as amorphous carbon for Carme along with the presence of phyllosilicates. The coexistence of phyllosilicates and iron oxides is due to aqueous alteration based on the observed mineralogy of carbonaceous chondrites. Moreover, the evidence for coexistence of phyllosilicates and iron oxides in the same planetary source already exists, for example, CI1, CR2, and CM2 carbonaceous chondrites (e.g. Vilas et al., 1994). The detection of magnetite along with phyllosilicate indicates that Himalia and Elara may belong to the C-type asteroids from the main belt as also reported by previous studies.
6 Conclusions
Surface composition of the Jovian irregular satellites helps us constrain the nature and origin of their parent bodies. Here, we identified major mineral contributors by applying a spectral unmixing model to VNIR reflectance spectra of Himalia, Elara, and Carme. We first evaluated the model performance on a number of intimately mixed mineral powders of known grain sizes and compositions. We discussed the limitations of our model in order to ultimately be able to estimate optically dominant minerals on very low albedo objects.
The spectral unmixing model solution has been considered stable for Himalia, Elara, and Carme considering similar composition from ten automatic model runs with R2 ¿ 0.75. The normalised reflectance spectra of Himalia and Elara are spectrally similar, suggesting similar surface composition that might have been derived from the main asteroid belt. Carme is unique in its spectral shape and absorption features. The reflectance spectra of these three objects are dominated by iron oxides and phyllosilicates, an important indicator of past aqueous alteration of their parent body(s). The spectral unmixing model revealed that the most dominant mineral is magnetite for Himalia and Elara, and amorphous carbon for Carme.
The modelling results of Himalia and Elara suggest a very reduced environment with a negligible amount of Fe present on these bodies. The detection of water or minerals which can only be formed in the presence of water is important in order to understand the nature of the parent body(ies) of the irregular satellites. This information also sheds light on the processes that occurred during the early stages of solar system history. Although we do not cover the 3 m region for detecting hydration features, we found phyllosilicates present in each case using the modelling approach.We plan to observe additional Jovian irregular satellites both from prograde and retrograde groups covering the full wavelength range between 0.6 and 3 m in future in order to quantify the extent of aqueous alteration from these bodies.
Acknowledgements.
The authors wish to thank one anonymous reviewer and Guneshwar Thangjam for their helpful reviews of the manuscript. MB is funded by the Indian Space Research Organization through its post doctoral program. We thank Prof. Christian Wöhler, TU Dortmund for providing three mineral mixture reflectance spectra. We would like to thank Juan A. Sanchez for his comments to improve the manuscript. Work by VR was funded by NASA Planetary Geology and Geophysics grants NNX14AN05G and NNX14AN35G. EAC thanks the Canada Foundation for Innovation, the Manitoba Research Innovations Fund, the Canadian Space Agency, the Natural Sciences and Engineering Research Council of Canada, and the University of Winnipeg for supporting the establishment and operation of the Planetary Spectrophotometer Facility.References
- Adams (1974) Adams, J. B. 1974, J. Geophys. Res. , 79, 4829
- Adams & Goullaud (1978) Adams, J. B. & Goullaud, L. H. 1978, in Lunar Planet. Sci. Conf., Vol. 9, 1–3
- Adams et al. (1986) Adams, J. B., Smith, M. O., & Johnson, P. E. 1986, J. Geophys. Res. , 91, 8098
- Aines & Rossman (1984) Aines, R. D. & Rossman, G. R. 1984, J. Geophys. Res. , 89, 4059
- Bailey (1971a) Bailey, J. M. 1971a, Science, 173, 812
- Bailey (1971b) Bailey, J. M. 1971b, J. Geophys. Res. , 76, 7827
- Britt et al. (1992) Britt, D. T., Tholen, D. J., Bell, J. F., & Pieters, C. M. 1992, Icarus , 99, 153
- Brown (2000) Brown, M. E. 2000, Astronomical Journal , 119, 977
- Brown & Rhoden (2014) Brown, M. E. & Rhoden, A. R. 2014, Astronomical Physical Journal letters , 793, L44
- Brown et al. (2003) Brown, R. H., Baines, K. H., Bellucci, G., et al. 2003, Icarus , 164, 461
- Bunch & Chang (1980) Bunch, T. E. & Chang, S. 1980, Geochim. Cosmochim. Acta , 44, 1543
- Chamberlain & Brown (2004) Chamberlain, M. A. & Brown, R. H. 2004, Icarus , 172, 163
- Clark et al. (1990) Clark, R. N., King, T. V. V., Klejwa, M., Swayze, G. A., & Vergo, N. 1990, J. Geophys. Res. , 95, 12653
- Cloutis & Gaffey (1991) Cloutis, E. A. & Gaffey, M. J. 1991, J. Geophys. Res. , 96, 22809
- Cloutis et al. (1986) Cloutis, E. A., Gaffey, M. J., Jackowski, T. L., & Reed, K. L. 1986, J. Geophys. Res. , 91, 11641
- Cloutis et al. (1990) Cloutis, E. A., Gaffey, M. J., Smith, D. G. W., & Lambert, R. S. J. 1990, Journal of Geophysical Research: Solid Earth, 95, 8323
- Cloutis et al. (2011a) Cloutis, E. A., Hiroi, T., Gaffey, M. J., Alexander, C. M. O. ., & Mann, P. 2011a, Icarus , 212, 180
- Cloutis et al. (2011b) Cloutis, E. A., Hudon, P., Hiroi, T., Gaffey, M. J., & Mann, P. 2011b, Icarus , 216, 309
- Cloutis et al. (2004) Cloutis, E. A., Sunshine, J. M., & Morris, R. V. 2004, Meteoritics and Planetary Science, 39, 545
- Colombo & Franklin (1971) Colombo, G. & Franklin, F. A. 1971, Icarus , 15, 186
- Combe et al. (2008) Combe, J.-P., Le Mouélic, S., Sotin, C., et al. 2008, Planet. Space Sci. , 56, 951
- Cruikshank (1977) Cruikshank, D. P. 1977, Icarus , 30, 224
- Cushing et al. (2004) Cushing, M. C., Vacca, W. D., & Rayner, J. T. 2004, PASP , 116, 362
- Degewij et al. (1980) Degewij, J., Cruikshank, D. P., & Hartmann, W. K. 1980, Icarus , 44, 541
- DeMeo et al. (2009) DeMeo, F. E., Binzel, R. P., Slivan, S. M., & Bus, S. J. 2009, Icarus , 202, 160
- Grav et al. (2015) Grav, T., Bauer, J. M., Mainzer, A. K., et al. 2015, Astronomical Physical Journal , 809, 3
- Grav & Holman (2004) Grav, T. & Holman, M. J. 2004, Astronomical Physical Journal letters , 605, L141
- Grav et al. (2003) Grav, T., Holman, M. J., Gladman, B. J., & Aksnes, K. 2003, Icarus , 166, 33
- Hapke (1981) Hapke, B. 1981, J. Geophys. Res. , 86, 4571
- Hapke (2002) Hapke, B. 2002, Icarus , 157, 523
- Hartmann (1987) Hartmann, W. K. 1987, Icarus , 71, 57
- Heppenheimer & Porco (1977) Heppenheimer, T. A. & Porco, C. 1977, Icarus , 30, 385
- Heylen et al. (2011) Heylen, R., Burazerovic, D., & Scheunders, P. 2011, IEEE Transactions on Geoscience and Remote Sensing, 49, 4112
- Horgan et al. (2014) Horgan, B. H. N., Cloutis, E. A., Mann, P., & Bell, J. F. 2014, Icarus , 234, 132
- Howell et al. (1999) Howell, E. S., Rivkin, A. S., Soderberg, A., Vilas, F., & Cochran, A. L. 1999, in AAS/Division for Planetary Sciences Meeting Abstracts, Vol. 31, AAS/Division for Planetary Sciences Meeting Abstracts #31, 04.01
- Hua & Buseck (1999) Hua, X. & Buseck, P. R. 1999, Meteoritics and Planetary Science, 34, A187
- Jacobson (2000) Jacobson, R. A. 2000, Astronomical Journal , 120, 2679
- Jarvis et al. (2000) Jarvis, K. S., Vilas, F., Larson, S. M., & Gaffey, M. J. 2000, Icarus , 145, 445
- Jewitt & Haghighipour (2007) Jewitt, D. & Haghighipour, N. 2007, ARA&A , 45, 261
- Jones et al. (1990) Jones, T. D., Lebofsky, L. A., Lewis, J. S., & Marley, M. S. 1990, Icarus , 88, 172
- Klima et al. (2007) Klima, R. L., Pieters, C. M., & Dyar, M. D. 2007, Meteoritics and Planetary Science, 42, 235
- Luu (1991) Luu, J. 1991, Astronomical Journal , 102, 1213
- Marsset et al. (2016) Marsset, M., Vernazza, P., Birlan, M., et al. 2016, A&A , 586, A15
- Nesvorný et al. (2003) Nesvorný, D., Alvarellos, J. L. A., Dones, L., & Levison, H. F. 2003, Astronomical Journal , 126, 398
- Nesvorný et al. (2014) Nesvorný, D., Vokrouhlický, D., & Deienno, R. 2014, Astronomical Physical Journal , 784, 22
- Nesvorný et al. (2007) Nesvorný, D., Vokrouhlický, D., & Morbidelli, A. 2007, Astronomical Journal , 133, 1962
- Nicholson et al. (2008) Nicholson, P. D., Cuk, M., Sheppard, S. S., Nesvorny, D., & Johnson, T. V. 2008, Irregular Satellites of the Giant Planets, ed. M. A. Barucci, H. Boehnhardt, D. P. Cruikshank, A. Morbidelli, & R. Dotson, 411–424
- Pollack et al. (1979) Pollack, J. B., Burns, J. A., & Tauber, M. E. 1979, Icarus , 37, 587
- Porco et al. (2003) Porco, C. C., West, R. A., McEwen, A., et al. 2003, Science, 299, 1541
- Poulet et al. (2009) Poulet, F., Bibring, J.-P., Langevin, Y., et al. 2009, Icarus , 201, 69
- Ramsey & Christensen (1998) Ramsey, M. S. & Christensen, P. R. 1998, J. Geophys. Res. , 103, 577
- Rettig et al. (2001) Rettig, T. W., Walsh, K., & Consolmagno, G. 2001, Icarus , 154, 313
- Rivkin et al. (2002) Rivkin, A. S., Howell, E. S., Vilas, F., & Lebofsky, L. A. 2002, Hydrated Minerals on Asteroids: The Astronomical Record, ed. W. F. Bottke, Jr., A. Cellino, P. Paolicchi, & R. P. Binzel, 235–253
- Rommel et al. (2017) Rommel, D., Grumpe, A., Felder, M. P., et al. 2017, Icarus , 284, 126
- Rubin et al. (2007) Rubin, A. E., Trigo-Rodríguez, J. M., Huber, H., & Wasson, J. T. 2007, Geochim. Cosmochim. Acta , 71, 2361
- Sanchez et al. (2013) Sanchez, J. A., Michelsen, R., Reddy, V., & Nathues, A. 2013, Icarus , 225, 131
- Sanchez et al. (2015) Sanchez, J. A., Reddy, V., Dykhuis, M., Lindsay, S., & Le Corre, L. 2015, Astronomical Physical Journal , 808, 93
- Sheppard & Jewitt (2003) Sheppard, S. S. & Jewitt, D. C. 2003, Nature , 423, 261
- Shkuratov et al. (1999) Shkuratov, Y. G., Kreslavsky, M. A., Ovcharenko, A. A., et al. 1999, Icarus , 141, 132
- Sunshine et al. (1990) Sunshine, J. M., Pieters, C. M., & Pratt, S. F. 1990, J. Geophys. Res. , 95, 6955
- Takir & Emery (2012) Takir, D. & Emery, J. P. 2012, Icarus , 219, 641
- Tholen & Zellner (1984) Tholen, D. J. & Zellner, B. 1984, Icarus , 58, 246
- van der Meer (2000) van der Meer, F. 2000, International Journal of Remote Sensing, 21, 3179
- Vilas et al. (1994) Vilas, F., Jarvis, K. S., & Gaffey, M. J. 1994, Icarus , 109, 274
- Zambon et al. (2016) Zambon, F., Tosi, F., Carli, C., et al. 2016, Icarus , 272, 16