Convergence and pitfalls of density functional perturbation theory phonons calculations from a high-throughput perspective
S1 Materials
The details of the materials considered for the current study are listed in Table S1. The mp-id is the Materials Project identifier, and the band gaps reported have been obtained with same approximations as those described in the main text.
| mp-id | Formula | N sites | Crystal system | Space group | ecut (Ha) | Band gap (eV) |
|---|---|---|---|---|---|---|
| mp-66 | C | 2 | cubic | 227 | 35 | 4.17 |
| mp-149 | Si | 2 | cubic | 227 | 20 | 0.61 |
| mp-1265 | MgO | 2 | cubic | 225 | 48 | 4.40 |
| mp-1479 | BP | 2 | cubic | 216 | 30 | 1.26 |
| mp-2176 | ZnTe | 2 | cubic | 216 | 35 | 1.07 |
| mp-2472 | SrO | 2 | cubic | 225 | 48 | 3.33 |
| mp-2624 | AlSb | 2 | cubic | 216 | 26 | 1.22 |
| mp-2667 | CsAu | 2 | cubic | 221 | 38 | 1.09 |
| mp-8062 | SiC | 2 | cubic | 216 | 35 | 1.38 |
| mp-22903 | RbI | 2 | cubic | 225 | 33 | 3.77 |
| mp-22922 | AgCl | 2 | cubic | 225 | 39 | 0.92 |
| mp-571222 | CsBr | 2 | cubic | 225 | 38 | 4.27 |
| mp-315 | PbF2 | 3 | cubic | 225 | 53 | 4.44 |
| mp-971 | K2O | 3 | cubic | 225 | 48 | 1.73 |
| mp-1569 | Be2C | 3 | cubic | 225 | 35 | 1.19 |
| mp-10182 | LiZnP | 3 | cubic | 216 | 43 | 1.34 |
| mp-12558 | LiMgAs | 3 | cubic | 216 | 43 | 1.36 |
| mp-380 | ZnSe | 4 | hexagonal | 186 | 37 | 1.18 |
| mp-672 | CdS | 4 | hexagonal | 186 | 39 | 1.12 |
| mp-804 | GaN | 4 | hexagonal | 186 | 48 | 1.76 |
| mp-2074 | Li3Sb | 4 | cubic | 225 | 43 | 0.69 |
| mp-2133 | ZnO | 4 | hexagonal | 186 | 48 | 0.81 |
| mp-5077 | NaLi2Sb | 4 | cubic | 225 | 43 | 0.68 |
| mp-8882 | GaP | 4 | hexagonal | 186 | 48 | 1.29 |
| mp-10694 | ScF3 | 4 | cubic | 221 | 53 | 6.19 |
| mp-14437 | RbYO2 | 4 | trigonal | 166 | 48 | 3.66 |
| mp-8278 | Ba(MgP)2 | 5 | trigonal | 164 | 29 | 1.16 |
| mp-8280 | Ba(MgAs)2 | 5 | trigonal | 164 | 30 | 1.09 |
| mp-9564 | Ca(MgAs)2 | 5 | trigonal | 164 | 30 | 1.26 |
| mp-9570 | Ca(CdP)2 | 5 | trigonal | 164 | 39 | 0.83 |
| mp-1522 | FeS2 | 6 | orthorhombic | 58 | 67 | 0.82 |
| mp-6947 | SiO2 | 6 | tetragonal | 136 | 48 | 5.11 |
| mp-13276 | SrLiP | 6 | hexagonal | 194 | 43 | 1.37 |
| mp-2961 | MgSiP2 | 8 | tetragonal | 122 | 29 | 1.37 |
| mp-3762 | VCu3S4 | 8 | cubic | 215 | 58 | 1.01 |
| mp-19795 | InS | 8 | orthorhombic | 58 | 38 | 1.48 |
| mp-36508 | SnHgF6 | 8 | trigonal | 148 | 53 | 2.43 |
| mp-864954 | MgMoN2 | 8 | hexagonal | 194 | 34 | 0.72 |
| mp-6930 | SiO2 | 9 | trigonal | 154 | 48 | 5.71 |
| mp-14983 | Si4P4Ru | 9 | triclinic | 1 | 38 | 1.43 |
| mp-5348 | MgCO3 | 10 | trigonal | 167 | 48 | 5.02 |
| mp-989407 | YWN3 | 10 | orthorhombic | 26 | 32 | 1.61 |
| mp-2030 | RuS2 | 12 | cubic | 205 | 38 | 0.57 |
| mp-4820 | ZrSiO4 | 12 | tetragonal | 141 | 48 | 4.60 |
| mp-10155 | P2Ir | 12 | monoclinic | 14 | 23 | 0.67 |
| mp-2979 | ZnGeN2 | 16 | orthorhombic | 33 | 35 | 1.70 |
| mp-570844 | Ga3Os | 16 | tetragonal | 136 | 48 | 0.68 |
| mp-567841 | Be3P2 | 40 | cubic | 206 | 23 | 0.89 |
S2 q-points convergence
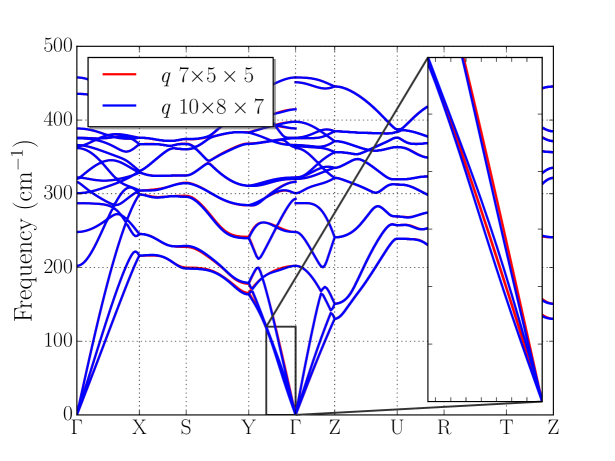
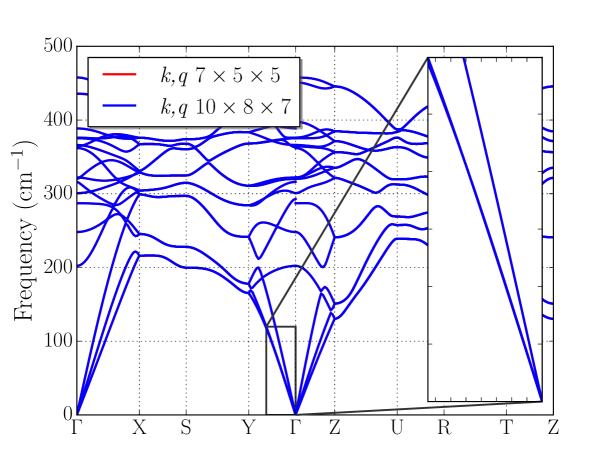
The convergence of the phonon band structures with respect to q grid density has highlighted how the usage of a q-point grid denser than the k-point grid may lead to numerical instabilities close to the point. This is demonstrated in Fig. S1 and Fig. S2, where the phonon band structure of FeS2 (mp-1522) with different sampling are shown.
In Fig. S1 a common k-point grid is used and the results obtained from the interpolation of and q-point grids are compared, highlighting partial lost of a linear trend for the acoustic modes. At variance, when the k-point grid is increased to match the q-point one, the interpolated phonon frequencies are in excellent agreement (Fig. S2).
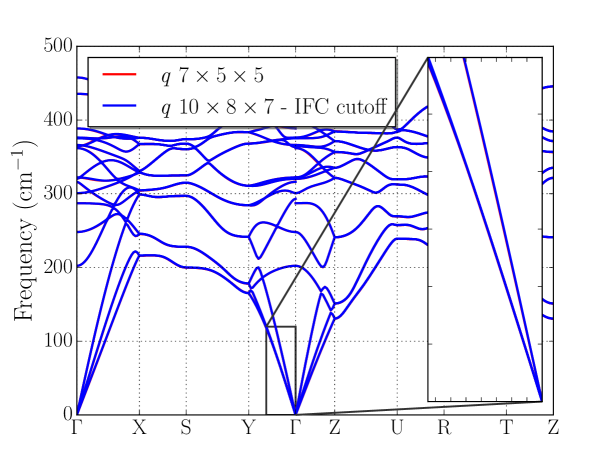
The same outcome can be obtained in this case by adding a cutoff of 25 Bohr on the interatomic force constants (IFCs) during the Fourier interpolation, even when considering the fixed k-point grid, as shown in Fig. S3.
The same behavior has been observed for K2O, RbI and RbYO2.
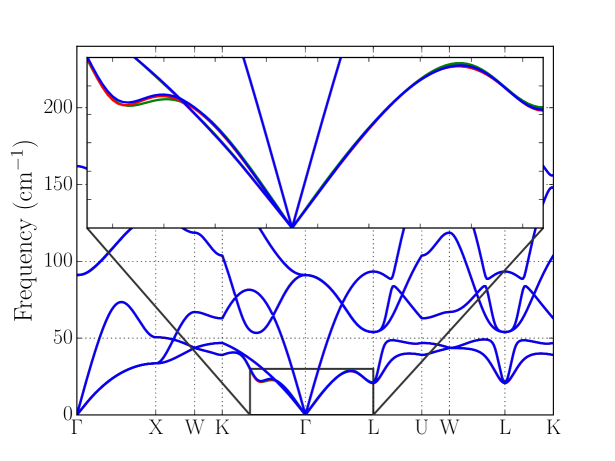
An additional source of error is coming in the case of AgCl (mp-22922) from the presence of softened modes, as shown in Fig. S4. Here the results are shown with equivalent k and q grids, in order to remove the contribution coming from the error discussed above. The dips along the line -K and at L deepens for tensing strain, but already at this stage they hinder the effectiveness of the Fourier interpolation, resulting in a slower convergence of the phonon band structure. In these cases we consider as unimportant the errors emerging in such a region. If a more accurate analysis is needed it would be more appropriate to focus the study on the point of interest with targeted DFPT calculations.