Proceedings of the Fifth Annual LHCP ATL-PHYS-PROC-2017-210
Top-quark mass and top-quark pole mass measurements with the ATLAS detector
Teresa Barillari
On behalf of the ATLAS Collaboration
Max-Planck-Institute für Physik
Föhringer Ring 6, 80805 Muenchen, Germany
ABSTRACT
Results of top-quark mass measurements in the di-lepton and the all-jets top-antitop decay channels with the ATLAS detector are presented. The measurements are obtained using proton–proton collisions at a centre-of-mass energy at the CERN Large Hadron Collider. The data set used corresponds to an integrated luminosity of . The top-quark mass in the di-lepton channel is measured to be . In the all-jets analysis the top-quark mass is measured to be . In addition, the top-quark pole mass is determined from inclusive cross-section measurements in the top-antitop di-lepton decay channel with the ATLAS detector. The measurements are obtained using data at and corresponding to an integrated luminosity of and respectively. The top-quark pole mass is measured to be .
PRESENTED AT
The Fifth Annual Conference
on Large Hadron Collider Physics
Shanghai Jiao Tong University, Shanghai, China
May 15-20, 2017
1 Introduction
Due to the higher centre-of-mass energy, top quark production at the proton–proton () Large Hadron Collider (LHC) is an order of magnitude larger than at the Tevatron. The large data sets of top–antitop quark pairs () that will be collected at LHC, will allow many precision studies. The top-quark mass, , is a fundamental parameter of the Standard Model (SM) and its precise value is indispensable for predictions of cross sections at the LHC. After the Higgs boson discovery at the LHC [1, 2] and in the current absence of direct evidence for new physics beyond the SM, precision theory predictions confronted with precision measurements are becoming an important area of research for self-consistency tests of the SM and in searching for new physics phenomena [3, 4, 5]. Due to the high mass the top-quark’s width is so large that it typically decays before it hadronizes. The measurements proceed then via kinematic reconstruction of the top-quark’s decay products, a boson and a -quark jet, and comparisons to Monte Carlo (MC) simulations are done. These measurements are often referred to as MC top-quark mass, , measurements. There is no immediate interpretation of the measured in terms of a parameter of the SM Lagrangian in a specific renormalisation scheme. In many Quantum Chromodynamics (QCD) calculations the top quark pole mass , corresponding to the definition of the mass of a free particle, is used as the conventional scheme choice. Present studies estimate that the value of differs from the by ) [6, 7]. The can be measured from inclusive production cross section () [8]. However, this determination is currently less precise than the achieved measurements. This is due to the weak sensitivity of the inclusive to the , but also to the large uncertainties on the factorisation and renormalisation scales, the strong coupling constant , and the proton parton distribution function (PDF). In the following the latest results on the , or just , measurements in the di-lepton and in the all-jets decay channel with the ATLAS detector [9] using data at are presented. The data set corresponds to an integrated luminosity of . The measurements in di-leptonic decay channel, where each of the top quarks decays into a -quark, a charged lepton and its neutrino, is further described in Section 2. The measurement in the all-jets decay channel involves six jets, two originating from -quarks and four originating from the two boson hadronic decays. This recent measurement is detailed in Section 3. Finally, the value is determined from inclusive measurements in the di-lepton decay channel. This analysis uses data collected at and and corresponding to an integrated luminosity of and . The achieved results are summarised in Section 4.
2 Di-lepton measurements at
A new measurement of is obtained in the di-lepton decay channel using 2012 data taken at a centre of mass energy [10]. The analysis exploits the decay , where both bosons decay into a charged lepton and its corresponding neutrino. In the analysis, the decay channels , and (including , ) are combined and referred to as the di-lepton channel. Single-top-quark events with the same lepton final states are included in the signal. Given the larger data sample compared to the measured at in ATLAS [11], the event selection was optimised to achieve the smallest total uncertainty. The selection from Ref. [11] is applied as a pre-selection. Here events are required to have a signal from the single-electron or single-muon trigger. Exactly two oppositely charged leptons are required. In the same-lepton-flavour channels, and , a missing transverse momentum, , is required. In addition, the invariant mass of the lepton pair must satisfy , and must not be compatible with the mass within . In the channel the scalar sum of the transverse momentum, , of the two selected leptons and all jets is required to be larger than . The presence of at least two central jets with and is required. Two -jets taken as originating from the decays of the two top quarks are then selected, and two leptons are taken as the leptons from the leptonic decays. From the two possible assignments of the two pairs, the combination leading to the lowest average invariant mass of the two lepton-–-jet pairs () is retained. Starting from this pre-selection, an optimisation of the total uncertainty in is performed. A phase-space restriction based on the average of the two lepton–--jet pairs () is used to obtain the smallest total uncertainty in , this corresponds to a cut on . To perform the template parameterisation described in Ref. [11], an additional selection criterion is applied. The reconstructed value is restricted to the range . Using this selection the kinematic distributions in the data are well described by the predictions. The resulting template fit function based on simulated distributions of has as the only free parameter and an unbinned likelihood maximisation gives the value that best describes the data. Figure 1, left plot, shows the distribution obtained with data together with the fitted probability density functions for the background alone that is hardly visible at the bottom of the figure. The plot on the right side of Figure 1 shows the final corresponding logarithm of the performed likelihood as a function .
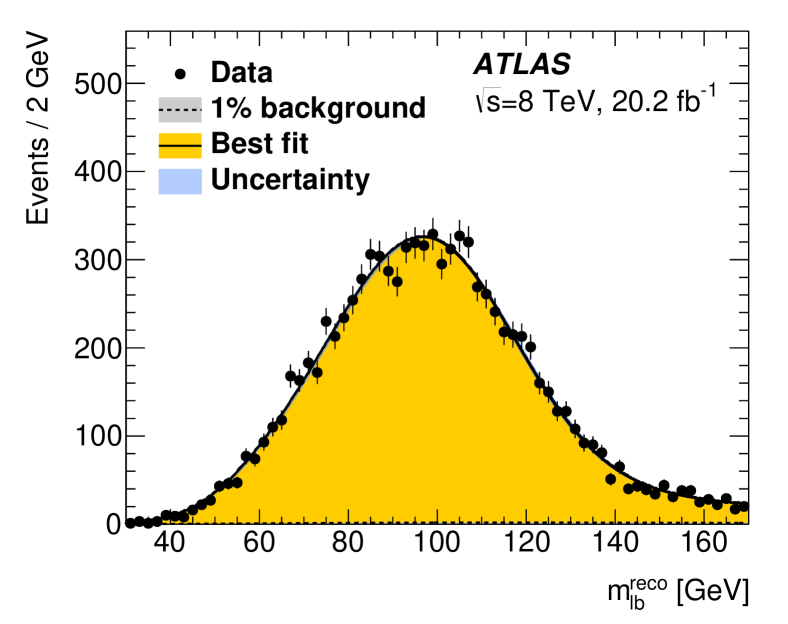
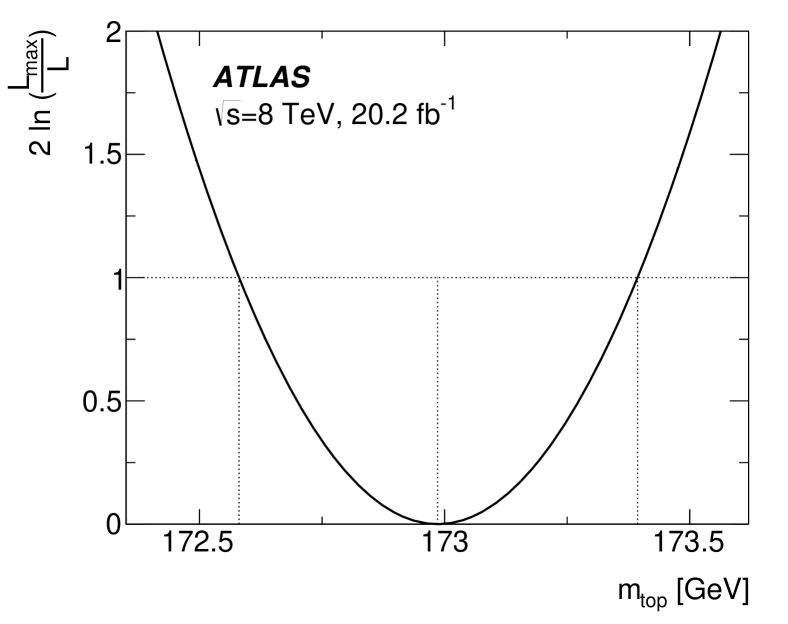
This measurement gives , with the biggest systematic uncertainties coming from jet energy scale (JES) and relative -to-light-jet energy scale. This result is more precise that measured at . It is the most precise single result in this decay channel to date. A combination with the ATLAS measurements in the lepton+jets and di-lepton decay channels from data is performed. Using a dedicated mapping of uncertainty categories, the combination of the three measurements results in a value of . This result is mostly limited by the calibration of the JES and by the Monte Carlo modeling of signal events.
3 All-jet measurements at
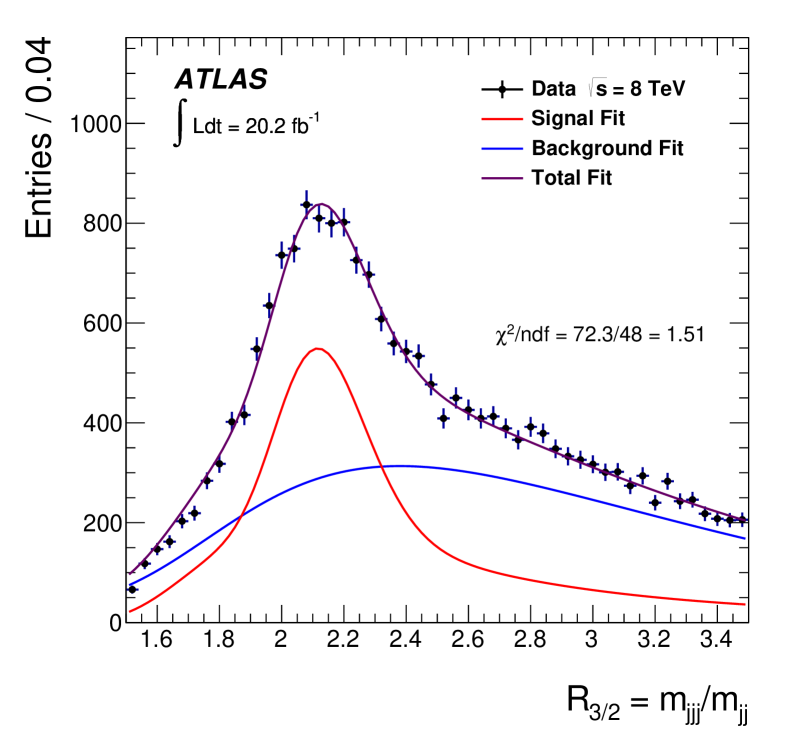
A recent measurement obtained using ATLAS data taken at [12] exploits the decay , where both bosons decay into jets from charged quarks, . This is a challenging measurement to make because of the large multi-jet background arising from various other processes of the strong interaction described by the QCD. However, all-jets events profit from having no neutrinos among the decay products, so that all four-momenta can be measured directly. The multi-jet background for the all-hadronic channel, while large, leads to different systematic uncertainties than in the case of the single- and di-leptonic channels. Thus, all-jets analyses offer an opportunity to cross-check measurements performed in the other channels. Events in this analysis are selected by a trigger that requires at least five jets with . Events with isolated electrons (muons) with () and reconstructed in the central region of the detector (within ) are rejected. To ensure that the selected events are in the plateau region of the trigger efficiency curve where the trigger efficiency in data is greater than %, at least five of the reconstructed central jets are required to have . Any additional central jet is required to have . Events containing neutrinos are removed by requiring . In the final selection, events are kept if at least two of the six leading transverse momentum jets are identified as originating from a -quark (). Such jets are said to be -tagged. In each event the two jets with leading -tag weights ( and ) are required to be within an azimuthal angle . Finally, another cut based on the azimuthal angle between -jets and their associated boson candidate is applied: the average of the two angular separations for each event is required to satisfy . To determine the in each event, a minimum- approach is adopted where all possible permutations of the six or more reconstructed jets in each event are considered. The permutation resulting in the lowest value is kept. To reduce the multi-jet background in the analysis and to eliminate events where the top quarks and the bosons in an event are not reconstructed correctly, a is required. The dominant multi-jet background in the analysis is determined directly from the data. Two uncorrelated variables, the and the , are used to divide the data events into four different regions, such that the background is determined in the control regions and extrapolated to the signal region. The four regions are labeled ABCD and distributions of the ratio of three-jet to dijet masses () are studied for each of the defined regions. The observable is chosen due to its reduced dependence on the JES uncertainty. To extract a measurement of the , a template method with a binned minimum- approach is employed. For each event, two values are obtained, one for each measurement. Signal and background templates binned in are created using simulated events, and the data-driven background distribution. After applying a final fit, which uses matrix algebra to include non-diagonal covariance matrices, is measured to be: . Figure 2 shows the distribution, left plot, with the corresponding total fit as well as its decomposition into signal and the multi-jet background. The right plot in this figure shows the ellipses corresponding to - (solid line) and - (dashed line) variations in statistical uncertainty.
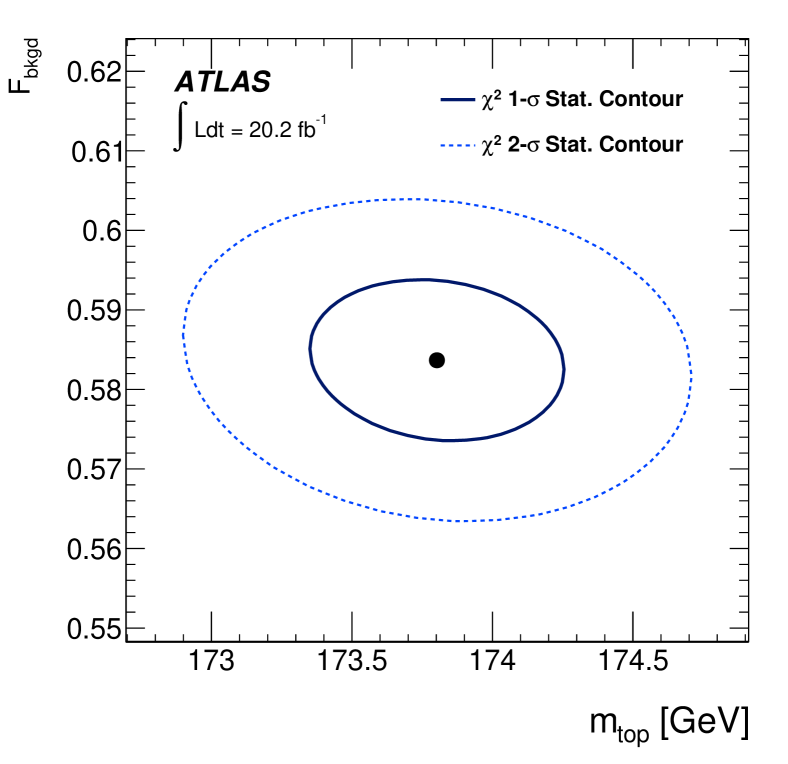
The dominant sources of systematic uncertainty in this measurement, despite the usage of the observable, come from the JES, hadronisation modelling and the -jet energy scale. This measurement is about 40% more precise than the previous measurement performed by ATLAS in the all-hadronic channel [13].
4 Measurement of in di-leptonic events at and
At the LHC, precise measurements of are sensitive to the the uncertainty on , to the gluon parton distribution function (PDF), the , and potential enhancements of the cross-section due to physics beyond the Standard Model. In the following the determination from the inclusive measurement in the di-leptonic channel, , is presented [14]. The main background comes from the associated production of a boson and a single top quark, the so called single top background. The analysis is performed on the ATLAS 2011 - 2012 collision data sample, corresponding to integrated luminosities of at and at . Events were required to pass either a single-electron or single-muon trigger, with thresholds chosen such that the efficiency plateau is reached for leptons with . MC simulated event samples were used to develop the analysis, to compare to the data and to evaluate signal and background efficiencies and uncertainties. The analysis makes use of reconstructed electrons, muons and -tagged jets. A preselection requiring exactly one electron and one muon was applied. Events with an opposite sign pair constituted the main analysis sample, whilst events with a same-sign pair were used in the estimation of the background from misidentified leptons. The production cross-section was determined by counting the numbers of opposite-sign events with exactly one and exactly two -tagged jets and was measured to be at , and at . where the four uncertainties arise from data statistics, experimental and theoretical systematic effects related to the analysis, knowledge of the integrated luminosity and of the LHC beam energy. The strong dependence of the theoretical prediction for on , offers the possibility of interpreting measurements of as measurements of . The theoretical calculations use for predictions. The dependence of the cross-section predictions on is shown in Figure 3, left plot, at and .
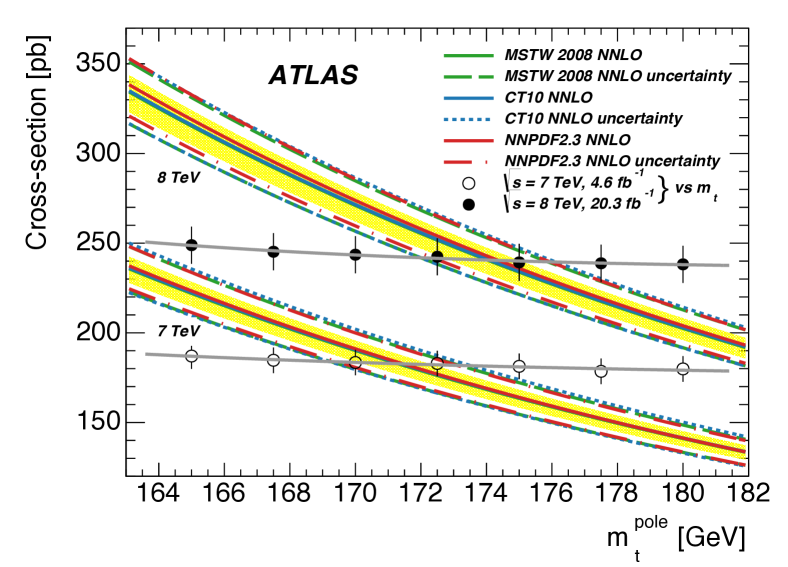
The function proposed in Ref. [15] was used to parameterise the dependence of on separately for each of the NNLO PDF sets CT10 [19, 20], MSTW [21] and NNPDF2.3 [22], together with their uncertainty. The left plot in Figure 3 also shows the small dependence of the experimental measurement of on the assumed value of , arising from variations in the acceptance and single top background. A comparison of the theoretical and experimental curves shown in this plot allows an unambiguous extraction of . The extraction is performed by maximising using a Bayesian likelihood as a function of [14]. The likelihood fit maximised separately for each PDF set and centre-of-mass energy to give values shown in Table 1.
| from | ||
|---|---|---|
| CT10 NNLO [19, 20] | ||
| MSTW NNLO [21] | ||
| NNPDF2.3 5f FFN [22] | ||
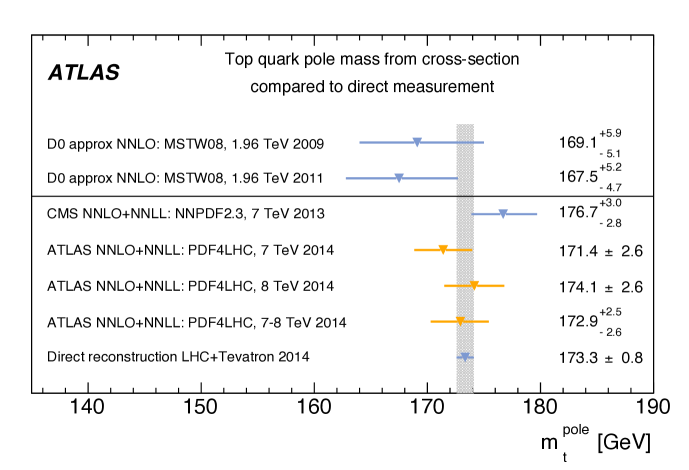
A single value was derived for each centre-of-mass energy giving () and (). Considering only uncorrelated experimental uncertainties, the two values are consistent at the level of standard deviations. Finally, was extracted from the combined and dataset using the product of likelihoods for each centre-of-mass energy and accounting for correlations via nuisance parameters. The resulting value using the envelope of all three considered PDF sets is . All extracted values are consistent with the or measurements obtained from kinematic reconstruction of events, see right plot in Figure 3.
References
- [1] ATLAS Collaboration, Phys. Lett. B 716, 1 (2012) [arXiv:1207.7214 [hep-ex]].
- [2] CMS Collaboration, Phys. Lett. B 716, 30 (2012) [arXiv:1207.7235 [hep-ex]].
- [3] G. Degrassi et al., JHEP 08, 098 (2012) [arXiv:1205.6497 [hep-ph]].
- [4] M. Baak et al. [Gfitter Group], Eur. Phys. J C 9, 74 (2014) [arXiv:1407.3792 [hep-ph]].
- [5] S. Alekhin et al., Phys. Lett. B716, 214-219 (2012) [arXiv:1207.0980 [hep-ph]].
- [6] S. Moch et al., DESY-14-081, (2014) [arXiv:1405.4781 [hep-ph]].
- [7] S. Moch, DESY-14-147, (2014) [arXiv:1408.6080 [hep-ph]].
- [8] U. Langenfeld et al., Phys. Rev. D80 (2009) [arXiv:0906.5273 [hep-ph]].
- [9] ATLAS Collaboration, JINST 3 S08003 (2008) [arXiv:1702.07546 [hep-ex]].
- [10] ATLAS Collaboration, Phys. Lett. C75 (2016) [arXiv:1606.02179 [hep-ex]].
- [11] ATLAS Collaboration, Eur. Phys. J. C75 (2015) [arXiv:1503.05427 [hep-ex]].
- [12] ATLAS Collaboration, JHEP 09 118 (2017) [arXiv:1702.07546 [hep-ex]].
- [13] ATLAS Collaboration, Eur. Phys. J. C75 (2015) [arXiv:1409.0832 [hep-ex]].
- [14] ATLAS Collaboration, Eur. Phys. J. C74 (2014) [arXiv:1406.5375 [hep-ex]].
- [15] M. Czakon, P. Fiedler, and A. Mitov, Phys. Rev. Lett. 110 (2013) [arXiv:1303.6254 [hep-ph]].
- [16] V. Abazov et al. [D0], Phys. Lett. B703 (2011) [arXiv:1104.2887 [hep-ex]].
- [17] CMS Collaboration, Phys. Lett. B728 (2014) [arXiv:1307.1907 [hep-ex]].
- [18] [ATLAS, CDF, CMS, D0], [arXiv:1403.4427 [hep-ex]].
- [19] H. L. Lai et al., Phys. Rev. D82 (2010) [arXiv:1007.2241 [hep-ph]].
- [20] J. Gao et al., Phys. Rev. D89 (2014) [arXiv:1302.6246 [hep-ph]].
- [21] A. D. Martin et al. Eur. Phys. J. C63 (2009) [arXiv:0901.0002 [hep-ph]].
- [22] R. Ball et al., Nucl. Phys. B867 (2013) [arXiv:1207.1303 [hep-ph]].