11email: A.L.Melchior@obspm.fr,Francoise.Combes@obspm.fr 22institutetext: Collège de France, 11, Place Marcelin Berthelot, F-75 005 Paris, France
Exhaustion of the gas next to M31’s supermassive black hole
New observations performed at IRAM Plateau de Bure reveal the absence of molecular gas next to Andromeda’s black hole. We derived a upper limit on the molecular gas mass of 4300 M⊙ for the linewidth of 1000 km s-1. This is compatible with infra-red observations which reveal a hole in dust emission next to the black hole. Some gas from stellar feedback is expected from the old eccentric stellar disc population, but it is not accreted close to the black hole. This absence of gas explains the absence of stellar formation observed in this region contrary to what is observed next to Sgr A* in the Milky Way. Either the gas has been swallowed by the black hole, or a feedback mechanism has pushed the gas outside the central 1 pc. Nevertheless, we detect a small clump of gas with a very small velocity dispersion at 2.4 from the black hole. It is probable that this clumpy gas is seen in projection, as it does not follow the rotation of the disk surrounding the black hole, its velocity dispersion is ten times smaller than the expected velocity gradient and the tidal shear from the black hole requires a gas density for this clump that is not compatible with our observations.
Key Words.:
galaxies: individual: M31; galaxies: kinematics and dynamics; submillimeter: ISM; molecular data1 Introduction
Andromeda is a galaxy, which lies in the green valley (Mutch et al. 2011; Tempel et al. 2011; Jin et al. 2014). According to Belfiore et al. (2016), it is typically a low ionisation emission-line region (LIER), as first observed by Rubin & Ford (1971) and discussed by Heckman (1996). González-Martín et al. (2015) discussed that the torus is disappearing in LIER: there is indeed little gas in the inner part of M31 (Melchior et al. 2000; Melchior & Combes 2011, 2013). It is the closest external large galaxy where we can explore the mechanisms that quenched the star formation activity. Optical ionised gas has been observed by Menezes et al. (2013) next to the black hole in a field of view111For compatibility reasons, we assume throughout this letter, a distance to M31 of 780 kpc, i.e. 1 arcsec 3.8 pc, following Melchior et al. (2000). of , but this emission is weak. Jacoby et al. (1985) estimate the ionised gas mass in the bulge () of the order of . It also hosts a very massive black hole of (Bender et al. 2005), but as studied by Li et al. (2011a), it is non-active and only murmurs at a level of . It hosts very little star formation of the order of 0.25-0.3 M⊙ yr-1, mainly located in the 10-kpc ring of the disc (e.g. Ford et al. 2013; Rahmani et al. 2016). Inside the central region () , no obvious sign of star formation is detected (e.g. Kang et al. 2012; Azimlu et al. 2011; Amiri & Darling 2016), beside a central cluster of A stars formed 200 Myr ago located next to the black hole (within ) (Lauer et al. 2012), designated by P3 by Bender et al. (2005). Viaene et al. (2014) estimate the star formation rate on a pixel basis with panchromatic spectral energy distribution modelling. This infrared-based SFR estimated in the central pixel () is yr-1, while an integration over the central 1-kpc radius region correspond to yr-1. This negligible SFR is much smaller than the value predicted by Rimoldi et al. (2016), considering supernovae remnants expected within the sphere of influence of quiescent supermassive black holes. For M31, a SFR of is expected in the sphere of influence (pc) of its supermassive black hole. A past AGN activity is also expected and the associated molecular torus, if it survives, should have a radius pc. In parallel, Chang et al. (2007) expect next to the black hole an accumulation of molecular gas (about M⊙) originating from stellar feed-back. In Melchior & Combes (2013), we estimate a minimum molecular mass of within from the centre, while about of gas is expected from stellar feedback (e.g. Gallagher & Hunter 1981).
In this letter, we present new observations of molecular gas with IRAM Plateau de Bure interferometer (PdBI). We discuss the implications of the non-detection of gas next to the black hole.
2 Observations
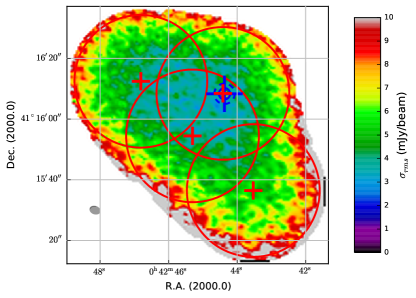
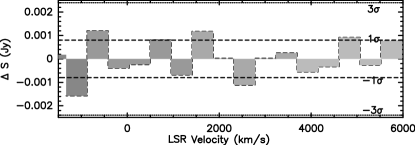
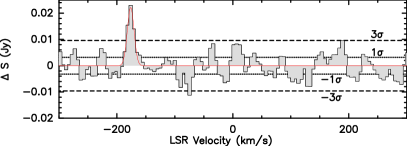
The 3-mm observations were carried out at IRAM PdBI with the 5-antenna configuration between 3rd September and 24th December 2012 in C-array and D-array. The receivers were tuned to a frequency of 115.386 GHz, to account for M31 systemic velocity (-300 km/s). We used the WideX correlator providing a broad frequency range of 3.6 GHz and 2 MHz spectral resolution. We thus probe a velocity range of 9000 km s-1. The integration time is about 6 hours per field, but for the field at the offset (-16.8,-21.5), which has been integrated less: as shown in Figure 1, the level of noise is larger in the South-West part of the data cube. After calibration within the GILDAS reduction package, the visibility set were processed with the MAPPING software. A 1-iteration CLEAN deconvolution was applied, in order to recover a primary-beam corrected data cube close to signal. The beam size of the final data was 3.37”2.44” (corresponding to 12.8 pc9.3 pc) with a position angle PA, while the data are sampled with a pixel size of 0.61. At the black hole position, we reach a sensitivity of mJy/beam at 1 with , and mJy/beam at 1 with , as displayed in Figure 2. The extremities of the band are more noisy and hence, a more optimistic value is found using the radiometer formula with mJy/beam at 1 with . We subsequently restrict our analysis to the velocity range (-300,+300) km/s. The Figure 1 displays the rms map obtained for each channel, where the signal has been removed.
3 Analysis
| RA DEC | VLSR | L (K | M | |||||
|---|---|---|---|---|---|---|---|---|
| (J2000) (J2000) | () | () | (km/s) | (km/s) | (mJy) | (Jy km/s) | km/s pc2) | (M⊙) |
| 00 42 44.52 41 16 10.1 | 1.7 | 1.7 | -176.1. | 14.3. | 22.2 | 0.320.05 | 48070 | 2000300 |
3.1 No accumulation of gas next to the black hole
If there were a gaseous disk/ring surrounding the black hole as observed in the Milky Way (e.g. Dahmen et al. 1998; Kauffmann et al. 2017) and in external galaxies (Ricci et al. 2015), given the black hole mass and the stellar velocity dispersion, one would expect a molecular gas signal of 2 mJy with a linewidth of about 1000 km s-1 according to Chang et al. (2007). This correspond to a M⊙ accumulation of molecular gas next to the black hole due to stellar feed-back from the eccentric inner stellar disc.
Following Solomon & Vanden Bout (2005), we can derive the molecular hydrogen mass with M⊙ (K km s-1 pc2)-1, and the line luminosity, in K km s-1 pc2:
| (1) |
with in Jy km s-1, in Mpc and in GHz. Relying on the level of noise we have reached, we estimate an (3 ) upper limit of the molecular gas mass in the beam of 4300 (resp. 2400 ) for a line width of 1000 km s-1 (resp. 300 km s-1 ). As discussed above, these values can be increased by 40% (resp. 30%) with a direct smoothing of the large band data.
3.2 Small gas clumps: residuals of a past molecular torus?
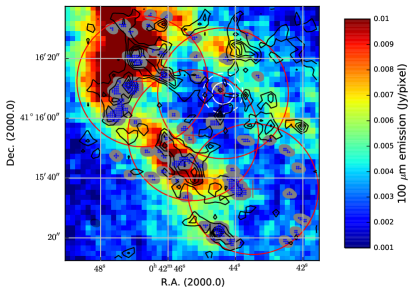
We investigate the possibility that the gas is present under the form of small clumps. Given the good velocity resolution and the quality of the interferometric data, we look for statistically significant weak signals, larger than 3 over a beam area, with the procedure described in Dassa-Terrier, Melchior & Combes (in prep.). The cores of the detected clumps have been plotted in the Figure 3 as blue crosses, while the beam associated with each detected pixel is represented in grey.
We can note that there is an overall correlation with the dust emission detected at 100m detected with Herschel/PACS, while CO exhibits a better correlation with the 8m dust emission map from Spitzer, displayed as contours in Figure 3. Next to the centre, the region of interest in this letter, there is no dust emission at 100m. Within 12, there is only 1 clump with a peak flux above , which will be discussed here. The other detections and their reliabilities will be discussed elsewhere (Dassa-Terrier et al., in prep).
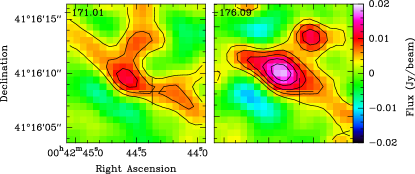
We extract the spectra of the remaining clump in GO VIEW in MAPPING/Gildas. We then analyse this spectra with CLASS in Gildas. The results are provided in Table 1. We estimate a velocity dispersion km/s, which corresponds to an estimated mass of the clump of 2000 M⊙. We checked that the signal is not resolved spatially as the integrated line in a single pixel or in the region of interest is about the same within the error bar. We thus assume they have a typical projected size of 5.2 pc (FWHM/2) corresponding to the beam size or a root-mean-squared (RMS) spatial size of pc. Figure 4 displays the channel map corresponding to this signal, while Figure 5 displays its spectra. In the following, we consider these upper values to discuss qualitative properties of this clump.
According to the Galactic velocity dispersion-size relation of Solomon et al. (1987), this clump lies above the relation. It has an apparent mass surface brightness 21/pc2 (computed within the FWHM area). It also lies well above the correlation between and discussed by Heyer et al. (2009). With these characteristics, one can question if a 2000 clump is gravitationally bound at a distance pc from the black hole. Indeed, it should have a density cm-3 to resist the tidal force from the supermassive black hole (Chen et al. 2016). This is much larger than the apparent mean density cm-3. This would correspond to a volume filling factor smaller than , which is well below the volume filling factor () estimated in Melchior & Combes (2016) in the gas present along the minor axis in the inner bulge. This suggests that the gas is clumped at a smaller scale, as observed in the Galaxy (e.g. Combes 2001; Heyer & Dame 2015). This would correspond to a clump size smaller than pc. In addition, one can note that the CO luminosity and derived mass are significantly smaller than the main clumps observed in he Central Molecular Zone (e.g. Oka et al. 2001).
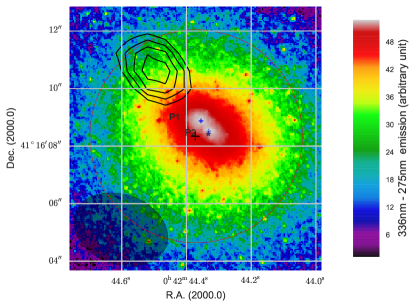
Last, one can consider constraints from the kinematics. A cloud in the gravitational field of the black hole would have a circular velocity of 360 km/s: if one considers an inclination of 55 (Bacon et al. 2001), one would expect a velocity of 200 km/s. If there are non-circular motions, this is not incompatible with the amplitude of our value -176 km/s. However, we would expect a velocity gradient within the beam of about 120 km/s, while we detect a velocity dispersion of 13 km/s. Figure 6 shows the location of the clump discussed here superimposed on an HST colour (336 nm 275 nm) image with respect to the position of the co-called P1, P2, P3 components.
These are convincing signs that this clump is probably not exactly in the mid-plane: if it were at 100 pc along the line of sight, this gas clump would have the CO critical density and a filling factor of 1. Then, it would not be in the sphere of influence of the black hole, and its real size and velocity dispersion are probably below our spectral and spatial resolutions.
Rosolowsky & Leroy (2006) discuss that diffuse emission can be missed due to interferometric filtering, but here we expect clumpy gas in this region with little filtering. In addition, these authors discussed that stable recovery of cloud properties can be achieved with a minimum signal-to-noise ratio of 10, while we reach 6.6. It is thus difficult to push more this type of analysis.
3.3 Comparison with properties derived from infrared data
Figure 3 shows that there is a deficit of 100 m emission next to the centre, in the region surrounding the black hole. Given the lack of resolution of infrared data, dust emission, which seems present in some maps in near and mid-infrared (Smith et al. 2012; Planck Collaboration et al. 2015), corresponds to the emission in the central region as displayed in Figure 3. Viaene et al. (2014) estimate a dust mass of 475 M⊙ in a 36″36″ pixel, which is 157 times larger that the PdB beam. The stellar continuum is also very strong next to the centre: Viaene et al. (2014) compute a stellar mass of 3.71 M⊙ in the same region. This central stellar component accounts for the central dust heating as discussed by Groves et al. (2012). This stellar mass corresponds to old stars and should produce some SNIa every 100 yr (Li et al. 2011b). Sjouwerman & Dickel (2001) has detected four supernovae remnants. These supernovae might maintain supersonic turbulence (Mac Low & Klessen 2004) and have contributed to expulse the gas from the central region.
4 Discussion
We have detected one molecular gas clump with an estimated mass of , within 2.4 (9 pc) from the centre. Figure 6 displays a superposition of the central CO clump intensity on the 336 nm - 275 nm PHAT/HST image of the central region. While our molecular gas is at the position angle of the P1-P2 disc it is blueshifted, while the stellar disc is redshifted. As discussed in Melchior & Combes (2011), it could be rotating in a different orbit, while it could also be not exactly in the mid-plane and belong to a more distant component like the inner disc or inner ring. In addition, as argued in Sect. 3.2, the detected velocity dispersion is incompatible with the velocity gradient expected in the gravitation field of a large black hole. We conclude that this clump is outside the sphere of influence of the black hole.
The upper limit we put on the mass of the molecular gas next to the black hole is not compatible with the expectations from stellar mass loss due to the inner eccentric stellar disk. Chang et al. (2007) predicted a gas mass of due to stellar mass loss and a CO(1-0) signal of 2 mJy and a linewidth of 1000 km.s-1 within 1 pc of the black hole. Our observations exclude it at the level of . Given the simultaneous absence of dust emission (Viaene et al. 2014) and of molecular gas (this work), we can argue that the stellar feed-back produced by the inner eccentric stellar disc population does not accumulate next to the black hole. Indeed, their model expects a compact source, which should have been detected by our interferometric observations. We can then question whether their proposed mechanism to produce the P3 star cluster is valid. Our result confirms that the current absence of star formation next to the black hole (e.g. Rosenfield et al. 2012; Groves et al. 2012) is due to the lack of gas. As discussed in Melchior & Combes (2011), the scenario of a frontal collision with M32 as proposed by Block et al. (2006) could account for the 2-ring morphology as well as for the absence of gas in the centre. In addition, the presence of a bipolar outflow soft X-ray emission, detected along the minor axis by Li & Wang (2007); Bogdán & Gilfanov (2008) and possibly triggered by supernova explosions, could account for part of the missing gas.
Acknowledgements.
Based on observations carried out with the IRAM Plateau de Bure Interferometer. IRAM is supported by INSU/CNRS (France), MPG (Germany) and IGN (Spain). We acknowledge the IRAM Plateau de Bure team for the observations. We thank Sabine Kœnig for her support for the data reduction. This project has benefited from supports from Programme National Cosmologie et Galaxies and Specific Actions ALMA and Structuration de l’Univers from Paris Observatory. We are most grateful to the anonymous referee for his/her very constructive comments, which helped us to substantially improve the manuscript. A special thanks to Nelson Caldwell for providing a PHAT extract of the central field of Andromeda.References
- Amiri & Darling (2016) Amiri, N., & Darling, J. 2016, ApJ, 826, 136
- Azimlu et al. (2011) Azimlu, M., Marciniak, R., & Barmby, P. 2011, AJ, 142, 139
- Bacon et al. (2001) Bacon, R., Emsellem, E., Combes, F., et al. 2001, A&A, 371, 409
- Belfiore et al. (2016) Belfiore, F., Maiolino, R., Maraston, C., et al. 2016, MNRAS,
- Bender et al. (2005) Bender, R., Kormendy, J., Bower, G., et al. 2005, ApJ, 631, 280
- Block et al. (2006) Block, D. L., Bournaud, F., Combes, F., et al. 2006, Nature, 443, 832
- Bogdán & Gilfanov (2008) Bogdán, Á., & Gilfanov, M. 2008, MNRAS, 388, 56
- Chang et al. (2007) Chang, P., Murray-Clay, R., Chiang, E., & Quataert, E. 2007, ApJ, 668, 236
- Chen et al. (2016) Chen, X., Amaro-Seoane, P., & Cuadra, J. 2016, ApJ, 819, 138
- Combes (2001) Combes, F. 2001, Astrophysics and Space Science Supplement, 277, 29
- Crane et al. (1992) Crane, P. C., Dickel, J. R., & Cowan, J. J. 1992, ApJ, 390, L9
- Dahmen et al. (1998) Dahmen, G., Huttemeister, S., Wilson, T. L., & Mauersberger, R. 1998, A&A, 331, 959
- Dalcanton et al. (2012) Dalcanton, J. J., Williams, B. F., Lang, D., et al. 2012, ApJS, 200, 18
- de Vaucouleurs & Corwin (1985) de Vaucouleurs, G., & Corwin, H. G., Jr. 1985, ApJ, 295, 287
- Ford et al. (2013) Ford, G. P., Gear, W. K., Smith, M. W. L., et al. 2013, ApJ, 769, 55
- Gallagher & Hunter (1981) Gallagher, J. S., & Hunter, D. A. 1981, AJ, 86, 1312
- González-Martín et al. (2015) González-Martín, O., Masegosa, J., Márquez, I., et al. 2015, A&A, 578, A74
- Groves et al. (2012) Groves, B., Krause, O., Sandstrom, K., et al. 2012, MNRAS, 426, 892
- Heckman (1996) Heckman, T. M. 1996, The Physics of Liners in View of Recent Observations, 103, 241
- Heyer et al. (2009) Heyer, M., Krawczyk, C., Duval, J., & Jackson, J. M. 2009, ApJ, 699, 1092
- Heyer & Dame (2015) Heyer, M., & Dame, T. M. 2015, ARA&A, 53, 583
- Jacoby et al. (1985) Jacoby, G. H., Ford, H., & Ciardullo, R. 1985, ApJ, 290, 136
- Jin et al. (2014) Jin, S.-W., Gu, Q., Huang, S., Shi, Y., & Feng, L.-L. 2014, ApJ, 787, 63
- Jedrzejewski (1987) Jedrzejewski, R. I. 1987, MNRAS, 226, 747
- Kang et al. (2012) Kang, Y., Rey, S.-C., Bianchi, L., et al. 2012, ApJS, 199, 37
- Kauffmann et al. (2017) Kauffmann, J., Pillai, T., Zhang, Q., et al. 2017, A&A, 603, A89
- Lauer et al. (2012) Lauer, T. R., Bender, R., Kormendy, J., Rosenfield, P., & Green, R. F. 2012, ApJ, 745, 121
- Li & Wang (2007) Li, Z., & Wang, Q. D. 2007, ApJ, 668, L39
- Li et al. (2011a) Li, Z., Garcia, M. R., Forman, W. R., et al. 2011, ApJ, 728, L10
- Li et al. (2011b) Li, W., Chornock, R., Leaman, J., et al. 2011, MNRAS, 412, 1473
- Mac Low & Klessen (2004) Mac Low, M.-M., & Klessen, R. S. 2004, Reviews of Modern Physics, 76, 125
- Melchior et al. (2000) Melchior, A.-L., Viallefond, F., Guélin, M., & Neininger, N. 2000, MNRAS, 312, L29
- Melchior & Combes (2011) Melchior, A.-L., & Combes, F. 2011, A&A, 536, A52
- Melchior & Combes (2013) Melchior, A.-L., & Combes, F. 2013, A&A, 549, A27
- Melchior & Combes (2016) Melchior, A.-L., & Combes, F. 2016, A&A, 585, A44
- Menezes et al. (2013) Menezes, R. B., Steiner, J. E., & Ricci, T. V. 2013, ApJ, 762, L29
- Mutch et al. (2011) Mutch, S. J., Croton, D. J., & Poole, G. B. 2011, ApJ, 736, 84
- Oka et al. (2001) Oka, T., Hasegawa, T., Sato, F., et al. 2001, ApJ, 562, 348
- Planck Collaboration et al. (2015) Planck Collaboration, Ade, P. A. R., Aghanim, N., et al. 2015, A&A, 582, A28
- Rahmani et al. (2016) Rahmani, S., Lianou, S., & Barmby, P. 2016, MNRAS, 456, 4128
- Ricci et al. (2015) Ricci, T. V., Steiner, J. E., & Menezes, R. B. 2015, MNRAS, 451, 3728
- Rimoldi et al. (2016) Rimoldi, A., Rossi, E. M., Costantini, E., & Portegies Zwart, S. 2016, MNRAS, 456, 2537
- Rosenfield et al. (2012) Rosenfield, P., Johnson, L. C., Girardi, L., et al. 2012, ApJ, 755, 131
- Rosolowsky & Leroy (2006) Rosolowsky, E., & Leroy, A. 2006, PASP, 118, 590
- Rosolowsky & Leroy (2011) Rosolowsky, E., & Leroy, A. 2011, Astrophysics Source Code Library, ascl:1102.012
- Rubin & Ford (1971) Rubin, V. C., & Ford, W. K., Jr. 1971, ApJ, 170, 25
- Sjouwerman & Dickel (2001) Sjouwerman, L. O., & Dickel, J. R. 2001, Young Supernova Remnants, 565, 433
- Smith et al. (2012) Smith, M. W. L., Eales, S. A., Gomez, H. L., et al. 2012, ApJ, 756, 40
- Solomon et al. (1987) Solomon, P. M., Rivolo, A. R., Barrett, J., & Yahil, A. 1987, ApJ, 319, 730
- Solomon & Vanden Bout (2005) Solomon, P. M., & Vanden Bout, P. A. 2005, ARA&A, 43, 677
- Tempel et al. (2011) Tempel, E., Tuvikene, T., Tamm, A., & Tenjes, P. 2011, A&A, 526, A155
- Viaene et al. (2014) Viaene, S., Fritz, J., Baes, M., et al. 2014, A&A, 567, A71