Effect of risk perception on epidemic spreading in temporal networks
Abstract
Many progresses in the understanding of epidemic spreading models have been obtained thanks to numerous modeling efforts and analytical and numerical studies, considering host populations with very different structures and properties, including complex and temporal interaction networks. Moreover, a number of recent studies have started to go beyond the assumption of an absence of coupling between the spread of a disease and the structure of the contacts on which it unfolds. Models including awareness of the spread have been proposed, to mimic possible precautionary measures taken by individuals that decrease their risk of infection, but have mostly considered static networks. Here, we adapt such a framework to the more realistic case of temporal networks of interactions between individuals. We study the resulting model by analytical and numerical means on both simple models of temporal networks and empirical time-resolved contact data. Analytical results show that the epidemic threshold is not affected by the awareness but that the prevalence can be significantly decreased. Numerical studies highlight however the presence of very strong finite-size effects, in particular for the more realistic synthetic temporal networks, resulting in a significant shift of the effective epidemic threshold in the presence of risk awareness. For empirical contact networks, the awareness mechanism leads as well to a shift in the effective threshold and to a strong reduction of the epidemic prevalence.
I Introduction
The propagation patterns of an infectious disease depend on many factors, including the number and properties of the different stages of the disease, the transmission and recovery mechanisms and rates, and the hosts’ behavior (e.g., their contacts and mobility) Keeling and Rohani (2008); Anderson and May (1991). Given the inherent complexity of a microscopic description taking into account all details, simple models are typically used as basic mathematical frameworks aiming at capturing the main characteristics of the epidemic spreading process and in particular at understanding if and how strategies such as quarantine or immunization can help contain it. Such models have been developed with increasing levels of sophistication and detail in the description of both the disease evolution and the behaviour of the host population Keeling and Rohani (2008); Anderson and May (1991).
The most widely used assumption concerning the disease evolution within each host consists in discretizing the possible health status of individuals Keeling and Rohani (2008); Anderson and May (1991). For instance, in the Susceptible-Infectious-Susceptible (SIS) model, each individual is considered either healthy and susceptible (S) or infectious (I). Susceptible individuals can become infectious through contact with an infectious individual, and recover spontaneously afterwards, becoming susceptible again. In the Susceptible-Infectious-Recovered (SIR) case, recovered individuals are considered as immunized and cannot become infectious again. The rate of infection during a contact is assumed to be the same for all individuals, as well as the rate of recovery.
Obviously, the diffusion of the disease in the host population depends crucially on the patterns of contacts between hosts. The simplest homogeneous mixing assumption, which makes many analytical results achievable, considers that individuals are identical and that each has a uniform probability of being in contact with any other individual Keeling and Rohani (2008); Anderson and May (1991). Even within this crude approximation, it is possible to highlight fundamental aspects of epidemic spreading, such as the epidemic threshold, signaling a non-equilibrium phase transition that separates an epidemic-free phase from a phase in which a finite fraction of the population is affected Keeling and Rohani (2008). However, this approach neglects any non-trivial structure of the contacts effectively occurring within a population, while advances in network science Newman (2010) have shown that a large number of networks of interest have in common important features such as a strong heterogeneity in the number of connections, a large number of triads, a community structure, and a low average shortest path length between two individuals Caldarelli (2007); Newman (2010). Spreading models have thus been adapted to complex networks, and studies have unveiled the important role of each of these properties Pastor-Satorras and Vespignani (2001); Barrat et al. (2008); Pastor-Satorras et al. (2015). More recently, a number of studies have also considered spreading processes on time-varying networks Holme and Saramäki (2012); Karsai et al. (2011); Stehlé et al. (2011); Machens et al. (2013); Valdano et al. (2015); Holme (2015), to take into account the fact that contact networks evolve on various timescales and present non-trivial temporal properties such as broad distribution of contact durations Cattuto et al. (2010); Barrat et al. (2014) and burstiness Barabàsi (2005); Holme and Saramäki (2012) (i.e., the timeline of social interactions of a given individual exhibits periods of time with intense activity separated by long quiescent periods with no interactions).
All these modeling approaches consider that the propagation of the disease takes place on a substrate (the contacts between individuals) that does not depend on the disease itself. In this framework, standard containment measures consist in the immunization of individuals, in order to effectively remove them from the population and thus break propagation paths. Immunization can also (in models) be performed in a targeted way, trying to identify the most important (class of) spreaders and to suppress propagation in the most efficient possible way Pastor-Satorras and Vespignani (2002); Cohen et al. (2003). An important point to consider however is that the structure and properties of contacts themselves can in fact be affected by the presence of the disease in the population, as individuals aware of the disease can modify their behaviour in spontaneous reaction in order to adopt self-protecting measures such as vaccination or mask-wearing. A number of studies have considered this issue along several directions (see Ref. Funk et al. (2010) for a review). For instance, some works consider an adaptive evolution of the network Gross and Blasius (2008) with probabilistic redirection of links between susceptible and infectious individuals, to mimic the fact that a susceptible individual might be aware of the infectious state of some of his/her neighbors, and therefore try to avoid contact with them.
Other works introduce behavioral classes in the population, depending on the awareness to the disease Perra et al. (2011), possibly consider that the awareness of the disease propagates on a different (static) network than the disease itself, and that being aware of the disease implies a certain level of immunity to it Granell et al. (2013); Massaro and Bagnoli (2014). Finally, the fact that an individual takes self-protecting measures that decrease his/her probability to be infected (such as wearing a mask or washing hands more frequently) can depend on the fraction of infectious individuals present in the whole population or among the neighbors of an individual. These measures are then modeled by the fact that the probability of a susceptible catching the disease from an infectious neighbor depends on such fractions Bagnoli et al. (2007); Kotnis and Kuri (2013); Rizzo et al. (2014); Cao, Lang (2014). Yet these studies mostly consider contacts occurring on a static underlying contact network (see however Kotnis and Kuri (2013); Rizzo et al. (2014) for the case of a temporal network in which awareness has the very strong effect of reducing the activity of individuals and their number of contacts, either because they are infectious or because of a global knowledge of the overall incidence of the disease).
Here, we consider instead the following scenario: First, individuals are connected by a time-varying network of contacts, which is more realistic than a static one; second, we use the scenario of a relatively mild disease, which does not disrupt the patterns of contacts but which leads susceptible individuals who witness the disease in other individuals to take precautionary measures. We do not assume any knowledge of the overall incidence, which is usually very difficult to know in a real epidemic, especially in real time. We consider SIS and SIR models and both empirical and synthetic temporal networks of contacts. We extend the concept of awareness with respect to the state of neighbors from static to temporal networks and perform extensive numerical simulations to uncover the change in the phase diagram (epidemic threshold and fraction of individuals affected by the disease) as the parameters describing the reaction of the individuals are varied.
II Temporal networks
We will consider as substrate for epidemic propagation both synthetic and empirical temporal networks of interactions. We describe them succinctly in the following Subsections.
II.1 Synthetic networks
II.1.1 Activity-driven network model
The activity driven (AD) temporal network model proposed in Ref. Perra et al. (2012) considers a population of individuals (agents), each agent characterized by an activity potential , defined as the probability that he/she engages in a social act/connection with other agents per unit time. The activity of the agents is a (quenched) random variable, extracted from the activity potential distribution , which can take a priori any form. The temporal network is built as follows: at each time step , we start with disconnected individuals. Each individual becomes active with probability . Each active agent generates links (starts social interactions) that are connected to other agents selected uniformly at random (among all agents, not only active ones) 111Note that with such a definition, an agent may both receive and emit a link to the same other agent. However, we consider here an unweighted and undirected graph, thus in such a case, a single link is considered. Moreover, in the limit of large , the probability of such an event goes to .. The resulting set of individuals and links defines the instantaneous network . At the next time step, all links are deleted and the procedure is iterated. For simplicity, we will here consider .
In Ref. Perra et al. (2012) it was shown that several empirical networks display broad distributions of node activities, with functional shapes close to power-laws for , with exponents between and . The aggregation of the activity-driven temporal network over a time-window of length yields moreover a static network with a long-tailed degree distribution of the form Perra et al. (2012); Starnini and Pastor-Satorras (2013). Indeed, the individuals with the highest activity potential tend to form a lot more connections than the others and behave as hubs, which are known to play a crucial role in spreading processes Pastor-Satorras et al. (2015).
II.1.2 Activity-driven network model with memory
A major shortcoming of the activity-driven model lies in the total absence of correlations between the connections built in successive time steps. It is therefore unable to reproduce a number of features observed in empirical data. An extension of the model tackles this issue by introducing a memory effect into the mechanism of link creation Karsai et al. (2014). In the resulting activity-driven model with memory (ADM), each individual keeps track of the set of other individuals with whom there has been an interaction in the past. At each time step we start as in the AD model with disconnected individuals, and each individual becomes active with probability . For each link created by an active individual , the link goes with probability to one of the individuals previously encountered by , and with probability towards a never encountered one. In this way, contacts with already encountered other individuals have a larger probability to be repeated and are reinforced. As a result, for a power-law distributed activity , the degree distribution of the temporal network aggregated on a time window becomes narrow, while the distribution of weights (defined as the number of interactions between two individuals) becomes broad Karsai et al. (2014).
II.2 Empirical social networks
In addition to the simple models described above, which do not exhibit all the complexity of empirical data, we also consider two datasets gathered by the SocioPatterns collaboration Soc , which describe close face-to-face contacts between individuals with a temporal resolution of seconds in specific contexts (for further details, see Ref. Cattuto et al. (2010)). We consider first a dataset describing the contacts between students of nine classes of a high school (Lycée Thiers, Marseilles, France), collected during days in Dec. 2012 (“Thiers” dataset) Sch ; Fournet and Barrat (2014). We also use another dataset consisting in the temporal network of contacts between the participants of a conference (2009 Annual French Conference on Nosocomial Infections, Nice, France) during one day (“SFHH” dataset) Stehlé et al. (2011). The SFHH (conference) data correspond to a rather homogeneous contact network, while the Thiers (high school) population is structured in classes of similar sizes and presents contact patterns that are constrained by strict and repetitive school schedules. In Table 1 we provide a brief summary of the main properties of these two datasets.
| Dataset | ||||||
|---|---|---|---|---|---|---|
| Thiers | 180 | 14026 | 5.67 | 2.28 | 24.66 | 500.5 |
| SFHH | 403 | 3801 | 26.14 | 2.69 | 47.47 | 348.7 |
III Modelling epidemic spread in temporal networks
III.1 Epidemic models and epidemic threshold
We consider the paradigmatic Susceptible-Infectious-Susceptible (SIS) and Susceptible-Infectious-Recovered (SIR) models to describe the spread of a disease in a fixed population of individuals. In the SIS model, each individual belongs to one of the following compartments: healthy and susceptible (S) or diseased and infectious (I). A susceptible individual in contact with an infectious becomes infectious at a given constant rate, while each infectious recovers from infection at another constant rate. In the SIR case, infectious individuals enter the recovered (R) compartment and cannot become infectious anymore. We consider a discrete time modeling approach, in which the contacts between individuals are given by a temporal network encoded in a time-dependent adjacency matrix taking value if individuals and are in contact at time , and otherwise. At each time step, the probability that a susceptible individual becomes infectious is thus given by , where is the infection probability, and is the state of node ( if node is infectious and otherwise). We define as the probability that an infectious individual recovers during a time step. The competition between the transmission and recovery mechanisms determines the epidemic threshold. Indeed, if is not large enough to compensate the recovery process ( smaller than a critical value), the epidemic outbreak will not affect a finite portion of the population, dying out rapidly. On the other hand, if is large enough, the spread can lead in the SIS model to a non-equilibrium stationary state in which a finite fraction of the population is in the infectious state. For the SIR model, on the other hand, the epidemic threshold is determined by the fact that the fraction of individuals in the recovered state at the end of the spread becomes finite for larger than the threshold.
In order to numerically determine the epidemic threshold of the SIS model, we adapt the method proposed in Refs. Boguñá et al. (2013); Mata et al. (2015), which consists in measuring the lifetime and the coverage of realizations of spreading events, where the coverage is defined as the fraction of distinct nodes ever infected during the realization. Below the epidemic threshold, realizations have a finite lifetime and the coverage goes to in the thermodynamic limit. Above threshold, the system in the thermodynamic limit has a finite probability to reach an endemic stationary state, with infinite lifetime and coverage going to , while realizations that do not reach the stationary state have a finite lifetime. The threshold is therefore found as the value of where the average lifetime of non-endemic realizations diverges. For finite systems, one can operationally define an arbitrary maximum coverage (for instance ) above which a realization is considered endemic, and look for the peak in the average lifetime of non-endemic realizations as a function of .
In the SIR model the lifetime of any realization is finite. We thus evaluate the threshold as the location of the peak of the relative variance of the fraction of recovered individuals at the end of the process Castellano and Pastor-Satorras (2016), i.e.,
| (1) |
III.2 Modeling risk perception
To model risk perception, we consider the approach proposed in Ref. Bagnoli et al. (2007) for static interaction networks. In this framework, each individual is assumed to be aware of the fraction of his/her neighbors who are infectious at each time step. This awareness leads the individual to take precautionary measures that decrease its probability to become infectious upon contact. This decrease is modeled by a reduction of the transmission probability by an exponential factor: at each time step, the probability of a susceptible node in contact with an infectious to become infectious depends on the neighborhood of and is given by where is the number of neighbors of , the number of these neighbors that are in the infectious state at time , and is a parameter tuning the degree of awareness or amount of precautionary measures taken by individuals.
Static networks of interactions are however only a first approximation and real networks of contacts between individuals evolve on multiple timescales Barrat et al. (2014). We therefore consider in the present work, more realistically, that the set of neighbors of each individual changes over time. We need thus to extend the previous concept of neighborhood awareness to take into account the history of the contacts of each individual and his/her previous encounters with infectious individuals. We consider that longer contacts with infectious individuals should have a stronger influence on a susceptible individual’s awareness, and that the overall effect on any individual depends on the ratio of the time spent in contact with infectious to the total time spent in contact with other individuals. Indeed, two individuals spending a given amount of time in contact with infectious individuals may react differently depending on whether these contacts represent a large fraction of their total number of contacts or not. We moreover argue that the awareness is influenced only by recent contacts, as having encountered ill individuals in a distant past is less susceptible to lead to a change of behaviour. To model this point in a simple way, we consider that each individual has a finite memory of length and that only contacts taking place in the time window , in which the present time is excluded, are relevant.
We thus propose the following risk awareness change of behaviour: The probability for a susceptible individual , in contact at time with an infectious one, to become infectious, is given by
| (2) |
where is the number of contacts with infectious individuals seen by the susceptible during the interval , divided by the total number of contacts counted by the individual during the same time window (repeated contacts between the same individuals are also counted). is a parameter gauging the strength of the awareness, and the case corresponds to the pure SIS process, in which for all individuals and at all times.
IV Epidemic spreading on synthetic networks
IV.1 SIS dynamics
IV.1.1 Analytical approach
On a synthetic temporal network, an infectious individual can propagate the disease only when he/she is in contact with a susceptible. As a result, the spreading results from an interplay between the recovery time scale , the propagation probability conditioned on the existence of a contact and the multiple time scales of the network as emerging from the distribution of nodes’ activity . Analogously to what is done for heterogeneous static networks Barrat et al. (2008); Pastor-Satorras et al. (2015), it is possible to describe the spread at a mean-field level by grouping nodes in activity classes: all nodes with the same activity are in this approximation considered equivalent Perra et al. (2012). The resulting equation for the evolution of the number of infectious nodes in the class of nodes with activity in the original AD model has been derived in Ref. Perra et al. (2012) and reads
| (3) |
where and are the number of infectious and susceptible nodes with activity , verifying .
From this equation one can show, by means of a linear stability analysis, that there is an endemic non-zero steady state if and only if Perra et al. (2012). Noticing that may be regarded as the highest statistically significant activity rate, the interpretation of this equation becomes clear: the epidemic can propagate to the whole network when the smallest time scale of relevance for the infection process is smaller than the time scale of recovery.
Let us now consider the introduction of risk awareness in the SIS dynamics on AD networks. In general, we can write for a susceptible with activity
| (4) |
where the denominator accounts for the average number of contacts of an individual with activity in time steps. In the steady state, where the quantities become independent of , the dependence on in Eq. (4) vanishes, since both the average time in contact with infectious individuals and the average total time in contact are proportional to the time window width. Introducing this expression into Eq. (2), we obtain
| (5) |
which can be inserted into Eq. (3). Setting without loss of generality, we obtain the steady state solution
| (6) |
where and we have defined
| (7) | |||||
| (8) |
Introducing Eqs. (5) and (6) into Eqs. (7) and (8), and expanding at second order in and , we obtain after some computations the epidemic threshold
| (9) |
Moreover, setting and expanding at order 1 in we obtain
| (10) |
where
| (11) | |||||
This indicates that, at the mean-field level, the epidemic threshold is not affected by the awareness. Nevertheless, the density of infectious individuals in the vicinity of the threshold is reduced as the awareness strength grows.
In the case of activity driven networks with memory (ADM), no analytical approach is available for the SIS dynamics, even in the absence of awareness. The numerical investigation carried out in Ref. Sun et al. (2015) has shown that the memory mechanism, which leads to the repetition of some contacts, reinforcing some links and yielding a broad distribution of weights, has a strong effect in the SIS model. Indeed, the repeating links help the reinfection of nodes that have already spread the disease and make the system more vulnerable to epidemics. As a result, the epidemic threshold is reduced with respect to the memory-less (AD) case. For the SIS dynamics with awareness on ADM networks, we will now resort to numerical simulations.
IV.1.2 Numerical simulations
In order to inspect in details the effect of risk awareness on the SIS epidemic process, we perform extensive numerical simulations. Following Refs. Perra et al. (2012); Sun et al. (2015), we consider a distribution of nodes’ activities of the form for , where is a lower activity cut-off introduced to avoid divergences at small activity values. In all simulations we set and . We consider networks up to a size and a SIS process starting with a fraction of infectious nodes chosen at random in the population. In order to take into account the connectivity of the instantaneous networks, we use as a control parameter the quantity , where is the per capita rate of infection Perra et al. (2012). Notice that the average degree of an instantaneous network is Starnini and Pastor-Satorras (2013). With this definition, the critical endemic phase corresponds to
| (12) |
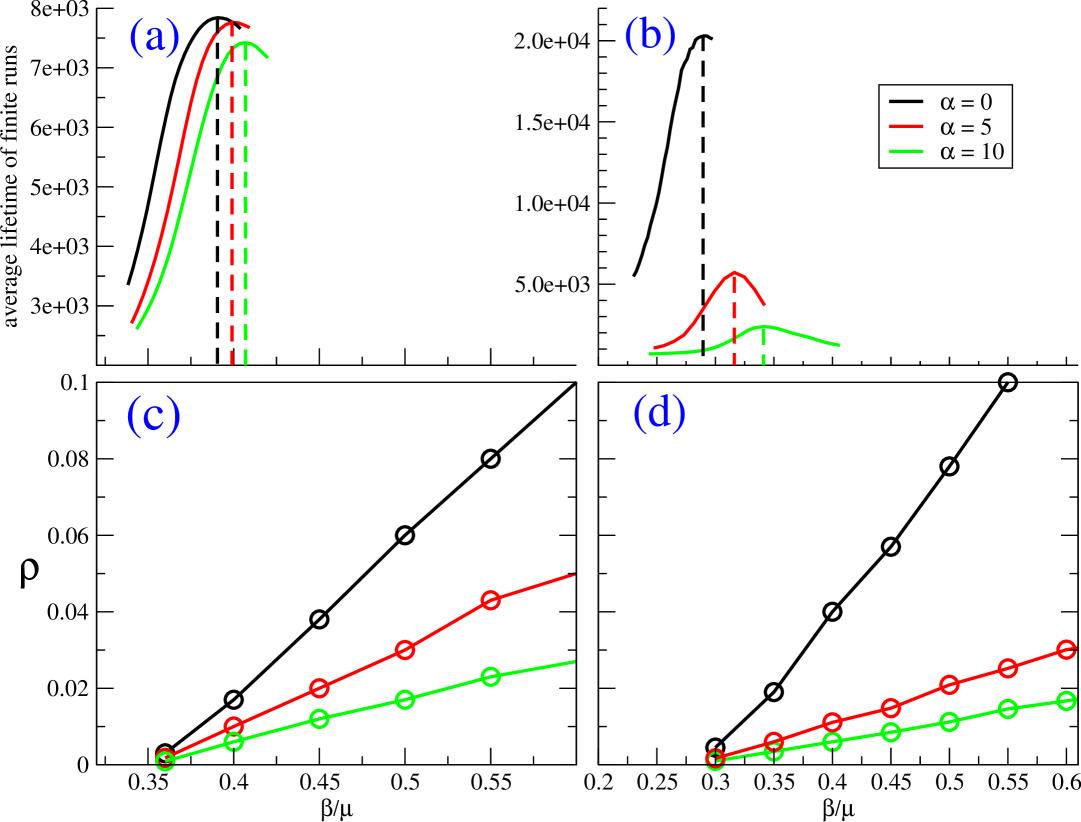
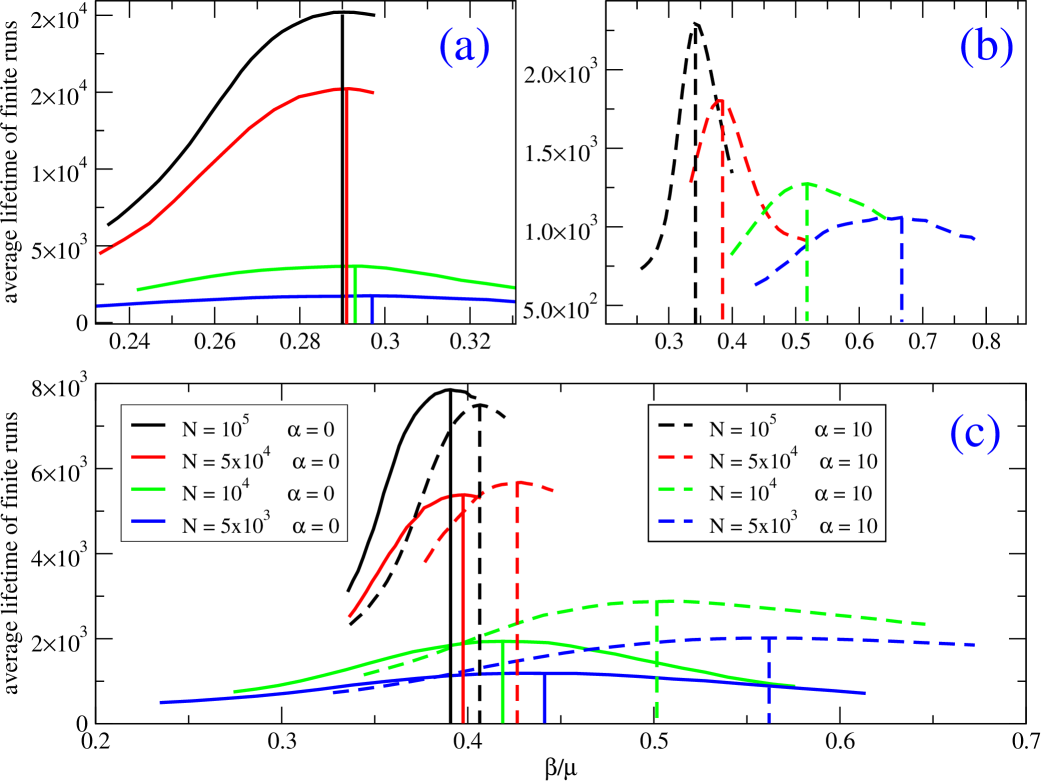
In Fig. 1 we first explore the effect of the strength of risk awareness, as measured by the parameter , in the case , i.e., when each agent is influenced by the whole history of his/her past contacts, a situation in which awareness effects should be maximal. We plot the steady state average fraction of infectious nodes as a function of for three different values of , and evaluate the position of the effective epidemic threshold, as measured by the peak of the average lifetime of non-endemic realizations, see Sec. III.1. Figures 1c) and d) indicate that the effect of awareness in the model (), with respect to the pure SIS model () is to reduce the fraction of infectious individuals for all values of , and Figures 1a) and b) seem to indicate in addition a shift of the effective epidemic threshold to larger values. This effect is more pronounced for the ADM than for the AD networks. As this shift of the epidemic threshold is in contradiction, at least for the AD case, with the mean-field analysis of the previous paragraphs, we investigate this issue in more details in Fig. 2, where we show, both for the pure SIS model () and for a positive value of , the average lifetime of non-endemic realizations for various system sizes. Strong finite-size effects are observed, especially for the model with awareness (). Fitting the values of the effective threshold (the position of the lifetime peak) with a law of the form , typical of finite-size scaling analysis Cardy (1988), leads to a threshold in the thermodynamic limit of for the pure SIS model on AD networks, for AD with (SIS model with awareness), for ADM with (pure SIS model) and for ADM with . We notice here that the extrapolations for are less accurate and thus with larger associated errors. Nevertheless, with the evidence at hand, we can conclude that, within error bars, the risk perception has no effect on the epidemic threshold in the thermodynamic limit, in agreement with the result from Eq. (12), that gives a theoretical threshold for the AD case. It is however noteworthy that the effective epidemic threshold measured in finite systems can be quite strongly affected by the awareness mechanism, even for quite large systems, and in a particularly dramatic way for ADM networks.
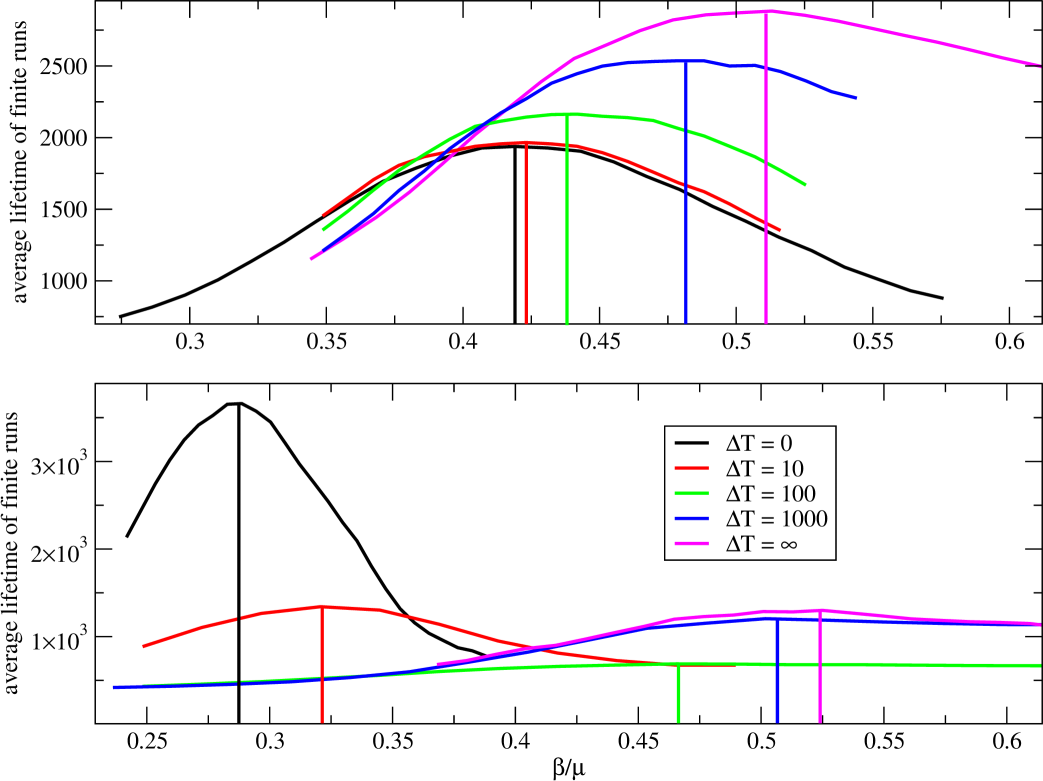
We finally explore in Fig. 3 the effect of a varying memory length , at fixed risk awareness strength . In both AD and ADM networks, an increasing awareness temporal window shifts the effective epidemic threshold towards larger values, up to a maximum given by , when the whole system history is available. For the ADM networks, this effect is less clear because of the changing height of the maximum of the lifespan when increasing . For AD networks, this result is apparently at odds with the mean-field analysis in which is irrelevant in the stationary state. We should notice, however, that for , the critical point is unchanged in the thermodynamic limit with respect to the pure SIS dynamics. Given that for the effects of awareness are the strongest, we expect that a finite will not be able to change the threshold in the infinite network limit. We can thus attribute the shifts observed to pure finite size effects. Note that this effect is also seen in homogeneous AD networks with uniform activity (data not shown), observation that we can explain as follows: when is small, the ratio of contacts with infectious recorded by an individual can differ significantly from the overall ratio recorded in the whole network in the same time window, which is equal to (for a uniform activity). Mathematically, we have
| (13) |
by concavity of the exponential function. Thus, even if locally and temporarily some individuals perceive an overestimated prevalence of the epidemics and reduce their probability of being infected accordingly, on average the reduction in the transmission rate would be larger if the ensemble average were used instead of the temporal one, and thus the epidemics is better contained in the former case. As increases, the temporal average becomes closer to the ensemble one and the effect of awareness increases. When is large enough compared to the time scale of variation of the network , the local time recording becomes equivalent to an ensemble average, and we recover the mean-field situation.
IV.2 SIR dynamics
IV.2.1 Analytical approach
Following an approach similar to the case of the SIS model, the SIR model has been studied at the heterogeneous mean field level in AD networks, in terms of a set of equations for the state of nodes with activity , which takes the form Liu et al. (2014)
| (14) | |||||
where is the total number of nodes with activity , and and are the number of nodes with activity in the infectious and recovered states, respectively. Again, a linear stability analysis shows the presence of a threshold, which takes the same form as in the SIS case:
| (15) |
The same expression can be obtained by a different approach, based on the mapping of the SIR processes to bond percolation Starnini and Pastor-Satorras (2014).
Since the SIR model lacks a steady state, we cannot apply in the general case the approach followed in the previous section. The effects of risk perception can be however treated theoretically for a homogeneous network (uniform activity) in the limit , which is defined by the effective infection probability
| (16) |
Even this case is hard to tackle analytically, so that we consider instead a modified model defined by the infection probability
| (17) |
In this definition the fraction of infectious seen by an individual is no longer averaged over the memory length but rather accumulated over the memory timespan, so that we expect stronger effects of the risk perception with respect to Eq. (15), if any. The fraction of susceptibles and the fraction of recovered in the system obey the equations
| (18) | |||||
| (19) |
where in the first equation we have used the second equation to replace in by (with the initial conditions ).
Setting without loss of generality, the final average fraction of recovered individuals after the end of an outbreak is given by
| (20) |
Close to the threshold, i.e., for , performing an expansion up to second order and imposing the initial condition , we obtain the asymptotic solution
| (21) |
which leads to the critical infection rate . This means that, as for the SIS case, the risk perception does not affect the epidemic threshold at the mean field level, at least for a homogeneous network. The only effect of awareness is a depression of the order parameter with , as observed also in the SIS case. The same conclusion is expected to hold for the original model of awareness, with an infection rate of the form Eq. (16) as in this case the dynamics is affected to a lower extent. In analogy, for the general case of an heterogeneous AD network, with rate infection given by Eq. (2), we expect the effects of awareness on the epidemic threshold to be negligible at the mean-field level.
On ADM networks, the numerical analysis of the SIR model carried out in Ref. Sun et al. (2015) has revealed a picture opposite to the SIS case. In an SIR process indeed, reinfection is not possible; as a result, repeating contacts are not useful for the diffusion of the infection. The spread is thus favoured by the more random patterns occurring in the memory-less (AD) case, which allows infectious nodes to contact a broader range of different individuals and find new susceptible ones. The epidemic threshold for SIR processes is hence higher in the ADM case than in the AD one Sun et al. (2015).
IV.2.2 Numerical simulations
To study the effects of risk perception on the dynamics of a SIR spreading process in temporal networks we resort again to numerical simulations. In Fig. 4 we compare the effects of the risk perception mechanism given by Eq. (2) for AD and ADM networks. The spread starts with a fraction of infectious nodes chosen at random in the population and the activity distribution is the same as in the SIS case. In the present simulations the memory span is infinite and we compare the results obtained for two different values of the awareness strenght . We see that the effective epidemic threshold is increased for the ADM network, whereas it seems unchanged for the AD network and around a value of , an agreement with the theoretical prediction quoted in the previous section.
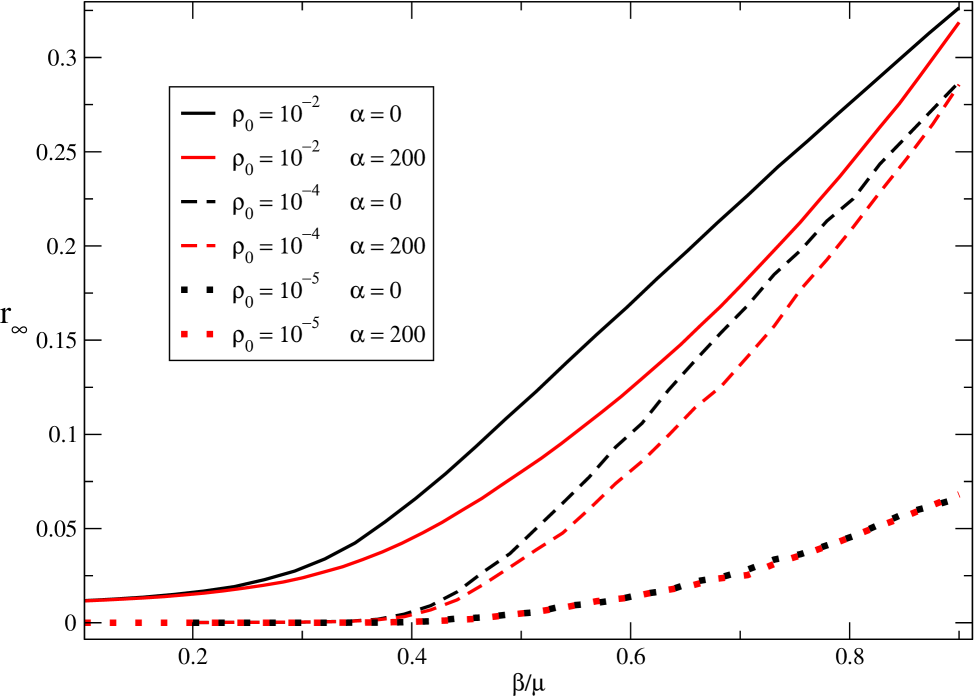
The SIR phase transition is rigorously defined for a vanishing initial density of infectious, i.e., in the limit and , as can be seen at the mean-field level in the derivation of Eq. (21). In Fig. 5 we explore the effects of the initial density of infectious individuals on the effect of awareness on AD networks. For large values of , the awareness () can significantly decrease the final epidemic size, as already observed in Fig. 4. This effect can be understood by the fact that, for large , more individuals are aware already from the start of the spread and have therefore lower probabilities to be infected. At very small initial densities, on the other hand, becomes independent of . This is at odds with the result in Eq. (21), which however was obtained within an approximation that increases the effects of awareness. The milder form considered in Eq. (2) leads instead to an approximately unaltered threshold, and to a prevalence independent of .
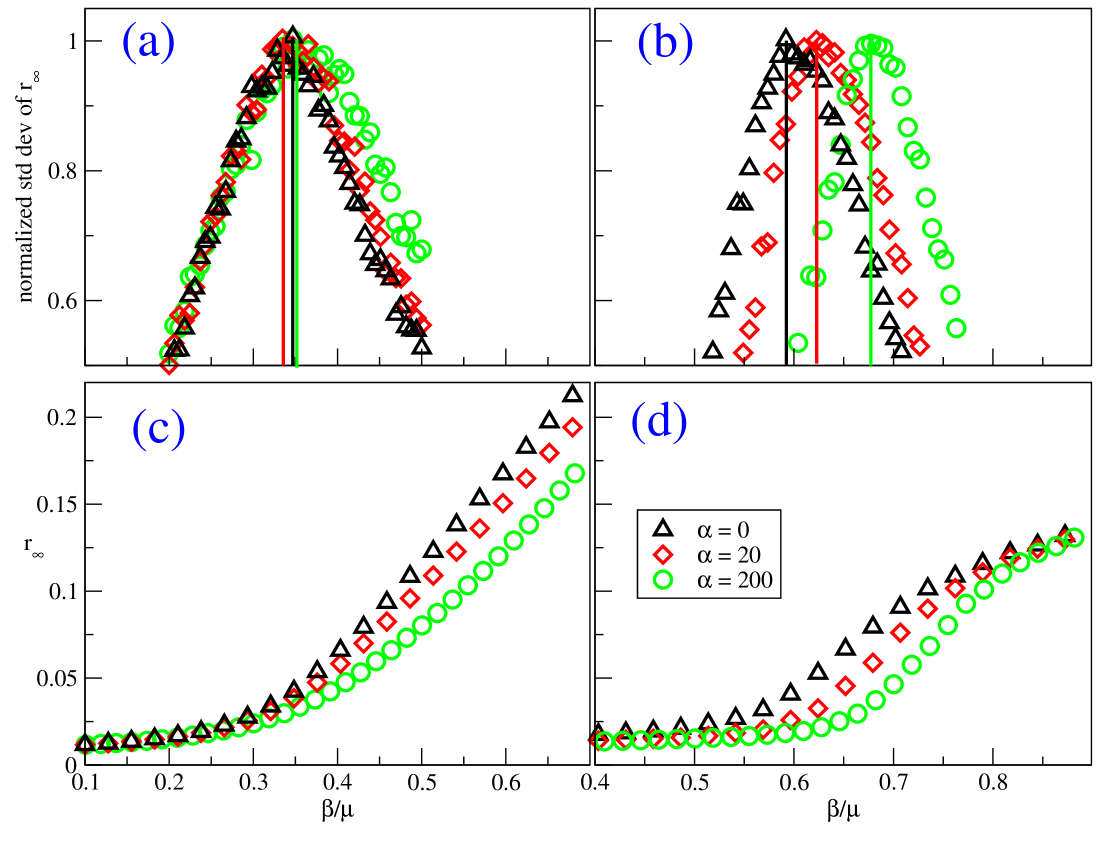
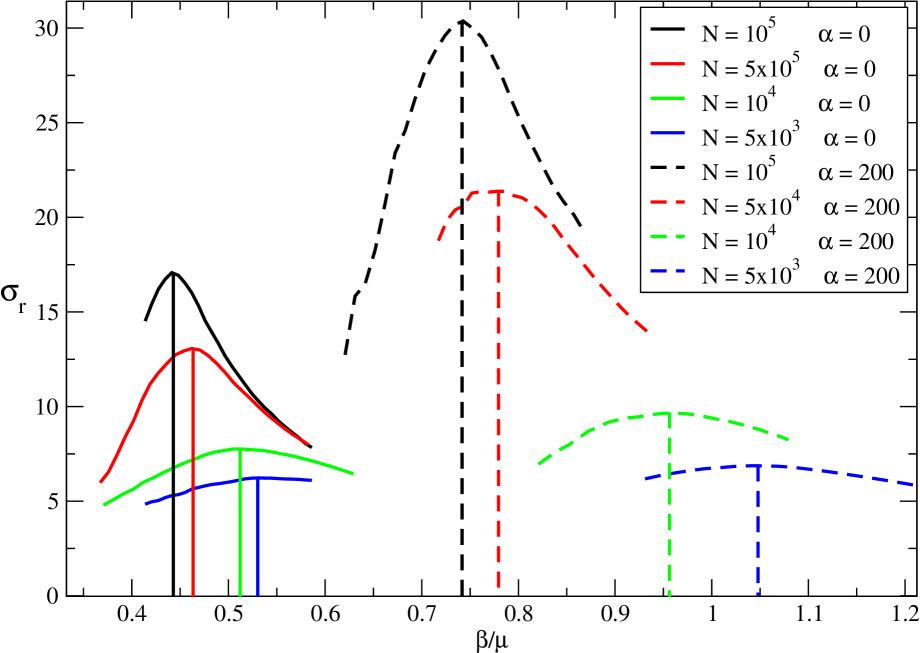
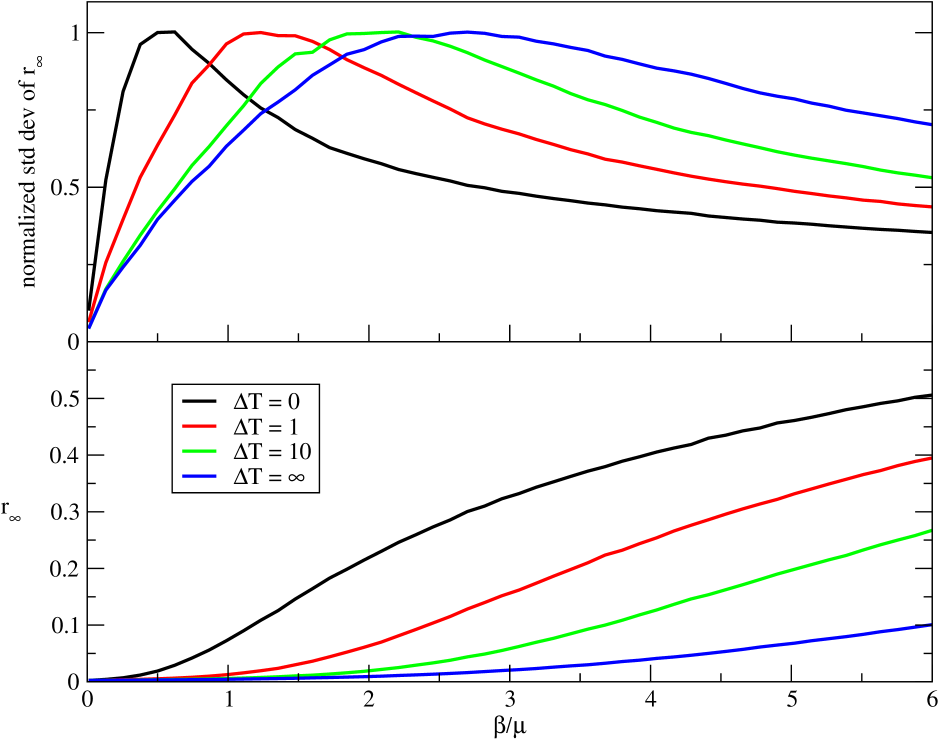
For ADM networks, Fig. 6 shows the variance of the order parameter for two different values of . As in the SIS case, we see that an apparent shift of the effective epidemic threshold is obtained, but very strong finite size effects are present even at large size, especially for . The difference between the effective thresholds at and decreases as the system size increases, but remains quite large, making it difficult to reach a clear conclusion on the infinite size limit.
V Epidemic spreading on empirical social networks
As neither AD nor ADM networks display all the complex multi-scale features of real contact networks, we now turn to numerical simulations of spreading processes with and without awareness on empirical temporal contact networks, using the datasets described in Sec. II.2.
V.1 SIS dynamics
As we saw in Sec. IV.1, the susceptibility defined to evaluate the epidemic threshold of the SIS process is subject to strong finite size effects. Since the empirical networks used in the present section are quite small, we choose to focus only on the main observable of physical interest, i.e., the average prevalence in the steady state of the epidemics.
As we are interested in the influence of the structural properties of the network, we choose to skip the nights in the datasets describing the contacts between individuals, as obviously no social activity was recorded then, to avoid undesired extinction of the epidemic during those periods. In order to run simulations of the SIS spreading, we construct from the data arbitrarily long lasting periodic networks, with the period being the recording duration (once the nights have been removed). For both networks we define the average instantaneous degree where the sum runs over all the time steps of the data, and is the average degree of the snapshot network at time . We then define as the parameter of the epidemic. For each run, a random starting time step is chosen, and a single agent in the same time step, if there is any, is defined as the seed of the infection (otherwise a new starting time is chosen).
In Fig. 7, we compare the curves of the prevalence of the epidemics in the stationary state on both empirical networks, and for increasing values of the memory length . We can see that an important reduction of the prevalence is occurring even for . This is due to the presence of many contacts of duration longer than (contrarily to the AD case): the awareness mechanism decreases the probability of contagion of all these contacts (and in particular of the contacts with very long duration, which have an important role in the propagation) as soon as , leading to a strong effect even in this case. At large values of the control parameter , the effect of the awareness is stronger for increasing values of the memory length , as was observed in Sec. IV.1. At small values of on the contrary, the awareness is optimum for a finite value of , and the knowledge of the whole contact history is not the best way to contain the epidemics. While a detailed investigation of this effect lies beyond the scope of our work, preliminary work (not shown) seem to indicate that it is linked to the use of the periodicity introduced in the data through the repetition of the dataset.
V.2 SIR
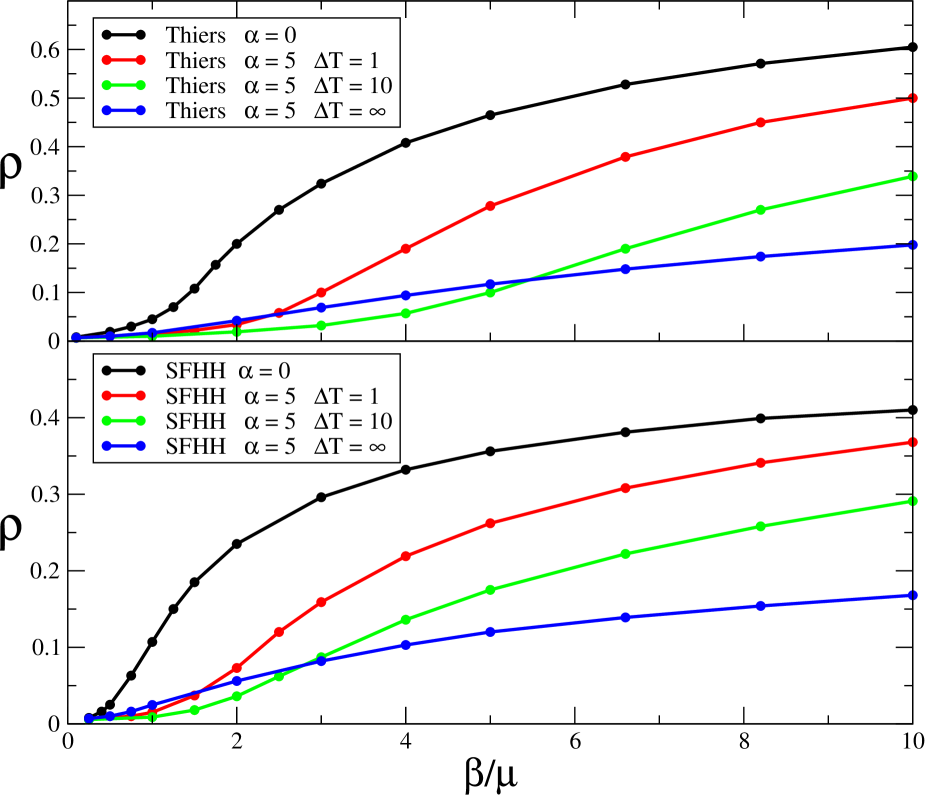
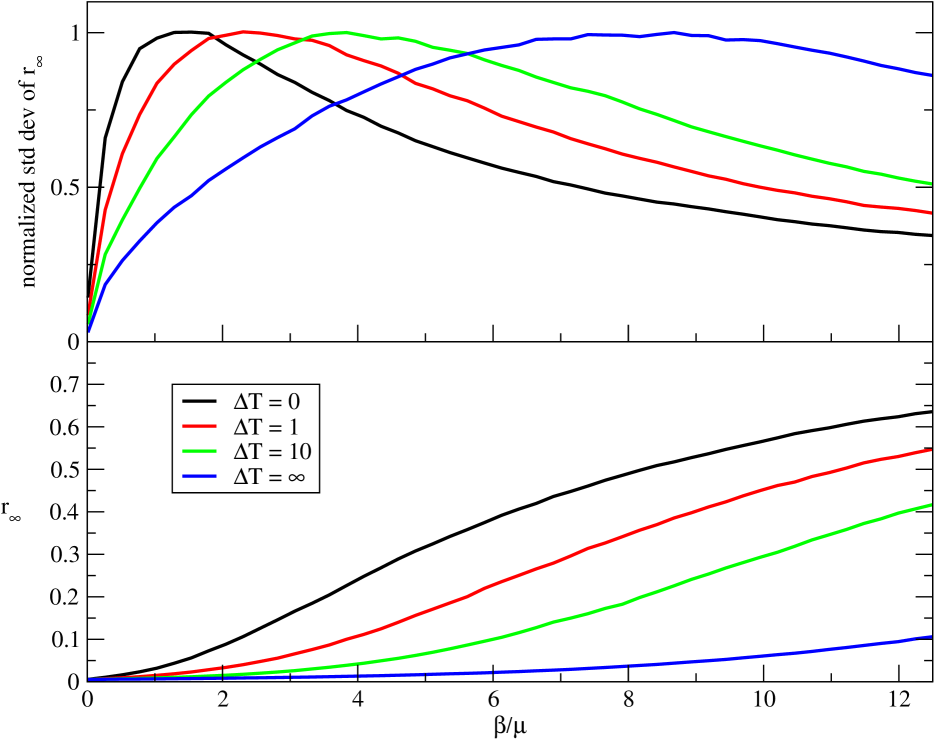
In this section we study the impact of the awareness on the SIR spreading process running on the empirical networks. In particular, we study the effect of self protection on the fraction of recovered individuals in the final state, and on the effective threshold evaluated as the peak of the relative variance of defined in Eq. (1). In Fig. 8 and 9 we plot and for different memory length , for the SFHH conference and the Thiers highschool data respectively. We first notice that a notable effect appears already for , similarly to the SIS process. However, we see that is monotonously reduced as grows and that the effective threshold is shifted to higher values of , also monotonously. It is worth noticing that the timescale of the SIR process is much smaller than the one studied in the SIS process because the final state is an absorbing state free of infectious agents. The lifetime of the epidemic in this case is of the order of magnitude of the data duration, so that the periodicity introduced by the repetition of the dataset is not relevant anymore. Overall, we observe for both networks an important reduction of outbreak size when people adopt a self protecting behaviour, as well as a significant shift of the effective epidemic threshold.
VI Conclusion
The implementation of immunization strategies to contain the propagation of epidemic outbreaks in social networks is a task of paramount importance. In this work, we have considered the effects of taking protective measures to avoid infection in the context of social temporal networks, a more faithful representation of the patterns of social contacts than often considered static structures. In this context, we have implemented a model including awareness to the propagating disease in a temporal network, extending previous approaches defined for static frameworks. In our model, susceptible individuals have a local perception of the overall disease prevalence measured as the ratio of the number of previous contacts with infectious individuals on a training window of width . An increased level of awareness induces a reduction in the probability that a susceptible individual contracts the disease via a contact with an infectious individual.
To explore the effects of disease awareness we have considered the paradigmatic SIS and SIR spreading models on both synthetic temporal networks, based in the activity driven (AD) model paradigm, and empirical face-to-face contact networks collected by the SocioPatterns collaboration. In the case of network models, we consider the original AD model, and a variation, the AD model with memory (ADM), in which a memory kernel mimics some of the non-Markovian effects observed in real social networks.
In the case of synthetic networks, analytical and numerical results hint that in AD networks without memory, the epidemic threshold on both SIS and SIR models is not changed by the presence of awareness, while the epidemic prevalence is diminished for increasing values of the parameter gauging the strength of awareness. In the case of the ADM model (temporal network with memory effects) on the other hand, awareness seems to be able to shift the threshold to an increased value, but very strong finite size effects are present: our results are compatible with an absence of change of the epidemic threshold in the infinite size limit, while, as for the AD case, the epidemic prevalence is decreased.
In the case of empirical contact networks, we observe in all cases a strong reduction of the prevalence for different values of and , and an apparent shift of the effective epidemic threshold. These empirical networks differ from the network models from two crucial points of view. On the one hand, they have a relatively small size. Given that important finite size effects are observed in the models, especially in the one with memory effects, one might also expect stronger effective shifts in such populations of limited size. On the other hand, AD and ADM networks lack numerous realistic features observed in real social systems. On AD and ADM networks, contacts are established with random nodes (even in the ADM case) so that the perception of the density of infectious by any node is quite homogeneous, at least in the hypothesis of a sufficiently large number of contacts recorded (i.e., at large enough times, for ). This is not the case for the empirical networks, which exhibits complex patterns such as community structures, as well as broad distributions of contact and inter-contact durations, specific time-scales (e.g., lunch breaks), correlated activity patterns, etc. Gauvin et al. (2014). This rich topological and temporal structure can lead to strong heterogeneities in the local perception of the disease. In this respect, it would be interesting to investigate the effect of awareness in more realistic temporal network models.
Notably, the awareness mechanism, even if only local and not assuming any global knowledge of the unfolding of the epidemics, leads to a strong decrease of the prevalence and to shifts in the effective epidemic threshold even at quite large size, in systems as diverse as simple models and empirical data. Moreover, some features of empirical contact networks, such as the broad distribution of contact durations, seem to enhance this effect even for short-term memory awareness. Overall, our results indicate that it would be important to take into account awareness effects as much as possible in data-driven simulations of epidemic spread, to study the relative role of the complex properties of contact networks on these effects, and we hope this will stimulate more research into this crucial topic.
Acknowledgements.
R.P.-S. acknowledgs financial support from the Spanish Government’s MINECO, under projects FIS2013-47282-C2- 2 and FIS2016-76830-C2-1-P, from ICREA Academia, funded by the Generalitat de Catalunya regional authorities.References
- Keeling and Rohani (2008) M. J. Keeling and P. Rohani, Modeling Infectious Diseases in Humans and Animals (Princeton University Press, Princeton, 2008).
- Anderson and May (1991) R. M. Anderson and R. M. May, Infectious diseases of humans: dynamics and control (Oxford University Press, Oxford, New York, 1991).
- Newman (2010) M. Newman, Networks: An Introduction (Oxford University Press, Inc., New York, NY, USA, 2010).
- Caldarelli (2007) G. Caldarelli, Scale-Free Networks: Complex Webs in Nature and Technology (Oxford University Press, Oxford, 2007).
- Pastor-Satorras and Vespignani (2001) R. Pastor-Satorras and A. Vespignani, Phys. Rev. Lett. 86, 3200 (2001).
- Barrat et al. (2008) A. Barrat, M. Barthelemy, and A. Vespignani, Dynamical processes on complex networks (Cambridge University Press (Cambridge), 2008).
- Pastor-Satorras et al. (2015) R. Pastor-Satorras, C. Castellano, P. V. Mieghem, and A. Vespignani, Rev. Mod. Phys. 87, 925 (2015).
- Holme and Saramäki (2012) P. Holme and J. Saramäki, Physics Reports 519, 97 (2012).
- Karsai et al. (2011) M. Karsai, M. Kivelä, R. K. Pan, K. Kaski, J. Kertész, A.-L. Barabási, and J. Saramäki, Phys. Rev. E 83, 025102 (2011).
- Stehlé et al. (2011) J. Stehlé, N. Voirin, A. Barrat, C. Cattuto, V. Colizza, L. Isella, C. Régis, J.-F. Pinton, N. Khanafer, W. Van den Broeck, and P. Vanhems, BMC Medicine 9, 87 (2011).
- Machens et al. (2013) A. Machens, F. Gesualdo, C. Rizzo, A. Tozzi, A. Barrat, and C. Cattuto, BMC Infectious Diseases 13, 185 (2013).
- Valdano et al. (2015) E. Valdano, L. Ferreri, C. Poletto, and V. Colizza, Phys. Rev. X 5, 021005 (2015).
- Holme (2015) P. Holme, The European Physical Journal B 88, 234 (2015).
- Cattuto et al. (2010) C. Cattuto, W. Van den Broeck, A. Barrat, V. Colizza, J.-F. Pinton, and A. Vespignani, PLoS ONE 5, e11596 (2010).
- Barrat et al. (2014) A. Barrat, C. Cattuto, A. E. Tozzi, P. Vanhems, and N. Voirin, Clinical Microbiology and Infection 20, 10 (2014).
- Barabàsi (2005) A.-L. Barabàsi, Nature 435, 207 (2005).
- Pastor-Satorras and Vespignani (2002) R. Pastor-Satorras and A. Vespignani, Phys. Rev. E 65, 036104 (2002).
- Cohen et al. (2003) R. Cohen, S. Havlin, and D. ben Avraham, Phys. Rev. Lett. 91, 247901 (2003).
- Funk et al. (2010) S. Funk, M. Salathé, and V. Jansen, J R Soc Interface 7, 1247 (2010).
- Gross and Blasius (2008) T. Gross and B. Blasius, Journal of The Royal Society Interface 5, 259 (2008).
- Perra et al. (2011) N. Perra, D. Balcan, B. Gonçalves, and A. Vespignani, PLoS ONE 6, e23084 (2011).
- Granell et al. (2013) C. Granell, S. Gómez, and A. Arenas, Physical Review Letters 111, 128701 (2013).
- Massaro and Bagnoli (2014) E. Massaro and F. Bagnoli, Phys. Rev. E 90, 052817 (2014).
- Bagnoli et al. (2007) F. Bagnoli, P. Lio, and L. Sguanci, Phys Rev E 76, 061904 (2007).
- Kotnis and Kuri (2013) B. Kotnis and J. Kuri, Phys. Rev. E 87, 062810 (2013).
- Rizzo et al. (2014) A. Rizzo, M. Frasca, and M. Porfiri, Phys. Rev. E 90, 042801 (2014).
- Cao, Lang (2014) Cao, Lang, Eur. Phys. J. B 87, 225 (2014).
- Perra et al. (2012) N. Perra, B. Gonçalves, R. Pastor-Satorras, and A. Vespignani, Scientific reports 2, 469 (2012).
- Starnini and Pastor-Satorras (2013) M. Starnini and R. Pastor-Satorras, Phys. Rev. E 87, 062807 (2013).
- Karsai et al. (2014) M. Karsai, N. Perra, and A. Vespignani, Sci Rep 4, 4001 (2014).
- (31) “Sociopatterns collaboration,” www.sociopatterns.org, accessed 13 Feb 2017.
- (32) “Sociopatterns dataset: High school dynamic contact networks,” www.sociopatterns.org/datasets/high-school-dynamic-contact-networks, accessed 13 Feb 2017.
- Fournet and Barrat (2014) J. Fournet and A. Barrat, PLOS ONE 9, 1 (2014).
- Boguñá et al. (2013) M. Boguñá, C. Castellano, and R. Pastor-Satorras, Phys. Rev. Lett. 111, 068701 (2013).
- Mata et al. (2015) A. S. Mata, M. Boguñá, C. Castellano, and R. Pastor-Satorras, Phys. Rev. E 91, 052117 (2015).
- Castellano and Pastor-Satorras (2016) C. Castellano and R. Pastor-Satorras, Eur. Phys. J. B 89, 243 (2016).
- Sun et al. (2015) K. Sun, A. Baronchelli, and N. Perra, Eur. Phys. J. B 88, 326 (2015).
- Cardy (1988) J. L. Cardy, ed., Finite Size Scaling, Current Physics-Sources and Comments, Vol. 2 (North Holland, Amsterdam, 1988).
- Liu et al. (2014) S. Liu, N. Perra, M. Karsai, and A. Vespignani, Physical Review Letters 112, 118702 (2014).
- Starnini and Pastor-Satorras (2014) M. Starnini and R. Pastor-Satorras, Physical Review E 89, 032807 (2014).
- Gauvin et al. (2014) L. Gauvin, A. Panisson, and C. Cattuto, PLoS ONE 9 (2014).