Electronic bulk and domain wall properties in B-site doped hexagonal ErMnO3
Abstract
Acceptor and donor doping is a standard for tailoring semiconductors. More recently, doping was adapted to optimize the behavior at ferroelectric domain walls. In contrast to more than a century of research on semiconductors, the impact of chemical substitutions on the local electronic response at domain walls is largely unexplored. Here, the hexagonal manganite ErMnO3 is donor doped with Ti4+. Density functional theory calculations show that Ti4+ goes to the B-site, replacing Mn3+. Scanning probe microscopy measurements confirm the robustness of the ferroelectric domain template. The electronic transport at both macro- and nanoscopic length scales is characterized. The measurements demonstrate the intrinsic nature of emergent domain wall currents and point towards Poole-Frenkel conductance as the dominant transport mechanism. Aside from the new insight into the electronic properties of hexagonal manganites, B-site doping adds an additional degree of freedom for tuning the domain wall functionality.
pacs:
Valid PACS appear hereI Introduction
Electronic correlation that is confined to two dimensions, found in so-called ‘2D systems’, has a large technological potential Hwang et al. (2012). This is in part due to the electronic anisotropy, but also due to the unusual physics that has been found in these systems. Local electronic correlations are now intensively studied in a wide range of 2D materials, such as single-layer graphene Geim and Novoselov (2007), MoS2 Desai (2016), surface states in topological insulators Zhang et al. (2012), and oxide interfaces Hwang et al. (2012). A specific type of oxide interface — that is naturally occurring — are domain walls (DWs) Salje (2010). DWs show diverse confinement enabled functional properties, which are distinct from the bulk matrix: it has already been established that DWs can be magnetic Geng et al. (2012), multiferroic Leo et al. (2015), (super-) Aird and Salje (1998) conductive Seidel (2009); Schröder et al. (2012); Meier et al. (2012); Wu et al. (2012); Sluka et al. (2013); Guyonnet et al. (2011); Maksymovych et al. (2012); Farokhipoor and Noheda (2011); McQuaid et al. (2017); Campbell et al. (2016), and have local strain gradients (for twin walls) Carpenter (2015). These functional properties are readily influenced by electrostatics, strain, and chemical doping Gopalan et al. (2007); Catalan et al. (2012); Meier (2015). Indeed, it is the ability to control the DW behavior, combined with their sub nanometer-size Jia et al. (2008) and the ease with which they can be created and removed Whyte et al. (2014), that has driven research interest.
Since the first direct observation of conducting DWs in BiFeO3 Seidel (2009), significant progress has been made on the fundamental science behind DWs. It has been established that their local properties are largely dominated by the interplay of local polarization states Eliseev et al. (2011); Gureev et al. (2011) and available charge carriers Hassanpour et al. (2016); Schaab et al. (2016). Despite this progress, the research trying to produce a functional device is still in an early stage Whyte and Gregg (2015); Sharma et al. (2017); Mundy (2017): one of the key challenges is the optimization of emergent electronic DW behavior beyond the as-grown properties Meier (2015). Several methods of tuning the DWs have been demonstrated: FIB induced defects to control formation position Whyte et al. (2014); McGilly et al. (2017), oxygen doping to induce ionic defects which have a propensity to form at the walls Farokhipoor and Noheda (2011); Gaponenko et al. (2015), and chemical doping Hassanpour et al. (2016); Schaab et al. (2016). While chemical doping with both donor and acceptor atoms is standard practice in silicon technologies, its influence on ferroelectric DWs remains largely unexplored.
An interesting model system for such doping-dependent studies is the hexagonal manganites, MnO3 ( = Sc, Y, In, Dy to Lu). Their bulk properties are well-characterized in experiment Fiebig et al. (2002); Lorenz (2013); Meier et al. (2013) and theory Aken et al. (2004); Fennie and Rabe (2005) and the system naturally provides stable charged head-to-head () and tail-to-tail () DWs in the as-grown state, making it an excellent model template material Meier et al. (2012); Salje (2016). Furthermore, the system has enough chemical flexibility to allow doping, as reflected by previous investigations on the bulk level - reporting chemical substitution on the A-site Moure et al. (1999a); Aken et al. (2001) and B-site Ismailzade et al. (1971); Asaka et al. (2005); Levin et al. (2017), as well as oxygen off-stoichiometry McCarthy et al. (1973); Remsen and Dabrowski (2011); Selbach et al. (2012); Skjærvø et al. (2016). Recently, the effect of doping has been extended to the micro- and nanoscopic length scales: specifically, aliovalent substitution of A-site cations was scrutinized as a control parameter for adjusting the electronic DW behavior Schaab et al. (2016); Hassanpour et al. (2016); Salje (2016). So far, the only spatially resolved work on B-site doping addressed high-concentration substitution in Y(Mn1-x,Tix)O3, reporting the loss of the MnO3-type Jungk et al. (2010) ferroelectric domain pattern for 17.5 % Mori et al. (2005). Thus, it remains an open question whether B-site doping can be used for DW engineering.
In this work, electronic DW conductance in Ti-doped erbium manganite, Er(Mn1-x,Tix)O3 ( = 0.002), is reported. By replacing Mn3+ for Ti4+ the bulk conductivity is reduced by an order of magnitude. The DW transport is characterized using I(V)-spectroscopy and time-dependent measurements, confirming the intrinsic nature of the DW currents. Temperature-dependent I(V) measurements support Poole-Frenkel conduction as the predominant conduction mechanism. This work expands the chemical parameter space for DW property engineering in MnO3 by establishing Ti4+ as a B-site donor dopant.
II Experimental details
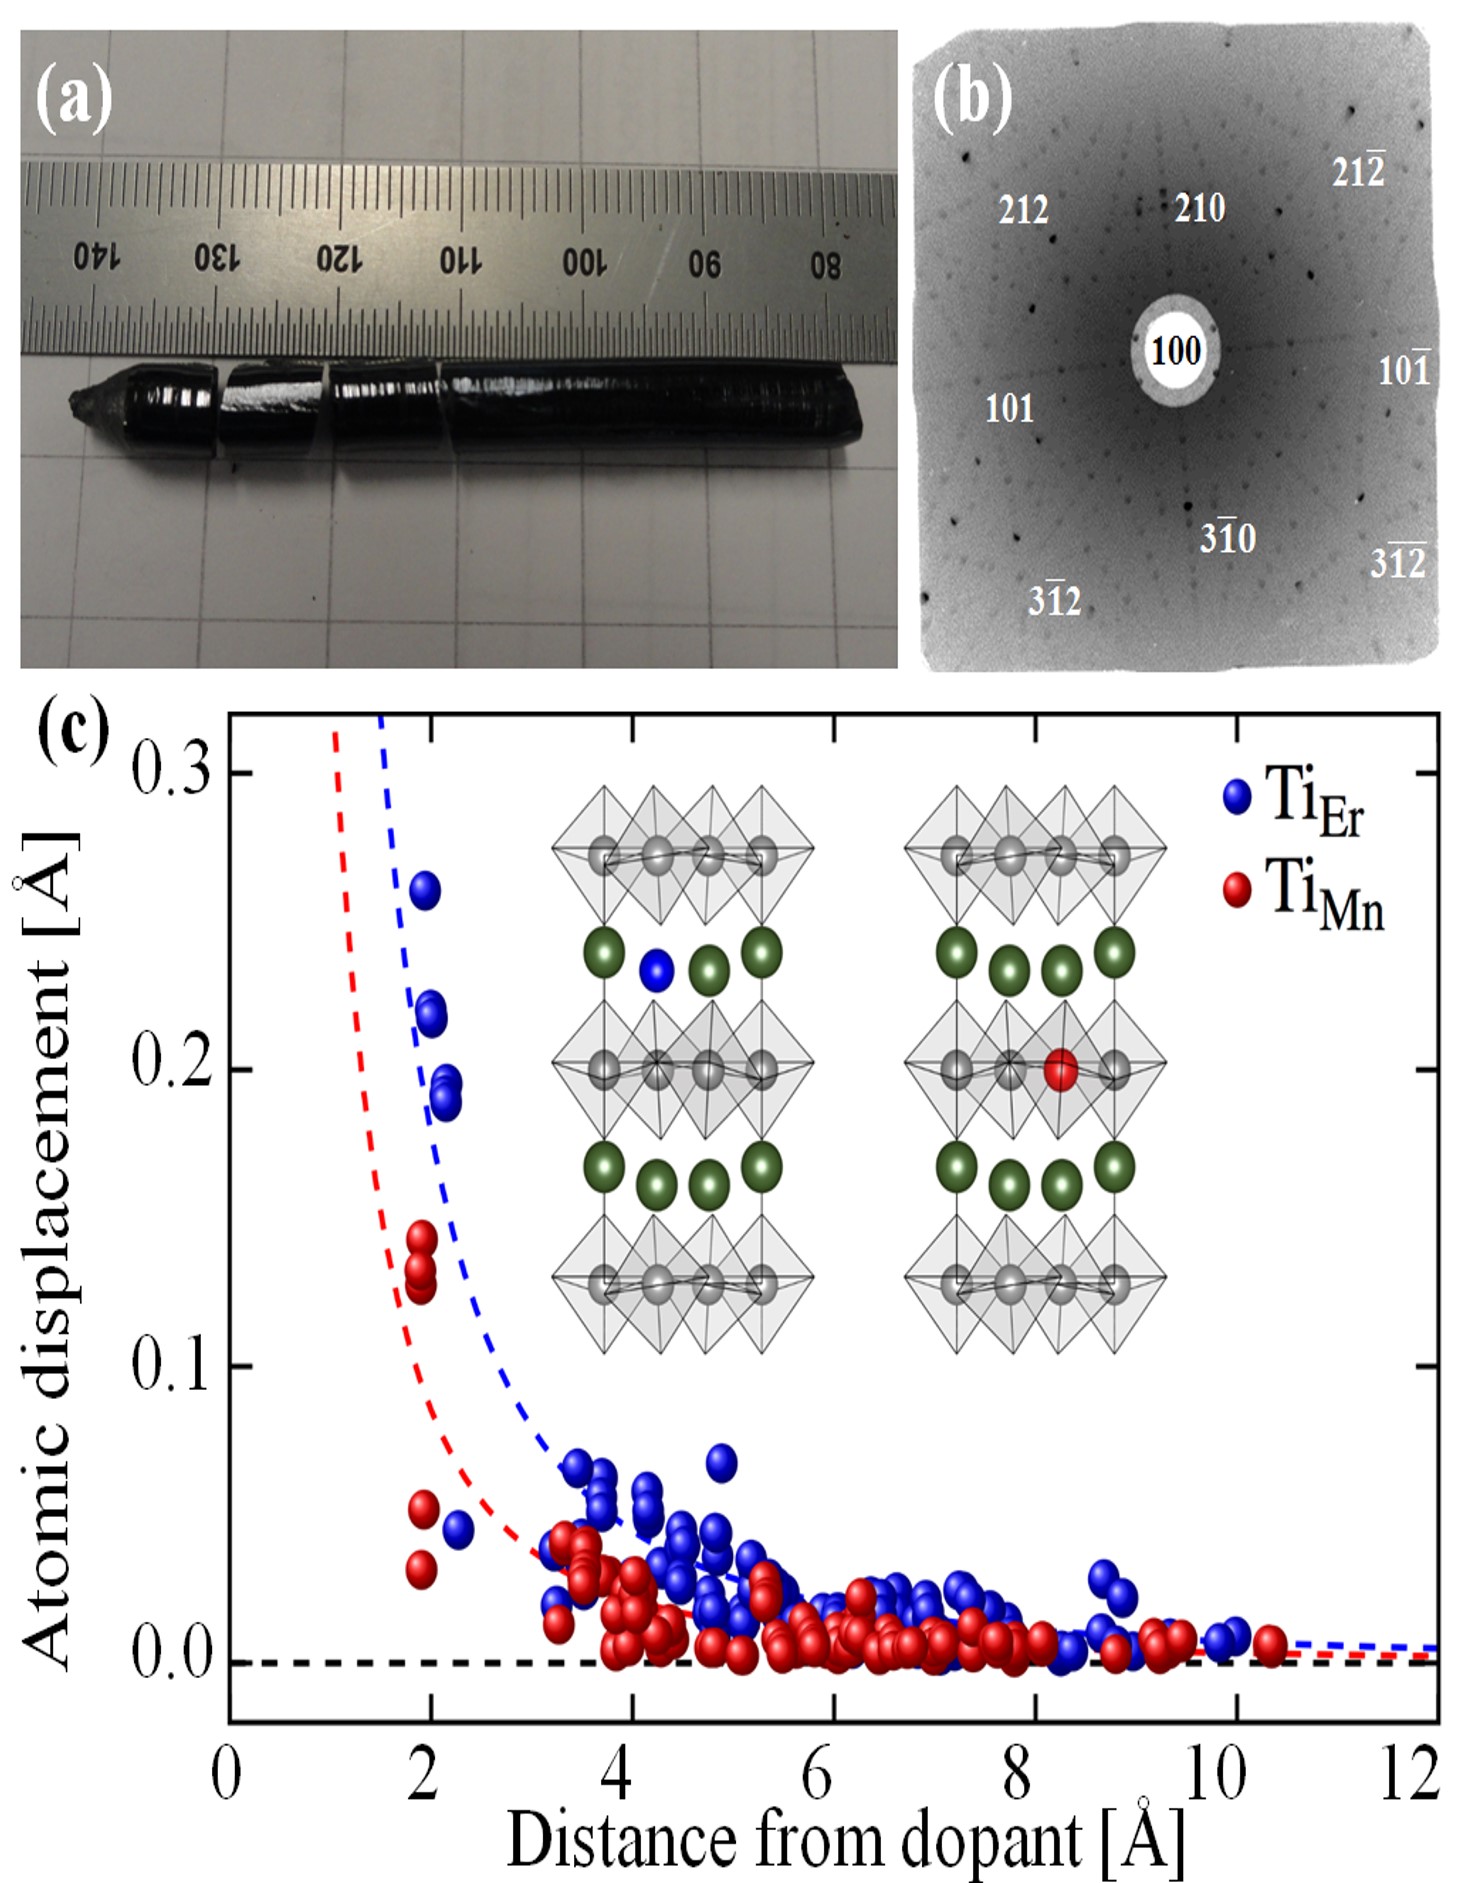
The p-type Rao et al. (1971); Skjærvø et al. (2016) semiconductor ErMnO3 is used as the parent material in this work. It has a hexagonal crystal structure and displays improper ferroelectricity at room-temperature (T 1150 oC) Aken et al. (2004); Chae et al. (2012). The spontaneous polarization in MnO3 is P 5.5 C/cm2 , pointing along the c-axis Smolenskii and Bokov (1964); Aken et al. (2004). High-quality single-phase crystals of the compound, hexagonal Er(Mn1-x,Tix)O3 ( = 0.002), are grown by the pressurized floating-zone method Yan et al. (2015) (see Fig. 1 (a)). After confirming the anticipated hexagonal target phase (not shown), the Er(Mn1-x,Tix)O3 crystal is oriented by Laue diffraction and cut into disc-shaped platelets with a thickness of 1 mm and an in-plane polarization. Representative Laue back reflection data is shown in Fig. 1 (b), confirming the single-crystallinity of the sample. After preparing oriented samples with in-plane polarization, chemo-mechanical polishing with silica slurry is applied, which yields flat surfaces with a root mean square roughness of about 0.5-1.5 nm and improves the quality of the subsequent analysis by scanning probe microscopy (SPM).
The SPM measurements are performed with a NT-MDT Ntegera Prima SPM. Piezo-response force microscopy (PFM) data are collected at room temperature using Stanford Research 830R lock-in amplifiers and applying an AC voltage to the tip ( = 40 kHz, = 5 V). Conducting atomic force microscopy (cAFM) and local IV-spectroscopy measurements are performed by applying a positive bias to the sample while grounding the tip. PFM, cAFM and IV-spectroscopy measurements were performed using a masch NSC35:HQ hard diamond-like carbon coated tip. Electrostatic force microscopy (EFM) images are collected at room temperature using Stanford Research 830R lock-in amplifiers and a NT-MDT DCP20 tip with nitrogen doped diamond coating. The EFM data is recorded at a frequency , while scanning the sample in non-contact mode with an AC voltage applied to the tip ( = 18.7 kHz, = 20 V) and the sample grounded. The dielectric properties at frequencies from 1 Hz 1 MHz are determined using a frequency-response analyzer (Novocontrol AlphaAnalyzer). For these dielectric analyses, contacts of silver paste and wires in a pseudo-four-point configuration are applied to opposite faces of the plate-like samples. The measurements are performed between 50 K and 300 K in a closed-cycle refrigerator with the samples in vacuum.
III Density Functional Theory Calculations
While the structural characterization confirms the anticipated hexagonal target phase of the moderately doped Er(Mn1-x,Tix)O3 sample (Fig. 1 (a)), it cannot decide whether Ti4+ occupies the Mn- or Er-sublattice. Density functional theory (DFT) calculations are therefore performed to investigate which cation sublattice is preferred for Ti4+. The DFT calculations are performed with the projector augmented wave method (PAW) Blöchl (1994), as implemented in VASP Kresse and Furthmüller (1996); Kresse and Joubert (1999), using the PBEsol exchange correlation functional Perdew et al. (2008) to study the local structural changes and energetics upon Ti-doping of ErMnO3 in both cation sublattices. Er 5p, 4f, 5d and 6s (with 11 f-electrons frozen in the core), Mn 3p, 4s and 3d, O 2s and 2p, and Ti 3s, 3p, 3d and 4s are treated as valence electrons. 2x2x1 supercells with one Ti ion per supercell, (Er1-x,Tix)MnO3 or Er(Mn1-x,Tix)O3 (), are chosen as the model systems. Plane wave energy cutoff is set to 550 eV, and the Brillouin zone is sampled with a -centered 2x2x2 k-point grid. GGA+U Dudarev et al. (1998) with U of 5 eV applied to Mn 3d is used to reproduce the experimental band gap. The Mn sublattice is initialized with collinear frustrated antiferromagnetic (f-FAFM) order Medvedeva et al. (2000). The lattice positions are relaxed until forces on all atoms are below 0.005 eV/Å. The defect formation energy is calculated by , where and E are the energies of the defect cell and stoichiometric ErMnO3, respectively (ni is number of species added per supercell, and the chemical potential of species ). The chemical potentials of Er, Mn, and Ti are defined by the chemical equilibria between the binary oxides Er2O3, Mn2O3 and TiO4 through Er2O 2Er+3O, Mn2O 2Mn+3O and TiO Ti+2O. Whence, E becomes a function of the oxygen chemical potential, i.e., the oxygen partial pressure during synthesis.
Intuitively, it is likely that Ti4+ replaces Mn3+ due to the similar atomic radii ( 0.945 Å, 0.58 Å, and 0.51 Å according to Shannon Shannon (1976)). The structural distortion profiles upon doping is plotted as a function of distance from the dopant in Fig. 1 (c). As a guide for the eye, the profiles are fitted to , marked in dashed lines. The calculations show that local displacements close to the dopant are smaller for B-site substitution compared to A-site substitution, as expected from the cation size mismatches. Even though the differences are quite subtle, on the order of 0.1 Å closest to the dopant, the decreased structural distortions by B-site substitution demonstrate a site preference of Ti4+ for the B-site. This is further confirmed by the calculated defect formation energies, where the defect formation energy of B-site substitution is 0.79 eV lower than that of A-site substitution. It is to be noted that the calculated defect formation energies strongly depend on the definition of the cation chemical potentials. However, with the binary oxides Er2O3 and Mn2O3 constituting ErMnO3, and TiO2 as choice of definition, it still gives a good qualitative trend for the B-site preference with respect to defect formation energetics.
IV Dielectric spectroscopy
After corroborating the replacement of Mn3+ by Ti4+, the impact of B-site doping on the bulk electronic properties is investigated. In order to gain quantitative information, dielectric spectroscopy measurements are performed on ErMnO3 and Er(Mn1-x,Tix)O3; Fig. 3 blue and black data points, respectively. The dielectric constant for both samples shows a stepwise decrease (from ca. 104-103 at 1 Hz, to about 10-20 at 100 kHz, respectively) and associated peaks in tan() (see inset in Fig. 3). This behavior is typical of a relaxation process. The relaxation is likely from an electrical heterogeneous phase, often termed Maxwell-Wagner relaxation, and possible mechanisms include: surface barrier layers formed by Schottky diodes Krohns et al. (2008) or internal barrier layers Lunkenheimer et al. (2010), e.g. DWs. The tan() for the relaxation process is 3 for the undoped crystal and 1 for Ti-doped, both typical values for Maxwell-Wagner relaxations where tan() 1 is to be expected.
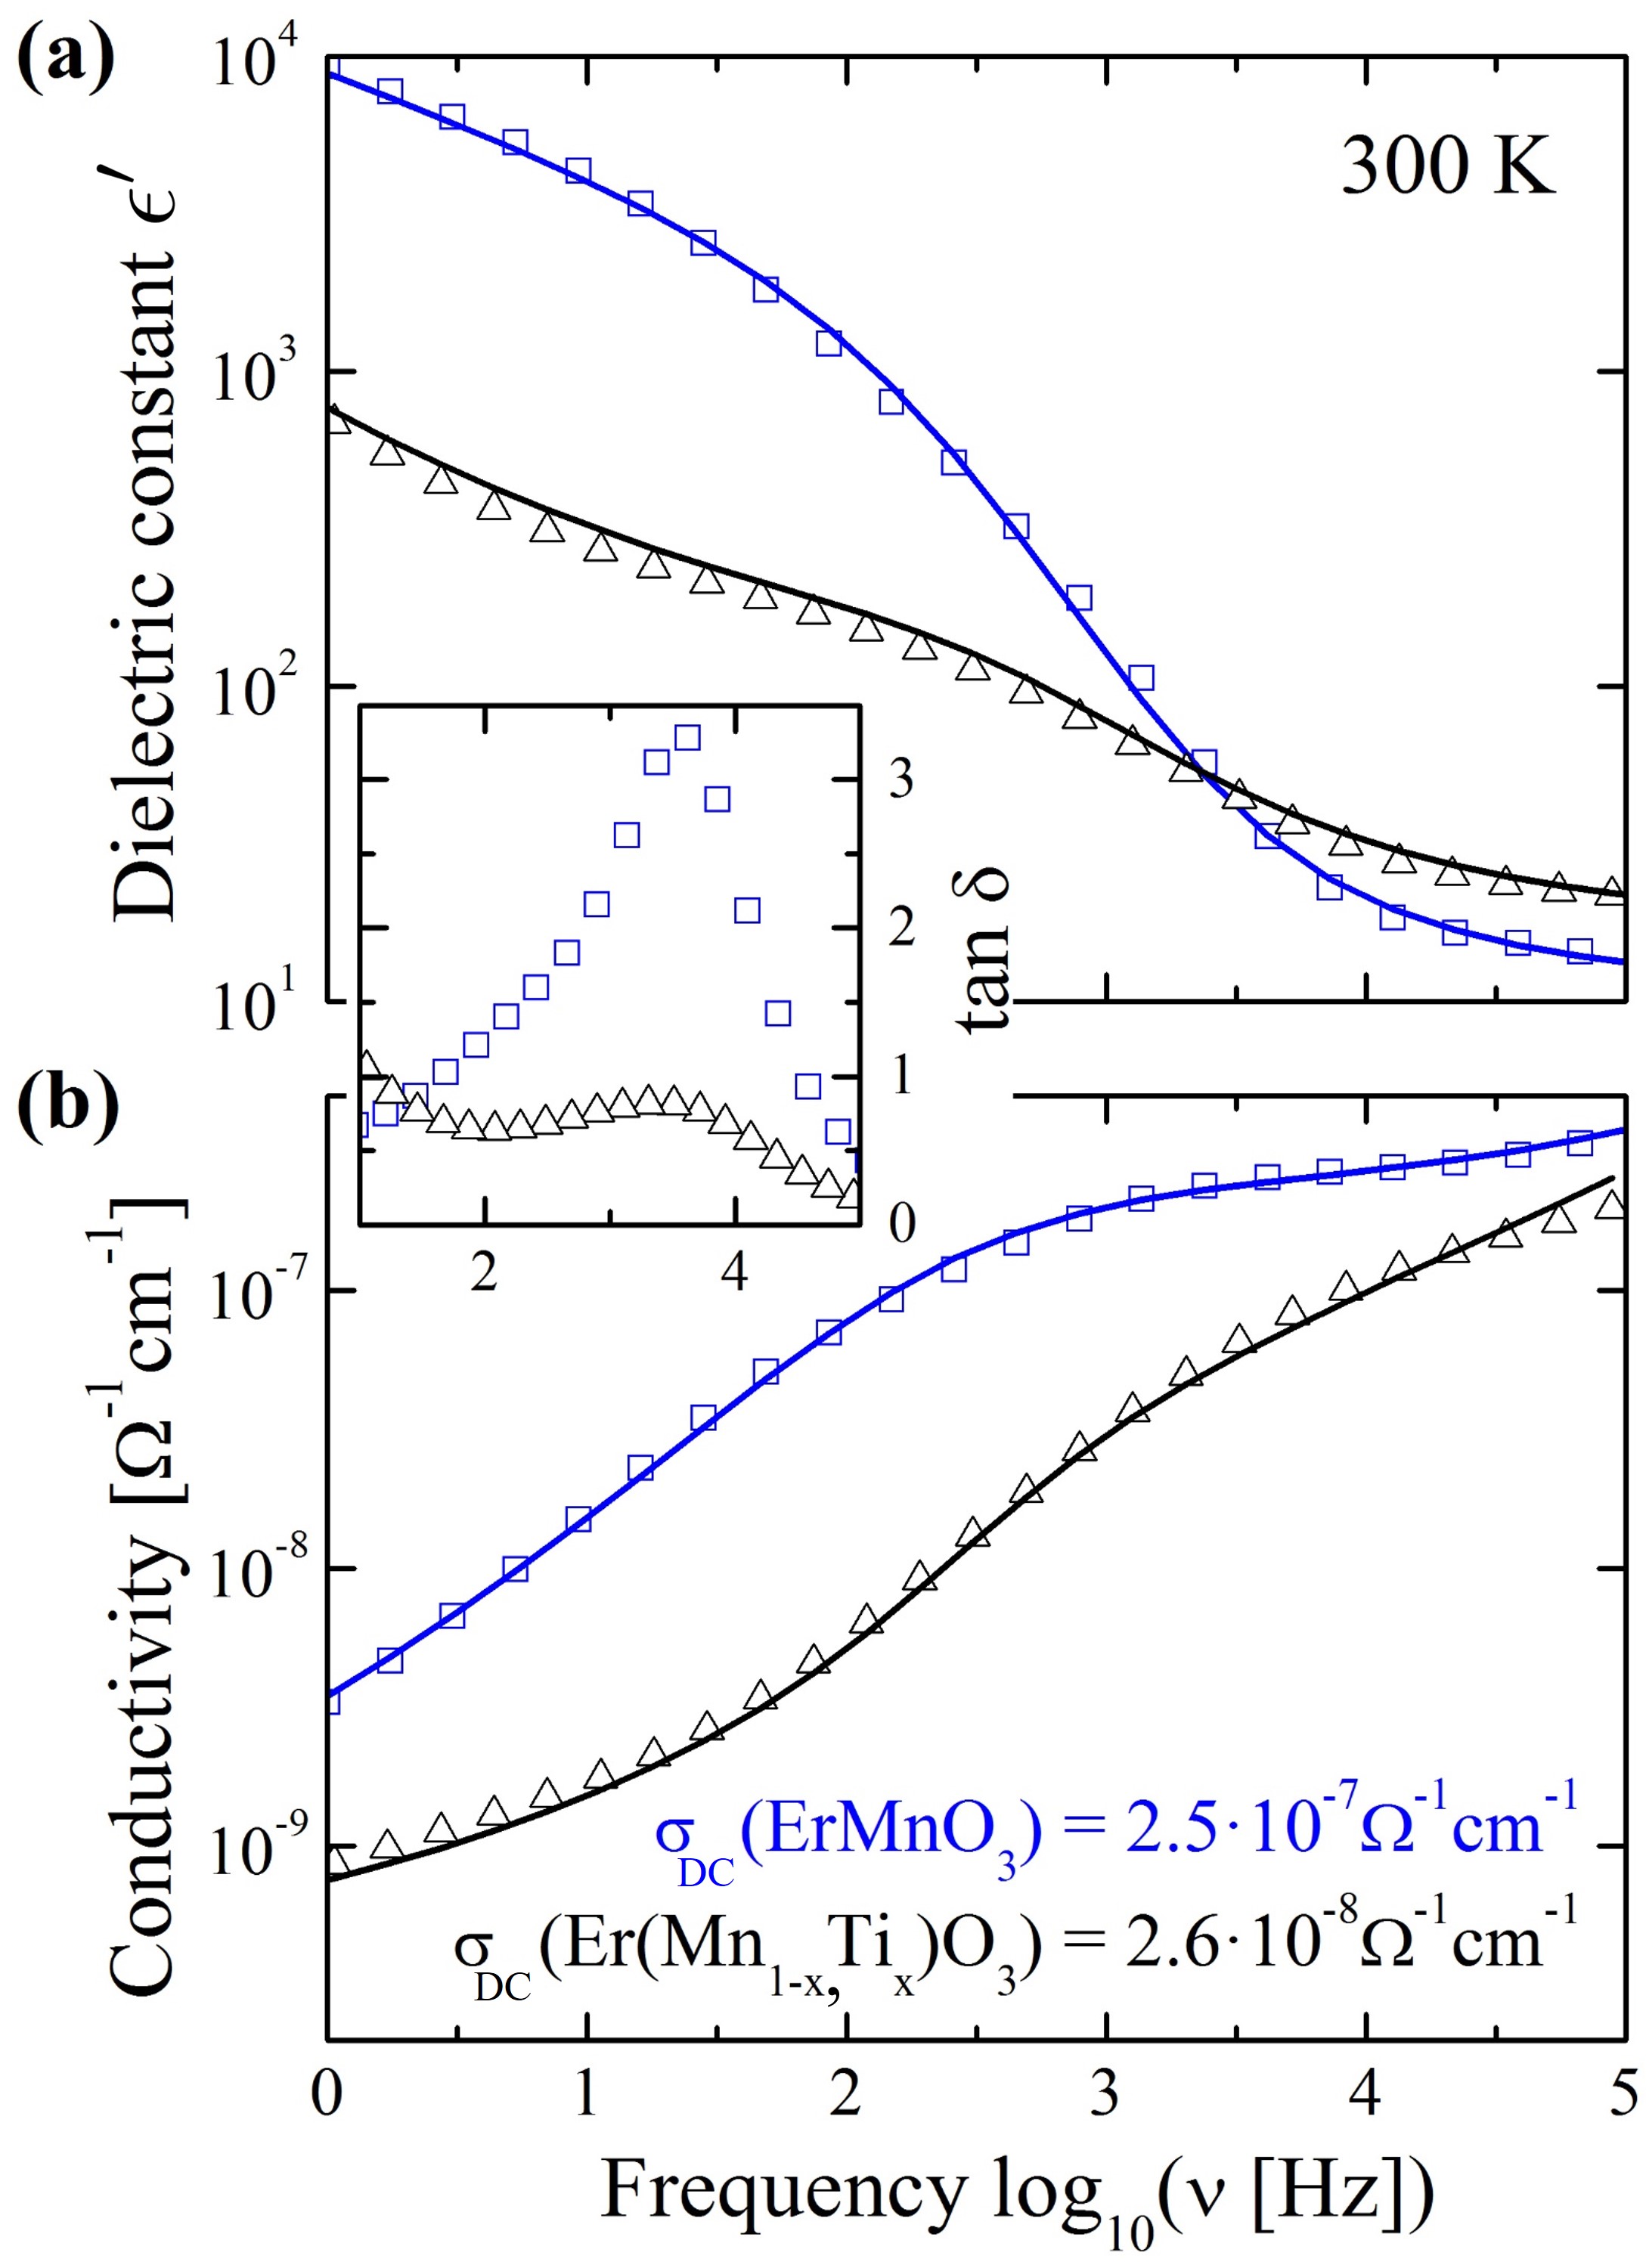

The data is fitted with a simple equivalent circuit model (consisting of two RC-elements in series: one for the bulk; and one for a layer capacitance) for the undoped sample; the fit is given by the blue solid line in Fig. 3 (a). The Ti-doped sample needs an additional RC-element because of a low frequency (1 Hz) relaxation, given by the black solid line. The origin of this additional relaxation, which is the subject of further work, is likely associated with DW mobility, or the Ti dopant. These fits give intrinsic dielectric constant values of 11 for ErMnO3 and of 22 for Er(Mn1-x,Tix)O3, which are comparable to the values for YMnO3 Smolenskii and Bokov (1964); Adem et al. (2015).
The frequency dependent conductivity, , of both samples, Fig. 3 (b), is used to evaluate doping dependent changes in the DC conductivity. The DC conductivity is given by a plateau in the frequency dependent conductivity when the RC-elements of the interface layer are short-circuited by the frequency of the applied electric field. Increases of at higher frequencies can arise from hopping charge transport. This is modeled in the equivalent circuit with an additional frequency dependent resistive element in parallel to the RC-circuit for the bulk, i.e. , with , and corresponds to Jonscher’s universal dielectric response Jonscher (1977). These fits give intrinsic DC conductivity values of cm-1 and cm-1, for the undoped and doped samples, respectively. The observed behavior is consistent with decreasing conductivity in p-type h-MnO3 with electron doping.
After establishing the differences in conductivity between the parent material and the doped crystals, and measuring values for the dielectric constant, the low temperature frequency dependency of the conductivity of the Ti-doped sample is presented in Fig. 3. The conductivity decreases from 300 K before flattening out at ca. 150 K.
Furthermore, it is strongly frequency dependent at 100 K, varying by about 6 orders of magnitude across a frequency range of 0.1 Hz - 89 kHz. The red symbols indicate the intrinsic bulk DC conductivity revealed from fits with an equivalent circuit Lunkenheimer et al. (2010), and the temperature dependency is approximated by the dashed red line.
The observed behavior is further evidence for a temperature dependent activation mechanism Ruff et al. (2017); Moure et al. (1999b). The gradient of the DC conductivity is used to calculate an activation energy for the conduction process of EA = 0.42 eV, which is in excellent agreement with values in the literature for YMnO3 of order 0.36 eV. These macroscopic measurements show that the addition of relatively small amounts of Ti4+ to ErMnO3 can have profound effects on the bulk conductivity. Next, the effects of Ti on the local conductivity properties of the bulk and DWs are investigated.
V Scanning Probe Microscopy
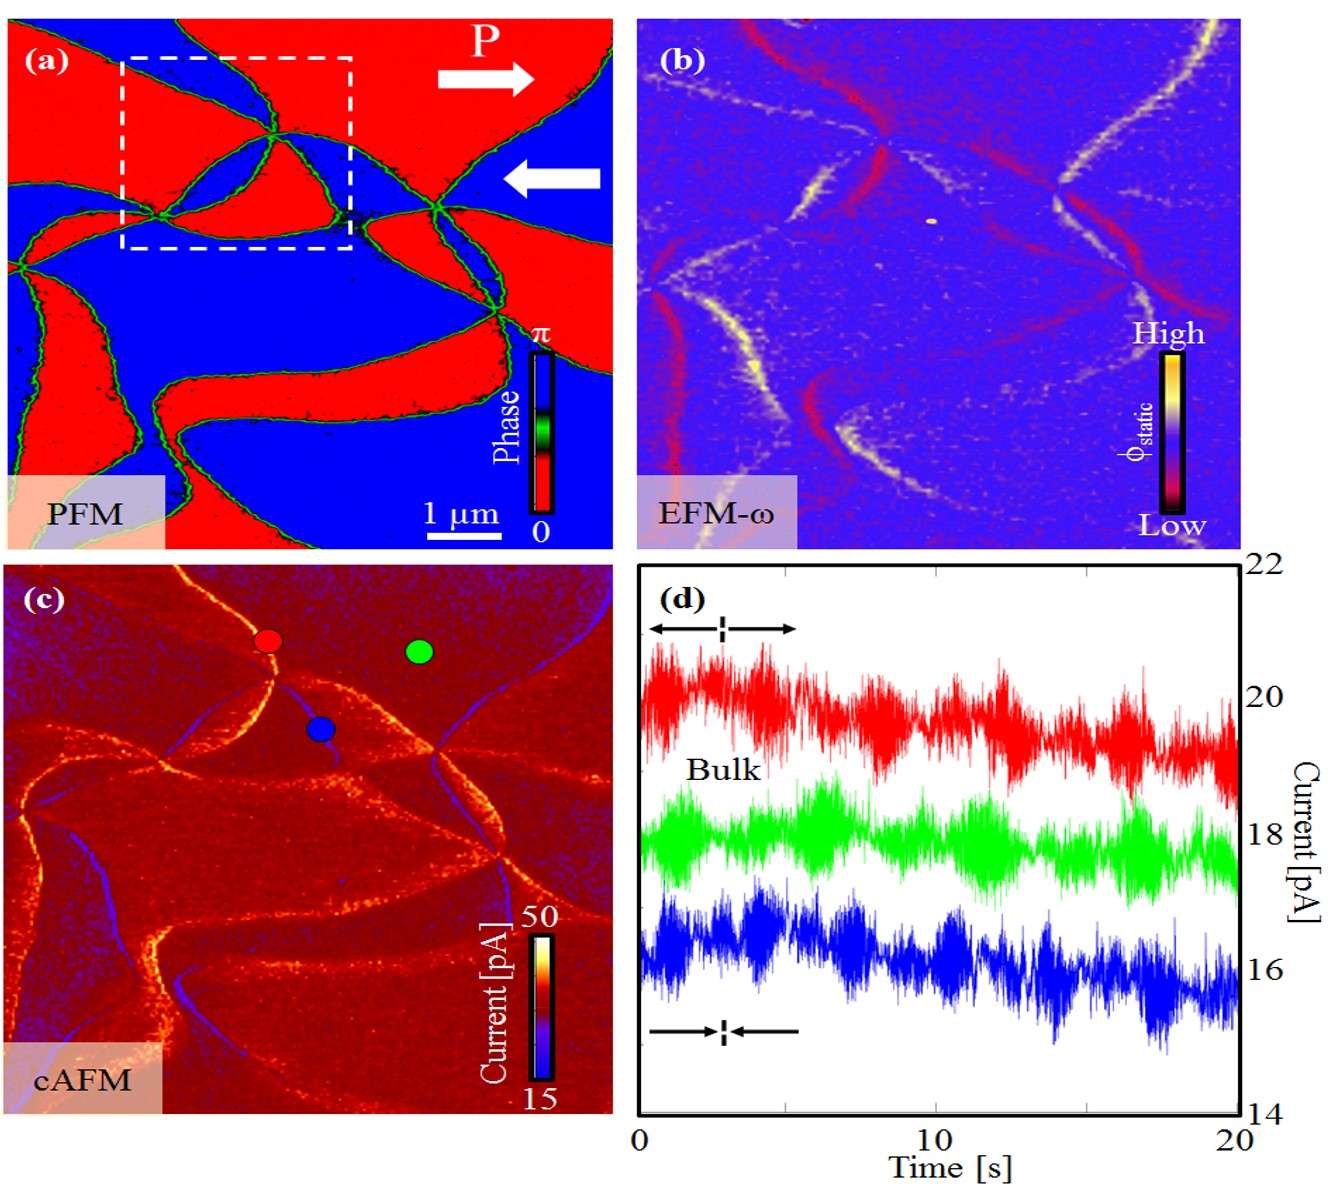
The domain and DW structures in Er(Mn1-x,Tix)O3 are investigated using SPM. Previous investigations on Y(Mn1-x,Tix)O3 ( 0.05 to 0.4) revealed that the domain structure strongly depends on the Ti-content, and B-site doping Mori et al. (2005) was found to completely destroy the MnO3-characteristic ferroelectric domain structure for . Fig. 4 (a) shows a representative PFM image of Er(Mn1-x,Tix)O3 (). The in-plane contrast with red and blue areas corresponds to ferroelectric domains of opposite polarization direction with P pointing to the right and left, respectively. It is clear that the parent compound and the Ti-doped sample exhibit qualitatively equivalent domain patterns. The electrostatics at the DWs in Er(Mn1-x,Tix)O3 are analyzed in Fig. 4 (b), showing an EFM scan obtained at the same position as the PFM image in Fig. 4 (a). The EFM- map in Fig. 4 (b) reveals the distribution of bound carriers as explained in Refs. Schaab et al. (2016); Johann et al. (2010). A reduction (red) of the electrostatic potential at the tail-to-tail DWs and an enhancement (yellow) at head-to-head DWs is observed. That is: . Figures 4 (a-c) thus demonstrates that the distribution and electrostatics of the DWs are unaffected by the applied B-site doping, proving its usability for electronic adjustments.
The effect of the Ti-doping on the conduction properties of the DWs is shown in Fig. 4 (c). Qualitatively, the DWs exhibit the previously observed behavior Meier et al. (2012); Wu et al. (2012): tail-to-tail DWs show an enhanced conductance, while head-to-head DWs show diminished conductance with respect to the bulk. Time-dependent current measurements, gained with a stationary tip, show a minor decrease over time (Fig. 4 (d)), indicating that the DW conductance is a predominately intrinsic phenomenon.
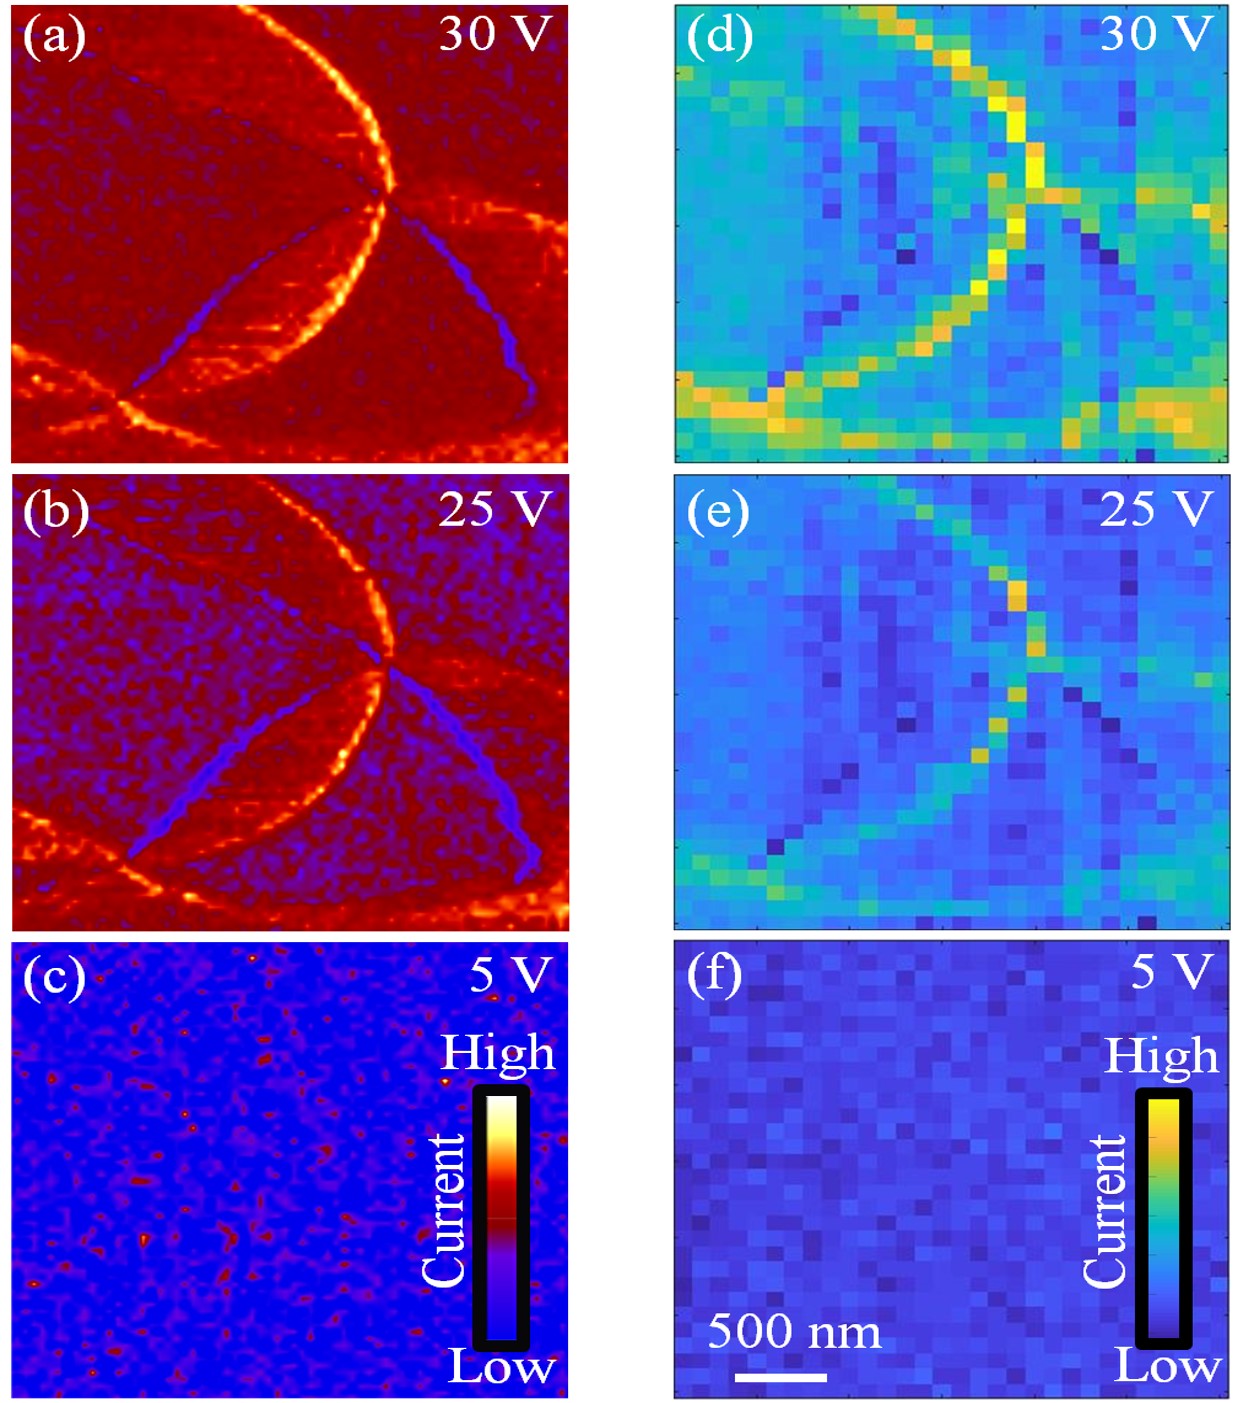
To further exclude contributions from transient currents or DW movements, cAFM mapping and IV-spectroscopy measurements Maksymovych et al. (2012) are compared in Fig 5. In Fig. 5 (a-c), standard voltage-dependent cAFM scans are shown, recorded while scanning the tip at selected voltages. The scans are from the boxed region in Figs. 4 (a). Coarser conductance maps reconstructed from I(V) spectroscopy measurements are displayed in Figs. 5 (d-f). In the latter case, the tip moves to different points in a pre-defined grid and is then stationary while measuring I(V) curves at each point (this was done in a 3m x 3m box with 100 nm between each IV-curve and a voltage ramp rate of 5 V/sec). Independently of the applied SPM method, qualitatively equivalent results are observed, i.e. conducting tail-to-tail DWs and insulating head-to-head DWs. This qualitative agreement corroborates that the obtained DW currents are intrinsic.
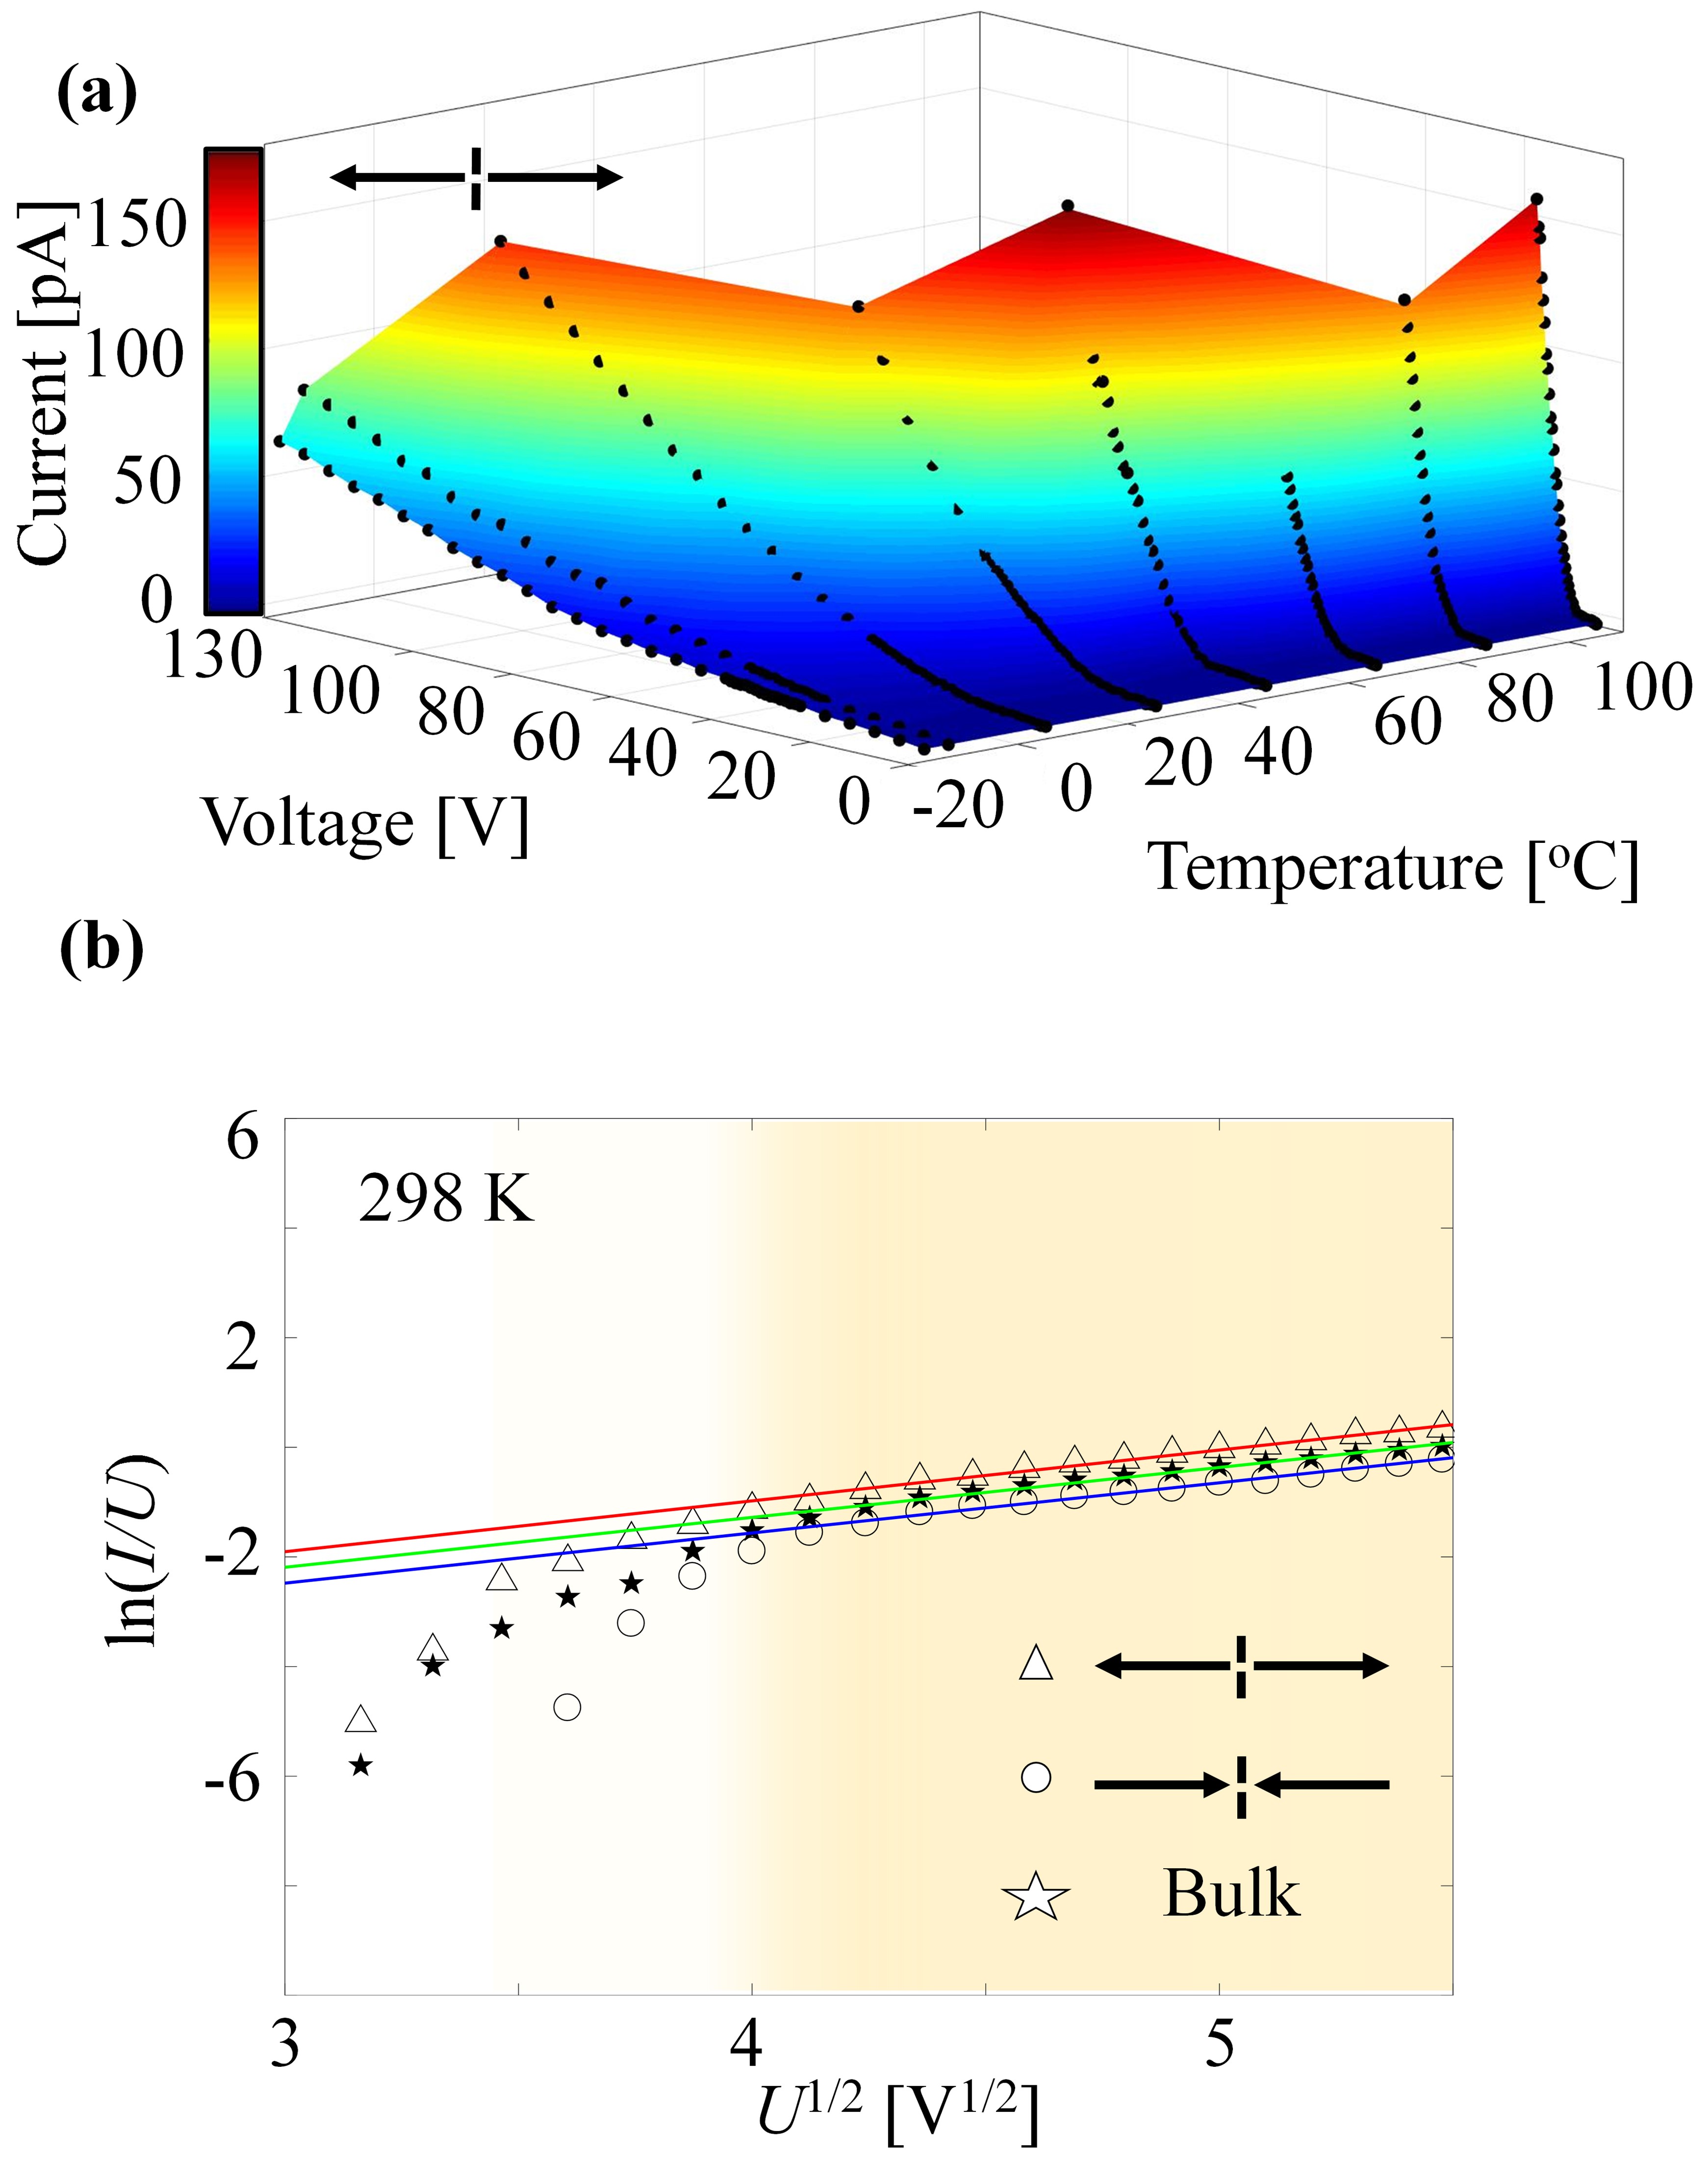
Now that the intrinsic nature of the DW conduction is established, the mechanism for that conduction is investigated using temperature dependent measurements (Fig 6 (a)). Previous studies reported in Ref. Mundy (2017) already narrowed down the possible conduction mechanisms to Space Charge Limited Conduction (SCLC) and Poole-Frenkel Conduction (PFC). Thus, these two mechanisms are investigated in the following. The current-voltage data in Fig. 6 (a) (black dots) is extracted from cAFM scans. For this purpose, a series of voltage-dependent images were taken at different temperatures. The evaluation of the data shows that the bulk and the DWs behave in qualitatively the same way. As such, only the conducting tail-to-tail DWs are considered in Fig. 6 (a).
The most striking feature of the data is the dramatic increase in conductivity with increasing temperature. This increase is in direct contrast to SCLC, which goes as , thus excluding it as a possible conduction mechanism. is the characteristic temperature describing the distribution of trap states in the band gap, as explained in Ref. Simmons (1971). The obtained temperature dependency is, however, consistent with PFC: the dominant conduction mechanism in YMnO3 Moure et al. (1999b). The latter is given by Simmons (1971),
| (1) |
where is the electronic charge, is the trap energy level, is the vacuum permittivity, and the electric field is estimated by (Ref. Stolichnov (2015)). The PFC model is in qualitative agreement with the room temperature data for voltages 4 V1/2 (Fig. 6 (b)), but it consistently overestimates the dielectric constant. At room temperature, PFC fits yields a dielectric constant of , whereas the bulk value is measured to be (see Fig. 3). Thus, while the cAFM data in Fig. 6 allows PFC to be identified as the predominant conduction mechanism in Er(Mn1-x,Tix)O3, it is not suitable to reliably determine associated material parameters.
VI Conclusion
In conclusion, B-site doping has been established as a new control parameter for engineering the electronic properties at ferroelectric domain walls in MnO3. As a model case, Ti-doped ErMnO3 was considered. DFT confirmed that Ti occupies the B-site, where it acts as a donor, reducing the bulk conductivity as quantified by dielectric spectroscopy. cAFM demonstrated the intrinsic nature of domain-wall currents, and pointed towards Poole-Frenkel as the dominant conduction mechanism. The possibility of B-site doping, in addition to previously reported A-site substitution Schaab et al. (2016), enhances the electronic flexibility of the hexagonal manganites and expands the chemical parameter space available for adjusting and optimizing the electronic domain wall behavior.
VII Acknowledgements
The authors thank Trygve Magnus Ræder for his assistance in automating data extraction from the temperature dependent measurements. T.S.H., D.M.E., and D.M. acknowledge funding through NTNU’s Onsager Fellowship Program and Outstanding Academic Fellows Programme. D.R.S. acknowledges funding through The Research Council of Norway (FRINATEK project no. 231430/F20) and NTNU. Computational resources were provided by UNINETT Sigma2 - the National Infrastructure for High Performance Computing and Data Storage in Norway (projects NTNU243 and NN9264K). Crystals were grown at the Lawrence Berkeley Laboratory supported by the U.S. Department of Energy, Office of Science, Basic Energy Sciences, Materials Sciences and Engineering Division (Contract No. DE-AC02-05-CH11231). J.S. and C.T. acknowledge funding from ETH Zurich and SNF (proposal no. 200021_149192, J.S.; proposal no. 200021_147080, C.T.). C.T. acknowledges support by FAST, a division of the SNF NCCR MUST.
References
- Hwang et al. (2012) H. Y. Hwang, Y. Iwasa, M. Kawasaki, B. Keimer, N. Nagaosa, and Y. Tokura, Nat. Mater. 11, 103 (2012).
- Geim and Novoselov (2007) A. K. Geim and K. S. Novoselov, Nat. Mater. 6, 183 (2007).
- Desai (2016) S. B. Desai , Science 354, 99 (2016).
- Zhang et al. (2012) F. Zhang, C. L. Kane, and E. J. Mele, Phys. Rev. B 86, 081303 (2012).
- Salje (2010) E. K. H. Salje, Chem. Phys. Chem. 11, 940 (2010).
- Geng et al. (2012) Y. Geng, N. Lee, Y. J. Choi, S.-W. Cheong, and W. Wu, Nano Lett. 12, 6055 (2012).
- Leo et al. (2015) N. Leo, A. Bergman, A. Cano, N. Poudel, B. Lorenz, M. Fiebig, and D. Meier, Nat. Commun. 6, 6661 (2015).
- Aird and Salje (1998) A. Aird and E. K. H. Salje, J. Phys.: Condens. Matter 10, L377 (1998).
- Seidel (2009) J. Seidel , Nat. Mater. 8, 229 (2009).
- Schröder et al. (2012) M. Schröder, A. Haußman, A. Thiessen, E. Soergel, T. Woike, and L. M. Eng, Adv. Funct. Mater. 22, 3936–3944 (2012).
- Meier et al. (2012) D. Meier, J. Seidel, A. Cano, K. Delaney, Y. Kumagai, M. Mostovoy, N. A. Spaldin, R. Ramesh, and M. Fiebig, Nat. Mater. 11, 284 (2012).
- Wu et al. (2012) W. Wu, Y. Horibe, N. Lee, S.-W. Cheong, and J. R. Guest, Phys. Rev. Lett. 108, 077203 (2012).
- Sluka et al. (2013) T. Sluka, A. K. Tagantsev, P. Bednyakov, and N. Setter, Nat. Commun. 4, 1808 (2013).
- Guyonnet et al. (2011) J. Guyonnet, I. Gaponenko, S. Gariglio, and P. Paruch, Adv. Mater. 23, 5377 (2011).
- Maksymovych et al. (2012) P. Maksymovych, A. N. Morozovska, P. Yu, E. A. Eliseev, Y.-H. Chu, R. Ramesh, A. P. Baddorf, and S. V. Kalinin, Nano Lett. 12, 209 (2012).
- Farokhipoor and Noheda (2011) S. Farokhipoor and B. Noheda, Phys. Rev. Lett. 107, 127601 (2011).
- McQuaid et al. (2017) R. G. P. McQuaid, M. P. Campbell, R. W. Whatmore, A. Kumar, and J. M. Gregg, Nat. Commun. 8, 15105 (2017).
- Campbell et al. (2016) M. P. Campbell, J. P. V. McConville, R. G. P. McQuaid, D. Prabhakaran, A. Kumar, and J. M. Gregg, Nat. Commun. 7, 13764 (2016).
- Carpenter (2015) M. A. Carpenter, J. Phys.: Condens. Matter 27, 263201 (2015).
- Gopalan et al. (2007) V. Gopalan, V. Dierolf, and D. A. Scrymgeour, Annu. Rev. Mater. Res. 37, 449 (2007).
- Catalan et al. (2012) G. Catalan, J. Seidel, R. Ramesh, and J. F. Scott, Rev. Mod. Phys. 84, 119 (2012).
- Meier (2015) D. Meier, J. Phys.: Condens. Matter 27, 463003 (2015).
- Jia et al. (2008) C.-L. Jia, S.-B. Mi, K. Urban, I. Vrejoiu, M. Alexe, and D. Hesse, Nat. Mater. 7, 57 (2008).
- Whyte et al. (2014) J. R. Whyte, R. G. P. McQuaid, P. Sharma, C. Canalias, J. F. Scott, A. Gruverman, and J. M. Gregg, Adv. Mater. 26, 293 (2014).
- Eliseev et al. (2011) E. A. Eliseev, A. N. Morozovska, G. S. Svechnikov, V. Gopalan, and V. Y. Shur, Phys. Rev. B 83, 235313 (2011).
- Gureev et al. (2011) M. Y. Gureev, A. K. Tagantsev, and N. Setter, Phys. Rev. B 83, 184104 (2011).
- Hassanpour et al. (2016) E. Hassanpour, V. Wegmayr, J. Schaab, Z. Yan, E. Bourret, T. Lottermoser, M. Fiebig, and D. Meier, New J. Phys. 18, 043015 (2016).
- Schaab et al. (2016) J. Schaab, A. Cano, M. Lilienblum, Z. Yan, E. Bourret, R. Ramesh, M. Fiebig, and D. Meier, Adv. Electron. Mater. 2, 1500195 (2016).
- Whyte and Gregg (2015) J. R. Whyte and J. M. Gregg, Nat. Commun. 6, 7361 (2015).
- Sharma et al. (2017) P. Sharma, Q. Zhang, D. Sando, C. H. Lei, Y. Liu, J. Li, V. Nagarajan, and J. Seidel, Sci. Adv. 3, e1700512 (2017).
- Mundy (2017) J. A. Mundy , Nat. Mater. 16, 622–627 (2017).
- McGilly et al. (2017) L. J. McGilly, C. S. Sandu, L. Feigl, D. Damjanovic, and N. Setter, Adv. Funct. Mater. 27, 1605196 (2017).
- Gaponenko et al. (2015) I. Gaponenko, P. Tückmantel, J. Karthik, L. W. Martin, and P. Paruch, Appl. Phys. Lett. 106, 162902 (2015).
- Fiebig et al. (2002) M. Fiebig, T. Lottermoser, D. Fröhlich, A. V. Goltsev, and R. V. Pisarev, Nature 419, 818 (2002).
- Lorenz (2013) B. Lorenz, ISRN Condens. Matter Phys. 2013, 497073 (2013).
- Meier et al. (2013) D. Meier, M. Lilienblum, P. Becker, L. Bohatý, N. A. Spaldin, R. Ramesh, and M. Fiebig, Phase Transitions 86, 33 (2013).
- Aken et al. (2004) B. B. V. Aken, T. T. M. Palstra, A. Filippetti, and N. A. Spaldin, Nat. Mater. 3, 164 (2004).
- Fennie and Rabe (2005) C. J. Fennie and K. M. Rabe, Phys. Rev. B 72, 100103(R) (2005).
- Salje (2016) E. K. H. Salje, New J. Phys. 18, 051001 (2016).
- Moure et al. (1999a) C. Moure, M. Villegas, J. F. Fernandez, J. Tartaj, and P. Duran, J. Mater. Sci. 34, 2565 – 2568 (1999a).
- Aken et al. (2001) B. B. V. Aken, J.-W. G. Bos, R. A. de Groot, and T. T. M. Palstra, Phys. Rev. B 63, 125127 (2001).
- Ismailzade et al. (1971) I. H. Ismailzade, G. A. Smolenskii, V. I. Nesterenko, and F. A. Agaev, Phys. Stat. Sol. 5, 83 (1971).
- Asaka et al. (2005) T. Asaka, K. Nemoto, K. Kimoto, T. Arima, and Y. Matsui, Phys. Rev. B 71, 014114 (2005).
- Levin et al. (2017) I. Levin, V. Krayzman, T. A. Vanderah, M. Tomczyk, H. Wu, M. G. Tucker, H. Y. Playford, J. C. Woicik, C. L. Dennis, and P. M. Vilarinho, J. Solid State Chem. 246, 29 (2017).
- McCarthy et al. (1973) G. J. McCarthy, P. V. Gallagher, and C. Sipe, Mat. Res. Bull. 8, 1277 (1973).
- Remsen and Dabrowski (2011) S. Remsen and B. Dabrowski, Chem. Mater. 23, 3818 (2011).
- Selbach et al. (2012) S. M. Selbach, A. N. Løvik, K. Bergum, J. R. Tolchard, M.-A. Einarsrud, and T. Grande, J. Solid State Chem. 196, 528 (2012).
- Skjærvø et al. (2016) S. H. Skjærvø, E. T. Wefring, S. K. Nesdal, N. H. Gaukås, G. H. Olsen, J. Glaum, T. Tybell, and S. M. Selbach, Nat. Commun. 7, 13745 (2016).
- Jungk et al. (2010) T. Jungk, Á. Hoffmann, M. Fiebig, and E. Soergel, Appl. Phys. Lett. 97, 012904 (2010).
- Mori et al. (2005) S. Mori, J. Tokunaga, Y. Horibe, Y. Aikawa, and T. Katsufuji, Phys. Rev. B 72, 224434 (2005).
- Rao et al. (1971) G. V. S. Rao, B. M. Wanklyn, and C. N. R. Rao, J. Phys. Chem. Solids 32, 345 (1971).
- Chae et al. (2012) S. C. Chae, N. Lee, Y. Horibe, M. Tanimura, S. Mori, B. Gao, S. Carr, and S.-W. Cheong, Phys. Rev. Lett. 108, 167603 (2012).
- Smolenskii and Bokov (1964) G. A. Smolenskii and V. A. Bokov, J. Appl. Phys. 35, 915 (1964).
- Yan et al. (2015) Z. Yan, D. Meier, J. Schaab, R. Ramesh, E. Samulon, and E. Bourret, J. Cryst. Growth 409, 75 (2015).
- Blöchl (1994) P. E. Blöchl, Phys. Rev. B 50, 17953 (1994).
- Kresse and Furthmüller (1996) G. Kresse and J. Furthmüller, Phys. Rev. B 54, 11169 (1996).
- Kresse and Joubert (1999) G. Kresse and D. Joubert, Phys. Rev. B 59, 1758 (1999).
- Perdew et al. (2008) J. P. Perdew, A.Ruzsinszky, G. I. Csonka, O. A. Vydrov, G. E. Scuseria, L. A. Constantin, X. Zhou, and K. Burke, Phys. Rev. Lett. 100, 136406 (2008).
- Dudarev et al. (1998) S. L. Dudarev, G. A. Botton, S. Y. Savrasov, C. J. Humphreys, and A. P. Sutton, Phys. Rev. B 57, 1505 (1998).
- Medvedeva et al. (2000) J. E. Medvedeva, V. I. Anisimov, M. A. Korotin, O. N. Mryasov, and A. J. Freeman, J. Phys.: Condens. Matter 12, 4947 (2000).
- Shannon (1976) R. D. Shannon, Acta Cryst. A32, 751 (1976).
- Krohns et al. (2008) S. Krohns, P. Lunkenheimer, S. G. Ebbinghaus, and A. Loidl, J. Appl. Phys. 103, 084107 (2008).
- Lunkenheimer et al. (2010) P. Lunkenheimer, S. Krohns, S. Riegg, S. G. Ebbinghaus, A. Reller, and A. Loidl., Eur. Phys. J. Special Topics 180, 61 (2010).
- Adem et al. (2015) U. Adem, N. Mufti, A. A. Nugroho, G. Catalan, B. Noheda, and T. T. M. Palstra, J. Alloys Compd. 638, 228 (2015).
- Jonscher (1977) A. K. Jonscher, Nature 267, 673 (1977).
- Ruff et al. (2017) E. Ruff, S. Krohns, M. Lilienblum, D. Meier, M. Fiebig, P. Lunkenheimer, and A. Loidl, Phys. Rev. Lett. 118, 036803 (2017).
- Moure et al. (1999b) C. Moure, J. F. Fernandez, M. Villegas, and P. Duran, J. Eur. Ceram. Soc. 19, 131 (1999b).
- Johann et al. (2010) F. Johann, Á. Hoffmann, and E. Soergel, Phys. Rev. B 81, 094109 (2010).
- Simmons (1971) J. G. Simmons, J. Phys. D: Appl. Phys. 4, 613 (1971).
- Stolichnov (2015) I. Stolichnov , Nano Lett. 15, 8049 (2015).