Proceedings of the Fifth Annual LHCP ATL-PHYS-PROC-2017-209
Higgs boson measurements in the , , and channels with the ATLAS Experiment
KATHRIN BECKER
On behalf of the ATLAS Collaboration,
Department of Physics
University of Oxford, Parks Road, OX1 3PU Oxford, United Kingdom
ABSTRACT
The status of Higgs boson measurements in the , , and decay modes with the ATLAS experiment is presented. These measurements are done using collision data from the Large Hadron Collider with either the full Run 1 dataset at and or with a partial Run 2 dataset at of either or . The different couplings to the Higgs boson are probed by measuring the production cross sections and extracting the signal strengths. Depending on the analysis, the measurements are sensitive to the gluon-fusion or vector-boson fusion Higgs boson production, or associated production of a vector boson and a Higgs boson.
PRESENTED AT
The Fifth Annual Conference
on Large Hadron Collider Physics
Shanghai Jiao Tong University, Shanghai, China
May 15-20, 2017
1 Introduction
In this document the status of measurements of the Standard Model (SM) Higgs boson in the , , and decay modes are discussed which are done with the ATLAS experiment [1] at the Large Hadron Collider (LHC). These measurements are performed using collision data from the Large Hadron Collider with either the full Run 1 dataset at and or a partial Run 2 dataset at .
All measurements presented aim to probe the couplings of the SM Higgs boson to either bosons () or fermions ( and ). This is done by measuring the Higgs production cross section times branching fraction, for a specific production process and a decay mode . The signal strength, , is defined as the ratio of the measured Higgs boson rate to its SM prediction:
| (1) |
The subscript “SM” refers to the respective SM prediction.
Each analysis (channel) is sensitive to different Higgs boson production processes. In all presented decay modes, Higgs boson production via gluon-gluon fusion (ggF) and via vector-boson fusion (VBF) are probed. The associated production is only discussed for where a Run 2 analysis is available.
2 Measurements in
In Run 1 a complete set of analyses has been performed in the decay mode, investigating the ggF, VBF, and production processes. The combined ggF and VBF analysis has led to the observation of the decay mode with a significance of , measuring a signal strength of [2]. Also evidence was established for the VBF production process. It can be seen, that already in Run 1 the combined signal strength measurement has statistical and systematic uncertainties of a similar size. In addition to the signal strength and inclusive cross section measurements, first measurements of fiducial and differential cross sections have been performed for the ggF production process [3]. A search for production [4] has yielded a signal strength of corresponding to an observed significance of .
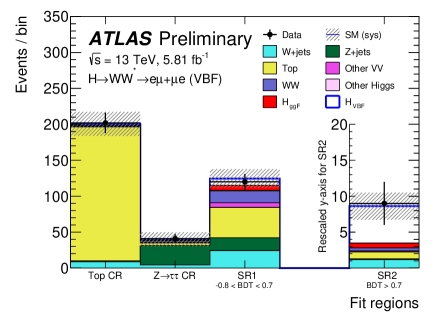
At a first analysis investigating the VBF and production mode has been performed with a dataset of [5]. To measure the VBF production cross section, two opposite-flavour (), opposite-sign leptons with are selected where the leading electron (muon) is required to have () and the mass of the dilepton system is required to be larger than . A requirement of is applied to enhance the contribution from VBF signal events. Here, the jets are required to have if and for . A -jet veto is applied to reject top-quark background and a requirement on the invariant mass of the system (), , is applied to reject background from . An “outside-lepton-veto” (OLV) is applied which requires the leptons to reside within the rapidity gap spanned by the two leading jets, as preferred by VBF event topology. The “central-jet-veto” (CJV) rejects events with additional jets with in the rapidity gap of the two leading jets, suppressing backgrounds with more jet activity, such as production. To further improve the signal-to-background ratio a boosted decision tree (BDT) [6, 7, 8] is trained using eight discriminating variables. These variables exploit either properties of the decay, which is the case for , , and , or properties of the VBF signature, which is the case for , , , , and . The BDT score ranging from 1 to 1 is used to define the signal region by requiring the score to be larger than 0.8. Two bins of the remaining BDT score are defined with bin denoted SR1 and bin denoted SR2.
The largest background contributions in the SR originate from top-quark production, production, and production. production is normalised to theory prediction, but the top-quark and backgrounds are normalised to the data yield of a dedicated control region. The top-quark control region is defined by inverting the -jet veto to a -jet tag, while the control region is defined by changing the requirement to be within of . The VBF cross section and signal strength parameter are extracted by performing a simultaneous likelihood fit to SR1 and SR2 as well as the top-quark and control regions. The fit regions are shown in Figure 1(a) where signal and background predictions have been normalised to the results of the fit. The resulting VBF signal strength is , which yields a cross section of . The observed (expected) significance is () assuming a Higgs boson mass of . This first measurement of VBF production is still dominated by statistical uncertainties.
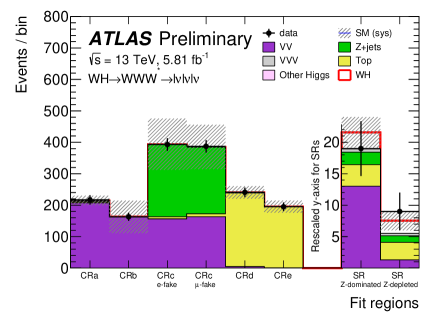
For the measurement of production three isolated leptons with and a total electric charge of are selected. A requirement of and a -jet veto are applied to reject top-quark background. To reduce the background, the largest opposite-sign di-lepton invariant mass is required to be less than . Also a veto on boson production is applied. To select Higgs boson event topology, the angular separation between lepton with unique charge and the closest lepton to it, , is required to be smaller than 2 radians. Then, two signal region categories are defined by the number of same-flavour opposite-sign (SFOS) lepton pairs. Events with at least one pair of SFOS leptons are classified in the “-dominated” category where background from and boson production dominates, while events without any SFOS pairs are classified in the “-depleted” category where background from top-quark production dominates.
Data control regions are defined for both signal regions to normalise top-quark, , and boson production to data yields. These six control regions and the two signal regions are fitted simultaneously to extract the signal strength and production cross section. An overview on the fit regions is given in Figure 1(b). The observed (expected) significance is () assuming a Higgs boson mass of . The resulting signal strength is yielding a cross sections of . The presented measurement is dominated by statistical uncertainties.
3 Measurements in
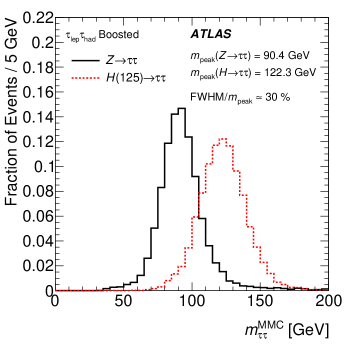
The decay is the most sensitive channel for leptonic Higgs boson decays, due to its high branching ratio. The most recent analysis uses the full Run 1 dataset with a centre-of-mass energy of and and investigates the ggF and VBF production mode [9]. All decays of the lepton (both leptonic, , and hadronic, ) are considered, leading to three analysis channels denoted , , and . Following a preselection, detailed in Ref. [9], events in each channel are split into two categories. The VBF category contains events with two jets separated in pseudo-rapidity and targets signal events produced through VBF production. The “Boosted” category targets signal events where the Higgs boson has been produced with a large boost, primarily from ggF production, and requires the transverse momentum of the reconstructed Higgs boson candidate to be greater than 100 GeV. Combining analysis channels and categories yields six signal regions. Separate BDTs are trained for each, using between six and nine input variables. The selection of these variables has been separately optimised for each signal region, and chosen in order to exploit discriminating features such as resonance properties, event activity and topology, as well as the characteristic VBF topology in the corresponding category. One of the most important input variables is the mass of the di- system, the reconstruction of which is quite challenging due to the presence of at least two neutrinos in the final state; the Missing Mass Calculator (MMC) is used for this purpose [10]. Figure 2(a) shows a comparison of reconstructed masses for the data-based estimation of (see next paragraph) and signal Monte Carlo in the channel. Good discrimination is observed.
The background composition differs between each analysis channel, but in all three the most important background is the irreducible production. This background is modelled using the “embedding” technique, where events are selected in data and the reconstructed muons are replaced by simulated lepton decays. Thus, the boson kinematics and all other event activity comes entirely from data. Another important background in the and channels stems from jets being mis-identified as hadronic leptons. Fully data-driven techniques are used for the estimation of backgrounds from misidentified decay products, described in detail in Ref. [9]. In addition, control regions are introduced to normalise the background contributions from top-quark production and production.
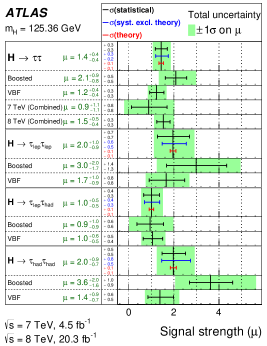
The signal strength and cross section are extracted by fitting the BDT score with signal and background templates simultaneously in the six SR together with nine control regions to better constrain the background normalisations. An excess of data events over the background prediction is observed in all three sub-channels. The observed signal strength is for a Higgs boson mass of . Figure 2(b) shows the observed value of in the individual channels. Leading systematic uncertainties are the theoretical systematic uncertainty on the ggF production, the uncertainty on the normalisation of the and top quark backgrounds in , and the uncertainty on the jet energy scale calibration. The observed (expected) significance of the measurement is () providing direct evidence for decays.
4 Measurements in
Searches for the decay are performed to establish the Yukawa coupling of the Higgs boson to second generation fermions. While the mass resolution of the channel is good yielding a clean experimental signature, the sensitivity of the search is severely restricted by the low branching ratio of this decay for the Higgs boson in the SM which is [11]. The search is performed investigating the ggF and VBF Higgs boson production mode using of Run 2 collision data at [12].
Events are selected for the analysis if they contain exactly two isolated muons of opposite charge with . To ensure a high trigger efficiency, the leading muon must have . Jets are required to have if and for . To reduce the background from top-quark production, a -jet veto is applied and events are required to have . The search is performed by fitting the dimuon invariant mass distribution, , which is required to be in the signal region. This relatively wide range is chosen to allow determination of the background shape and normalisation from the sidebands.
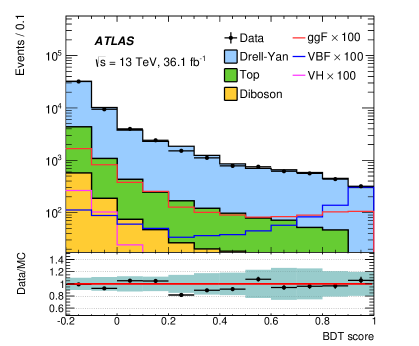
The signal region is then divided into six categories targeting ggF production and two categories targeting VBF production. The VBF categories are only considered for events containing at least two jets. Here, a BDT is trained using di-muon and di-jet variables as well as muon-jet variables. Figure 3(a) shows the BDT score. The two VBF categories correspond to the bins and . The remaining events are then split into categories according to the transverse momentum of the dimuon system ( ): low (), medium () and high (). Events in each of these three categories are then further classified into a central (if both muons have ) and a non-central (if one or both muons have ) category. The reason for this final classification is that muon momentum resolution in the barrel region is better, thus producing a narrower invariant mass distribution and a higher overall sensitivity.
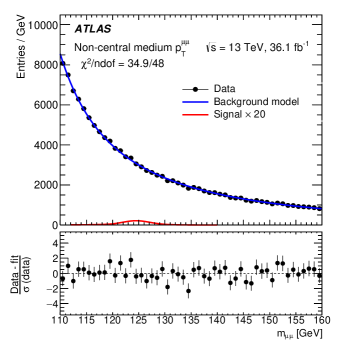
Analytic models are used to describe the signal and background distributions, detailed in Ref. [12]. The signal is described by the sum of a Gaussian and a Crystal Ball function; the parameters of the model are obtained from fits to simulated SM Higgs boson samples. The adopted model for the background is the sum of a Breit-Wigner function convolved with a Gaussian function, and an exponential function divided by a cubic function. The results of the search are obtained by a binned maximum-likelihood fit of the sum of the signal and background models to the observed distributions in the range 110-. The fit is done simultaneously in all categories. Figure 3(b) shows the background-only fit to the observed distribution in the non-central medium category.
The resulting signal strength is . Thus, no excess is seen over the background expectation and an exclusion limit can be set on the signal strength. For a Higgs boson mass of the observed (expected) limit at 95% confidence level (CL) is 3.0 (3.1) times the SM prediction. This limit is driven by the data statistical uncertainty. When combined with the ATLAS Run 1 data, the observed (expected) upper limit is 2.8 (2.9) at the 95% CL.
5 Conclusions
A review of the latest ATLAS results in measurements of Higgs boson decays to , , and has been presented. Observation of the Higgs boson decay to is established with the analysis of Run 1 data. Additionally a first look at the VBF and production modes in Run 2 has been presented. Both analyses are still statistically limited. Evidence of the Higgs boson decay to has been established with the analysis of Run 1 data. The measured signal strength of is in agreement with the SM prediction. A search for decays has been performed with the 2015+2016 Run 2 dataset and combined with the Run 1 dataset. The upper limit at the 95% CL is 2.8 times the SM prediction.
References
- [1] ATLAS Collaboration, JINST 3 (2008) S08003.
- [2] ATLAS Collaboration, Phys. Rev. D 92, 012006 (2015) [arXiv:1412.2641 [hep-ex]].
- [3] ATLAS Collaboration, JHEP 08 (2016) 104 [arXiv:1604.02997 [hep-ex]]
- [4] ATLAS Collaboration, JHEP 08 (2015) 137 [arXiv:1506.06641 [hep-ex]].
- [5] ATLAS Collaboration, ATLAS-CONF-2016-112, http://cds.cern.ch/record/2231811.
- [6] L. Breiman, J. Friedman, R. Olshen and C. Stone, Wadsworth and Brooks, 1984.
- [7] Y. Freund, R. E. Schapire, J. Comput. Syst. Sci. 55 (1997) 119.
- [8] J. H. Friedman, Comput. Stat. Data Anal. 38 (2002) 367 378.
- [9] ATLAS Collaboration, JHEP 04 (2015) 117 [arXiv:1501.04943 [hep-ex]].
- [10] A. Elagin, P. Murat, A. Pranko and A. Sofanov, Nucl. Instrum. Meth. A654 (2011) 481 489 [arXiv:1012.4686 [hep-ex]].
- [11] LHC Higgs Cross Section Working Group. [arXiv:1610.07922 [hep-ph]].
- [12] ATLAS Collaboration, Phys. Rev. Lett. 119 (2017) 051802 [arXiv:1705.04582 [hep-ex]].