Observation of Laser Power Amplification in a Self-Injecting Laser Wakefield Accelerator
Abstract
We report on the depletion and power amplification of the driving laser pulse in a strongly-driven laser wakefield accelerator. Simultaneous measurement of the transmitted pulse energy and temporal shape indicate an increase in peak power from TW to a maximum of TW after 13 mm of propagation in plasma density of cm-3. The power amplification is correlated with the injection and acceleration of electrons in the nonlinear wakefield. This process is modeled by including localized redshift and subsequent group delay dispersion at the laser pulse front.
pacs:
41.75.Jv, 42.65.Jx, 52.38.Dx, 52.38.Hb, 52.38.Kd, 52.65.RrLaser wakefield accelerators (LWFA) Tajima and Dawson (1979) can now produce electron beams with particle energies greater than GeV from centimeter scale interaction lengths Leemans et al. (2014); Wang et al. (2013); Kim et al. (2013). In an LWFA, a high-intensity laser pulse propagating through a plasma initiates a plasma wave, which exhibits extremely high longitudinal electric fields. Numerous methods have been demonstrated to inject particles within a LWFA Esarey et al. (2009); Rowlands-Rees et al. (2008); Pak et al. (2010); McGuffey et al. (2010). Of these, self-injection in the highly nonlinear ‘bubble’ or ‘blowout’, regime Mangles et al. (2004); Geddes et al. (2004); Faure et al. (2004); Leemans et al. (2014) is amongst the simplest and thus most common. By using self- Thomas et al. (2007) or external guiding Spence and Hooker (2000), it is possible to maintain the LWFA far beyond the normal Rayleigh diffraction length. However, the eventual energy gain of electrons by the wakefield is limited either by dephasing, or by depletion of the driving laser pulse Lu et al. (2007).
Dephasing occurs when electrons outrun the wakefield, which is usually said to move at the linear group velocity of the laser pulse in the plasma, , where and are the plasma and laser angular frequencies respectively. For a linear relativistic plasma wave, (i.e. with wavelength and Lorentz factor , where is the critical density), the dephasing length is .
For a short duration laser pulse driving a nonlinear wakefield, (pulse length and normalized vector potential ), plasma electrons are pushed outward by the front of the pulse such that the rear of the pulse propagates in an ion cavity. Pump depletion occurs at the front of the laser pulse as energy is coupled into the plasma wave or lost due to diffraction. As a result of this localized depletion, the laser rapidly evolves to have a sharp rising edge, which etches back through the pulse Decker et al. (1996); Vieira et al. (2010). Decker et al. Decker et al. (1996) showed that the velocity of this pulse front etching is in the group velocity frame of the laser. The depletion length is then
| (1) |
For a near-resonant pulse, , then , and so depletion should not limit electron energy gain. However, because of pulse front etching, the effective laser pulse velocity is reduced, such that the plasma wave phase velocity becomes for . This reduces the dephasing length to , which limits the maximum electron energy gain Lu et al. (2007).
Although guiding has been demonstrated up to for a range of plasma densities Ralph et al. (2009), no quantitative measurement of pump depletion in nonlinear LWFA has been reported. In addition, the pulse front etching model does not include laser power amplification that is observed in numerical simulations Gordon et al. (2003). Pulse shortening of LWFA drive pulses has been previously reported Faure et al. (2005); Schreiber et al. (2010), but not the power amplification, which is vital for self-injection of electrons Kalmykov et al. (2009); Froula et al. (2009); Kneip et al. (2009); Sävert et al. (2015); Bloom et al. (2017).
In this letter, we present measurements of energy depletion and pulse compression of a relativistic () short-pulse () laser in a self-guided LWFA. We also report the first direct measurements of power amplification of the driving laser pulse. These results are modeled by considering group velocity dispersion of the laser pulse as the leading edge is redshifted. The power amplification was found to be coincident with the onset of electron self-injection, confirming its vital role in this process.
The experiment was performed using the Gemini laser Hooker et al. (2006), interacting with a supersonic helium gas jet, at electron densities of up to cm-3 (0.007 ). Each linearly polarized laser pulse, of wavelength , contained J of energy in a duration of fs. The laser was focused onto the front of the gas target with an parabolic mirror at a peak .
A magnetic electron spectrometer was used to measure the spectrum of the accelerated electron beam. The laser pulse at the exit plane of the plasma was imaged with a pair of spherical mirrors at a resolution of 10 m over a field of view of 902 m 675 m. The transmitted energy was measured by integrating the counts on the camera, which was cross-calibrated with an energy diode. Also, a 5 mm diameter area near the center of the transmitted beam, of the full beam diameter, was directed to two Grenouille (Swamp Optics) SHG-FROGs (second harmonic generation frequency resolved optical gating) Trebino (2000). These devices produce spectrally dispersed autocorrelations, from which the complete temporal intensity and phase information of the pulse was retrieved using an iterative algorithm.
The spectral window of the FROG diagnostics were limited, such that the first could measure to a lower pulse length limit of 10 fs, for a time-bandwidth limited pulse, while the second was restricted to 20 fs. Additional glass was placed in the beam path of the second FROG to create a known spectral phase offset between the two diagnostics. Only retrieved pulses with the correct time direction have the correct phase offset, and so the inherent time-direction ambiguity could be resolved. This process was possible for cm-3, while at higher densities, the spectrum became too broad for the second FROG. For these measurements, gradual changes of the pulse shape and Wigner Wigner (1932) transforms with increasing density were used to determine the direction of time. The phase retrieval algorithm was performed 10 times, each time with a different random seed, and variations in the retrieved pulses were included in the measurement error. Shots with visibly poor retrievals, large FROG errors (rms relative pixel error ) or unresolved time direction uncertainties are not included in the results. Out of 59 shots, 43 are included in the graph.
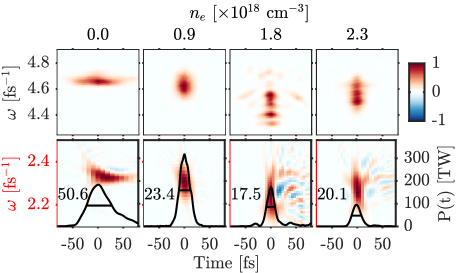
Example FROG traces and retrieved pulses are shown in fig. 1. The pulses were observed to frequency downshift and temporally compress for increasing plasma density up to cm-3 for a 15 mm diameter nozzle. Beyond this density, the pulse length increased again due to energy depletion of the laser pulse.
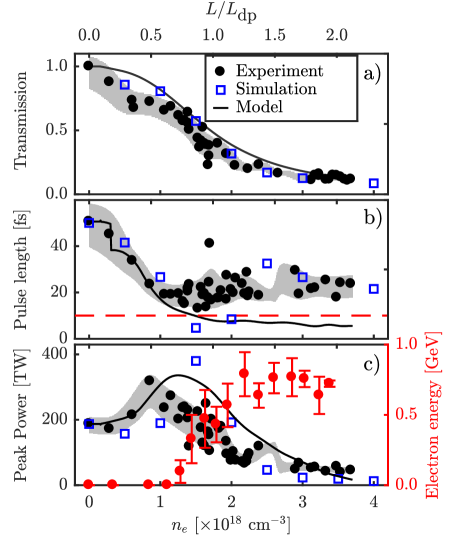
The results are shown as a function of plasma density for a 15 mm nozzle diameter in fig. 2. For the plots of pulse energy transmission, transmitted pulse length and peak power, each data point represents one measurement. The maximum electron energy [fig. 2c] was taken as the highest point where the electron signal was above three times the rms background variation, after subtraction of the on-shot background. These values are averaged over multiple () shots within a density bin width of cm-3, with error bars combining statistical and measurement errors. The ratio of the interaction length to [eq. 1] is shown for comparison at the top of fig. 2a, with .
Transmitted laser energy decreased with increasing density [fig. 2a]. About 50% of the energy was transmitted for , and was only fully depleted for . Imaging of the exit plane showed a guided spot for cm-3, while for cm-3, only the unguided fraction of the laser energy was observed. The measured pulse duration [fig. 2b] decreased from an initial fs to fs for . For these higher densities, the spectral broadening resulted in spectral clipping in the FROG diagnostic and so the retrieved pulse was longer than the input pulse. The shortest observed pulse length in a single shot was fs for cm-3. The peak power of the laser pulse after the interaction [fig. 2c] was calculated by setting the energy of the transmitted pulse equal to the time integral of the temporal pulse shape. The power was observed to increase, with a maximum at cm-3, increasing from TW to TW. Wide-angle electron emission was produced for cm-3 but the charge increased significantly for cm-3 [fig. 2c], where the maximum power enhancement was observed. Maximum electron energies, of GeV, occurred at cm-3, in line with scaling predictions Lu et al. (2007).
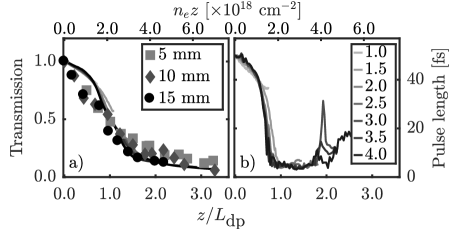
Figure 3 shows laser measurements from three nozzle diameters (temporal diagnostic was only available for the 15 mm nozzle). The similarity of the results when scaling the propagation length by the depletion length [eq. 1] indicates that laser evolution is a function of areal density, , over the covered density range.
The experiment was simulated using the OSIRIS Fonseca et al. (2002) particle-in-cell code in 2D3V geometry. The simulation window moved at along the laser propagation direction and had dimensions of m divided into cells in the pulse propagation () and the transverse () directions respectively. The pulse envelope was modeled using a polynomial approximation to a gaussian with fs, focused to a spot width m and a peak of 3.0. The plasma target was 15 mm in length, including linear density ramps over m at the entrance and exit of the plasma, approximating the experimental density profile, with 4 electron macro-particles per cell and stationary ions.
The simulated pulse properties at the plasma exit are shown alongside the experimental data in figs. 2 and 3. The energy depletion and pulse compression proceeds at similar rates as in the experiment, but the pulse compresses to a minimum of 4 fs (below the experimental measurement limit) at cm-3. At higher densities, the pulse length increases again, once almost all the laser energy depletes, and the short compressed peak in the laser field vanishes.
Figure 4a shows the propagation dependence of the on-axis plasma density modulation in the reduced group velocity () reference frame, for cm-3. The laser peak , plotted as a red line, first increases via pulse compression, and then decreases due to pump depletion. Self-focusing is observed in the first 1 mm of plasma, after which a stable guided spot size is reached. The density peak coinciding with the leading edge of the laser pulse moves at close to the reduced group velocity, as represented by a horizontal line in the coordinate frame of the figure, in agreement with the pulse front etching model Decker et al. (1996). Deviation from this velocity is seen at early times, before the sharp front of the driving pulse forms, and at late times, once the laser is mostly depleted.
Rapid compression of the driving pulse occurs 4 mm into the target, increasing the plasma bubble radius, since Lu et al. (2006). During this stage of the interaction, the effective phase velocity of the back of the wake decreases from to . This coincides with self-injection of plasma electrons Schroeder et al. (2011), as seen by the straight lines originating from the back of the first plasma wave and advancing relative to the plasma wave as the simulation progresses. The injection occurs over a short propagation distance, populating a narrow phase region of the wakefield, similar to injection mechanisms that use tailoring of the target density profile to modify the plasma wave phase velocity Bulanov et al. (1998); Geddes et al. (2008); Kalmykov et al. (2009).
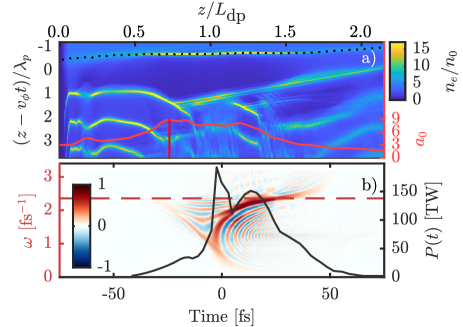
The pulse frequency-shift and compression is illustrated by the Wigner transform of the simulated laser pulse at mm in fig. 4b. The pulse is largely red-shifted at the first density maximum of the plasma wave, close to the maximum of the laser intensity, as discussed by Schreiber et al. Schreiber et al. (2010).
In the simple picture of pulse front etching, the leading edge of the laser pulse continually moves back through the pulse, locally reducing the laser power to zero. In reality, as photons at the leading edge are redshifted they will begin to slip back through the pulse due to group velocity dispersion, as illustrated in fig. 4b. Photons are able to drift back away from the depletion region once their velocity is less than that of the laser pulse front. Equating the group velocity of a redshifted photon to the reduced group velocity of the laser pulse front, , gives the minimum frequency reached by these photons as . Once the power of the leading edge of the laser pulse drops below the critical power for self-focusing , then it will diffract and no longer drive a plasma wave. Therefore, the energy coupled into the plasma from a local region in the power profile . The remaining energy, , is transported back through the pulse by these redshifted photons, into a region of low plasma density, where the group velocity dispersion is much smaller. This leads to an increase in power behind the depletion front, and thereby modifies the energy depletion rate.
Numerical calculations were performed, by stepping though the initial power profile from the first point at which for a given plasma density, reducing the power at this point to . The un-depleted fraction of this energy, (), is added to the following region of the pulse, averaged over to approximate the effect of group velocity dispersion. The pulse energy, duration and peak power after propagating 13 mm are calculated for each plasma density and are plotted as black lines in fig. 2.
The numerical model predicts the energy depletion rate observed experimentally. The pulse compression is well reproduced until cm-3, where the pulse length reaches a value lower than can be measured experimentally. The power amplification effect is also matched by the model, predicting a maximum power for cm-3. Though, at this density, the experimental measurement is instrument limited, because the pulse spectrum was broader than spectral range of the FROG diagnostic.
For a gaussian laser pulse with the initial peak power , maximum power amplification is reached when the pulse is etched to approximately the midway point, and the laser pulse energy is reduced by . This occurs after an evolution length,
| (2) |
For moderate values of ( cm-3 in fig. 2), the evolution length is approximately equal to the usually quoted depletion length , and the pulse is only fully depleted at . Taking injection to occur first at the position , pump depletion of a 180 TW 50 fs pulse occurs before dephasing for cm-3. At the density for which the maximum electron energy was observed in the experiment, cm-3, injection occurs at mm, giving an acceleration length of 4.4 mm. However, the initial pulse shape in the experiment was non-gaussian, having a rapid rising edge and an extended falling edge. As a result, was shortened to 7.2 mm, with the consequence that more laser energy remained in the pulse, allowing the acceleration length to be extended to 5.8 mm. Using this value, and the experimentally measured electron energy, the average acceleration gradient over this acceleration length was GeVm-1.
Hence, our pulse evolution model demonstrates that the laser pulse evolution is heavily influenced by the initial pulse shape. By using a pulse with an initially sharp rising edge, the laser pulse peak power increases rapidly, triggering injection before much of the laser energy is lost. A slow falling edge will then extend the depletion length, which could allow a large to be maintained over a longer distance. In this way, it may be possible to tailor the pulse shape to optimize the injection and acceleration processes, benefiting the many applications of these accelerators, such as the generation of large numbers of x-rays Kneip et al. (2011), gamma rays Sarri et al. (2015) and positrons Sarri et al. (2014).
We would like to acknowledge technical support from CLF staff. This research was supported by STFC (ST/P002056/1, ST/J002062/1, ST/P000835/1), and EPSRC (EP/I014462/1). We thank the Osiris consortium (UCLA/IST) for the use of Osiris. M. Wing acknowledges the support of DESY, Hamburg and the Alexander von Humboldt Stiftung. A.G.R. Thomas acknowledges funding from the NSF grant 1535628 and DOE grant DE-SC0016804. All data created during this research are openly available from Lancaster University data archive at http://dx.doi.org/10.17635/lancaster/researchdata/15. This work has now been published at
∗ z.najmudin@imperial.ac.uk
References
- Tajima and Dawson (1979) T. Tajima and J. M. Dawson, Physical Review Letters 43, 267 (1979).
- Leemans et al. (2014) W. P. Leemans, A. J. Gonsalves, H.-S. Mao, K. Nakamura, C. Benedetti, C. B. Schroeder, C. Tóth, J. Daniels, D. E. Mittelberger, S. S. Bulanov, J.-L. Vay, C. G. R. Geddes, and E. Esarey, Physical Review Letters 113, 245002 (2014).
- Wang et al. (2013) X. Wang, R. Zgadzaj, N. Fazel, Z. Li, S. A. Yi, X. Zhang, W. Henderson, Y.-Y. Chang, R. Korzekwa, H.-E. Tsai, C.-H. Pai, H. Quevedo, G. Dyer, E. Gaul, M. Martinez, A. C. Bernstein, T. Borger, M. Spinks, M. Donovan, V. Khudik, G. Shvets, T. Ditmire, and M. C. Downer, Nature Communications 4, 1988 (2013).
- Kim et al. (2013) H. T. Kim, K. H. Pae, H. J. Cha, I. J. Kim, T. J. Yu, J. H. Sung, S. K. Lee, T. M. Jeong, and J. Lee, Physical Review Letters 111, 165002 (2013).
- Esarey et al. (2009) E. Esarey, C. Schroeder, and W. Leemans, Reviews of Modern Physics 81, 1229 (2009).
- Rowlands-Rees et al. (2008) T. P. Rowlands-Rees, C. Kamperidis, S. Kneip, A. J. Gonsalves, S. P. D. Mangles, J. G. Gallacher, E. Brunetti, T. Ibbotson, C. D. Murphy, P. S. Foster, M.J.V. Streeter, F. Budde, P. A. Norreys, D. A. Jaroszynski, K. Krushelnick, Z. Najmudin, and S. M. Hooker, Physical Review Letters 100, 105005 (2008).
- Pak et al. (2010) A. Pak, K. A. Marsh, S. F. Martins, W. Lu, W. B. Mori, and C. Joshi, Physical Review Letters 104, 025003 (2010).
- McGuffey et al. (2010) C. McGuffey, A. G. R. Thomas, W. Schumaker, T. Matsuoka, V. Chvykov, F. J. Dollar, G. Kalintchenko, V. Yanovsky, A. Maksimchuk, K. Krushelnick, V. Y. Bychenkov, I. V. Glazyrin, and A. V. Karpeev, Physical Review Letters 104, 025004 (2010).
- Mangles et al. (2004) S. P. D. Mangles, C. D. Murphy, Z. Najmudin, A. G. R. Thomas, J. L. Collier, A. E. Dangor, E. J. Divall, P. S. Foster, J. G. Gallacher, C. J. Hooker, D. A. Jaroszynski, A. J. Langley, W. B. Mori, P. A. Norreys, F. S. Tsung, R. Viskup, B. R. Walton, and K. Krushelnick, Nature 431, 535 (2004).
- Geddes et al. (2004) C. G. R. Geddes, C. S. Toth, J. Van Tilborg, E. Esarey, C. B. Schroeder, D. Bruhwiler, C. Nieter, J. Cary, and W. P. Leemans, Nature 431, 538 (2004).
- Faure et al. (2004) J. Faure, Y. Glinec, A. Pukhov, S. Kiselev, S. Gordienko, E. Lefebvre, J.-P. Rousseau, F. Burgy, and V. Malka, Nature 431, 541 (2004).
- Thomas et al. (2007) A. G. R. Thomas, Z. Najmudin, S. P. D. Mangles, C. D. Murphy, A. E. Dangor, C. Kamperidis, K. L. Lancaster, W. B. Mori, P. A. Norreys, W. Rozmus, and K. Krushelnick, Physical Review Letters 98, 095004 (2007).
- Spence and Hooker (2000) D. J. Spence and S. M. Hooker, Physical Review E 63, 015401(R) (2000).
- Lu et al. (2007) W. Lu, M. Tzoufras, C. Joshi, F. Tsung, W. Mori, J. Vieira, R. Fonseca, and L. Silva, Physical Review Special Topics - Accelerators and Beams 10, 061301 (2007).
- Decker et al. (1996) C. D. Decker, W. B. Mori, K.-C. Tzeng, and T. Katsouleas, Physics of Plasmas 3, 2047 (1996).
- Vieira et al. (2010) J. Vieira, F. Fiúza, L. O. Silva, M. Tzoufras, and W. B. Mori, New Journal of Physics 12 (2010).
- Ralph et al. (2009) J. E. Ralph, K. A. Marsh, A. E. Pak, W. Lu, C. E. Clayton, F. Fang, W. B. Mori, and C. Joshi, Physical Review Letters 102, 175003 (2009).
- Gordon et al. (2003) D. F. Gordon, B. Hafizi, R. F. Hubbard, J. R. Peñano, P. Sprangle, and A. Ting, Physical Review Letters 90, 215001 (2003).
- Faure et al. (2005) J. Faure, Y. Glinec, J. J. Santos, F. Ewald, J.-P. Rousseau, S. Kiselev, A. Pukhov, T. Hosokai, and V. Malka, Physical Review Letters 95, 205003 (2005).
- Schreiber et al. (2010) J. Schreiber, C. Bellei, S. P. D. Mangles, C. Kamperidis, S. Kneip, S. R. Nagel, C. A. J. Palmer, P. P. Rajeev, M. J. V. Streeter, and Z. Najmudin, Physical Review Letters 105, 235003 (2010).
- Kalmykov et al. (2009) S. Kalmykov, S. A. Yi, V. Khudik, and G. Shvets, Physical Review Letters 103, 135004 (2009).
- Froula et al. (2009) D. H. Froula, C. E. Clayton, T. Döppner, K. A. Marsh, C. P. J. Barty, L. Divol, R. A. Fonseca, S. H. Glenzer, C. Joshi, W. Lu, S. F. Martins, P. Michel, W. B. Mori, J. P. Palastro, B. B. Pollock, A. Pak, J. E. Ralph, J. S. Ross, C. W. Siders, L. O. Silva, and T. Wang, Physical Review Letters 103, 215006 (2009).
- Kneip et al. (2009) S. Kneip, S. R. Nagel, S. F. Martins, S. P. D. Mangles, C. Bellei, O. Chekhlov, R. J. Clarke, N. Delerue, E. J. Divall, G. Doucas, K. Ertel, F. Fiuza, R. Fonseca, P. Foster, S. J. Hawkes, C. J. Hooker, K. Krushelnick, W. B. Mori, C. A. J. Palmer, K. Ta Phuoc, P. P. Rajeev, J. Schreiber, M. J. V. Streeter, D. Urner, J. Vieira, L. O. Silva, and Z. Najmudin, Physical Review Letters 103, 035002 (2009).
- Sävert et al. (2015) A. Sävert, S. P. D. Mangles, M. Schnell, E. Siminos, J. M. Cole, M. Leier, M. Reuter, M. B. Schwab, M. Möller, K. Poder, O. Jäckel, G. G. Paulus, C. Spielmann, S. Skupin, Z. Najmudin, and M. C. Kaluza, Physical Review Letters 115, 055002 (2015).
- Bloom et al. (2017) M. S. Bloom, M. J. V. Streeter, S. Kneip, R. A. Bendoyro, O. Cheklov, J. M. Cole, A. Doepp, C. J. Hooker, J. Holloway, J. Jiang, N. C. Lopes, H. Nakamura, P. A. Norreys, P. P. Rajeev, D. R. Symes, J. Schreiber, J. C. Wood, M. Wing, Z. Najmudin, and S. P. D. Mangles, (2017), arXiv:1710.05740 .
- Hooker et al. (2006) C. J. Hooker, J. L. Collier, O. Chekhlov, R. Clarke, E. Divall, K. Ertel, B. Fell, P. Foster, S. Hancock, A. Langley, D. Neely, J. Smith, and B. Wyborn, J. Phys. IV France 133, 673 (2006).
- Trebino (2000) R. Trebino, Frequency-Resolved Optical Gating: The Measurement of Ultrashort Laser Pulses (Springer US, Boston, MA, 2000).
- Wigner (1932) E. Wigner, Physical Review 40, 749 (1932).
- Fonseca et al. (2002) R. A. Fonseca, L. O. Silva, F. S. Tsung, V. K. Decyk, W. Lu, C. Ren, W. B. Mori, S. Deng, S. Lee, T. Katsouleas, and J. C. Adam, in Computational Science — ICCS 2002 SE - 36, Lecture Notes in Computer Science, Vol. 2331, edited by P. Sloot, A. Hoekstra, C. Tan, and J. Dongarra (Springer Berlin Heidelberg, 2002) pp. 342–351.
- Lu et al. (2006) W. Lu, C. Huang, M. Zhou, W. B. Mori, and T. Katsouleas, Physical Review Letters 96, 165002 (2006).
- Schroeder et al. (2011) C. B. Schroeder, C. Benedetti, E. Esarey, and W. P. Leemans, Physical Review Letters 106, 135002 (2011).
- Bulanov et al. (1998) S. Bulanov, N. Naumova, F. Pegoraro, and J. Sakai, Physical Review E 58, R5257 (1998).
- Geddes et al. (2008) C. G. R. Geddes, K. Nakamura, G. R. Plateau, C. Toth, E. Cormier-Michel, E. Esarey, C. B. Schroeder, J. R. Cary, and W. P. Leemans, Physical Review Letters 100, 215004 (2008).
- Kneip et al. (2011) S. Kneip, C. McGuffey, J. L. Martins, S. F. Martins, C. Bellei, V. Chvykov, F. Dollar, R. Fonseca, C. Huntington, G. Kalintchenko, A. Maksimchuk, S. P. D. Mangles, T. Matsuoka, S. R. Nagel, C. A. J. Palmer, J. Schreiber, K. T. Phuoc, A. G. R. Thomas, V. Yanovsky, L. O. Silva, K. Krushelnick, and Z. Najmudin, Nature Physics 7, 737 (2011).
- Sarri et al. (2014) G. Sarri, D. J. Corvan, W. Schumaker, J. M. Cole, A. Di Piazza, H. Ahmed, C. Harvey, C. H. Keitel, K. Krushelnick, S. P. D. Mangles, Z. Najmudin, D. Symes, A. G. R. Thomas, M. Yeung, Z. Zhao, and M. Zepf, Physical Review Letters 113, 224801 (2014).
- Sarri et al. (2015) G. Sarri, K. Poder, J. M. Cole, W. Schumaker, A. Di Piazza, B. Reville, T. Dzelzainis, D. Doria, L. A. Gizzi, G. Grittani, S. Kar, C. H. Keitel, K. Krushelnick, S. Kuschel, S. P. D. Mangles, Z. Najmudin, N. Shukla, L. O. Silva, D. Symes, A. G. R. Thomas, M. Vargas, J. Vieira, and M. Zepf, Nature Communications 6, 6747 (2015).