URL: ] http://porousmaterials.net
Gassmann Theory Applies to Nanoporous Media
Abstract
Recent progress in extraction of unconventional hydrocarbon resources has ignited the interest in the studies of nanoporous media. Since many thermodynamic and mechanical properties of nanoscale solids and fluids differ from the analogous bulk materials, it is not obvious whether wave propagation in nanoporous media can be described using the same framework as in macroporous media. Here we test the validity of Gassmann equation using two published sets of ultrasonic measurements for a model nanoporous medium, Vycor glass, saturated with two different fluids, argon and n-hexane. Predictions of the Gassmann theory depend on the bulk and shear moduli of the dry samples, which are known from ultrasonic measurements, and the bulk moduli of the solid and fluid constituents. The solid bulk modulus can be estimated from adsorption-induced deformation or from elastic effective medium theory. The fluid modulus can be calculated according to the Tait-Murnaghan equation at the solvation pressure in the pore. Substitution of these parameters into the Gassmann equation provides predictions consistent with measured data. Our findings set up a theoretical framework for investigation of fluid-saturated nanoporous media using ultrasonic elastic wave propagation.
Keypoints:
-
•
Bulk modulus of solid fraction can be calculated from adsorption-induced deformation
-
•
Compressibility of confined fluid can be obtained from Tait-Murnaghan equation at solvation pressure
-
•
Gassmann equation with the resulting moduli applies to ultrasound propagation in nanoporous media
Note: this is a preprint, the final version is published in Geophys. Res. Lett. and available at http://dx.doi.org/10.1002/2017GL075321
I Introduction
The last decade has seen enormous progress in production of hydrocarbons from unconventional reservoirs such as hydrocarbon-bearing shales and coal seams. Yet the spread of the technology worldwide and further gains in efficiency require application of geophysical reservoir characterization methods, which so far have been relatively ineffective in estimating spatial distribution of relevant formation properties. Application of geophysical methods to unconventional reservoirs requires thorough understanding of physical properties of these formations. While there have been significant advances in both experimental and theoretical rock physics of unconventional reservoirs (e.g., recent review by Pervukhina et al. (2015)), some fundamental questions are still poorly understood. In particular, it is not known whether the Gassmann theory, which plays a central role in seismic characterization of conventional reservoirs (Smith et al., 2003), applies to nanoporous materials (Following the most recent IUPAC convention we call here “nanoporous materials”, those materials that have the pore sizes below 100 nm Thommes et al. (2015)). Indeed, both shales and coal seams are known to have a nano-scale structure. Many mechanical and thermodynamic properties of nano-scale solids and fluids differ from the bulk properties of the same materials (Nastasi et al., 2012; Huber, 2015). Therefore, applicability of conventional rock physics theories such as the Gassmann theory (Gassmann, 1951) to these materials is uncertain. As an amusing example, a debate at a workshop on rock physics of unconventional reservoirs held by the Society of Exploration Geophysicists (Denver, Colorado, October 2014) led to a vote of the attendees on whether they believe the Gassmann theory is applicable to shales; and the opinions of the attendees were evenly split.
Testing the Gassmann theory experimentally on unconventional reservoir rocks is challenging for a number of reasons. First, direct replacement of fluids in such a complex system would trigger a number of physicochemical processes, some of which may be irreversible (Rezaee, 2015). Second, some of the key minerals in shales (e.g. clays) only exist as nano-scale particles and their mechanical properties are a subject of long lasting debates (Vanorio et al., 2003; Mondol et al., 2008). Third, these minerals are strongly anisotropic (Sayers and den Boer, 2016), and hence require the use of an anisotropic version of the Gassmann theory (Brown and Korringa, 1975), which involves a greater number of parameters. Therefore, as a first step towards resolving this question, it is useful to study simplified model systems, such as nanoporous glass. This has been done by Page et al. (1995) and Schappert and Pelster (2014), who measured longitudinal and shear ultrasonic velocities in nanoporous Vycor glass as a function of pressure of n-hexane and argon vapors respectively. Both studies show that when the vapor pressure reaches a capillary condensation point, the longitudinal modulus of the sample increases sharply and this increase is in a broad agreement with the Gassmann theory. However, quantitative testing of the Gassmann theory on Vycor glass requires the knowledge of the bulk modulus of the solid nonporous glass , which cannot be measured directly.
In this paper we propose to estimate from the so-called pore-load modulus obtained from measurements of the adsorption-induced deformation. Furthermore, comparison of this estimate with the estimates from the elastic effective medium theory gives a recipe for estimating when adsorption-induced deformation data are not available. We then substitute the estimated values of along with the longitudinal modulus of the dry porous glass and the fluid compressibility into the Gassmann equation to compute the saturated (undrained) longitudinal modulus of the porous glass filled with liquid argon or n-hexane. Finally we verify the validity of the Gassmann theory by comparing these predictions against the ultrasonic measurements of Page et al. (1995) and Schappert and Pelster (2014).
II Gassmann Model
We consider a porous solid with porosity , which can be saturated with a fluid. We introduce the following elastic properties to describe it: is the longitudinal modulus, is the shear modulus and is the bulk modulus. All these moduli correspond to adiabatic conditions.
In the low-frequency limit, the bulk modulus of the fluid-saturated medium is related to its dry bulk modulus , solid modulus and fluid modulus by the Gassmann (1951) equation (see also (Berryman, 1999))
| (1) |
while the shear modulus of the saturated sample equals to the that of the dry material ,
| (2) |
The values without subscripts are the properties of the composite (saturated porous body), the values with the subscript “” correspond to the dry (drained) porous body, the superscripts “” and “” denote the properties of the solid non-porous material and fluid, respectively. Since the experimentally measured quantity is the longitudinal modulus of the composite, it is convenient to rewrite Eq. 1 as
| (3) |
Computing the longitudinal modulus of the saturated samples using Eq. 3 requires the knowledge of the porosity of the material , moduli of the dry sample and (which can be readily calculated from the travel times of the longitudinal and transversal waves), fluid modulus (usually known at the current pressure and temperature (Batzle and Wang, 1992; Smith et al., 2003)), and measured solid modulus . However, estimation of the solid modulus (often called mineral or matrix modulus) is often a non-trivial problem. For multi-mineral rocks, this requires the use of an approximate elastic effective medium theory (EMT) (Smith et al., 2003). The problem is even more challenging when the nature of the material precludes the existence of macroscopic non-porous samples that could be measured directly. This is the situation with shales or mudrocks as clay minerals usually exist as nano-scale particles (Vanorio et al., 2003; Mondol et al., 2008). Similarly, the technology for producing the Vycor glass makes it porous, and use of the conventional (nonporous) glass properties to describe Vycor’s solid fraction is problematic, as these properties strongly depend on the glass’s thermal history (Scherer, 1986). However there exists a potential to estimate this modulus from adsorption-induced deformation experiments (Gor et al., 2017). This approach is described in the next section.
III Methods
III.1 Adsorption Experiments on Vycor Glass
The analysis of the applicability of the Gassmann theory will be based on ultrasonic measurements carried out during adsorption experiments on a model nanoporous system, Vycor glass. Vycor is a high-silica borosilicate glass, with porosity around 30%, which has pores with disordered worm-like structure, 6-8 nanometers in diameter. The left panel of Figure 1 shows the structure of Vycor based on a combination of experimental characterization techniques (Levitz et al., 1991). Vycor has high porosity and narrow pore size distribution; these features made it widely used as a medium for studying confinement effects for various solid and fluid phases (Schappert et al., 2015, 2016; Gruener et al., 2016; Uskov et al., 2016; Soprunyuk et al., 2016; Filippov et al., 2016; Egorov et al., 2017). Note also that combination of various experimental methods used to calculate the porosity of Vycor suggests that Vycor does not have isolated (occluded) porosity (Levitz et al., 1991; Page et al., 1995).
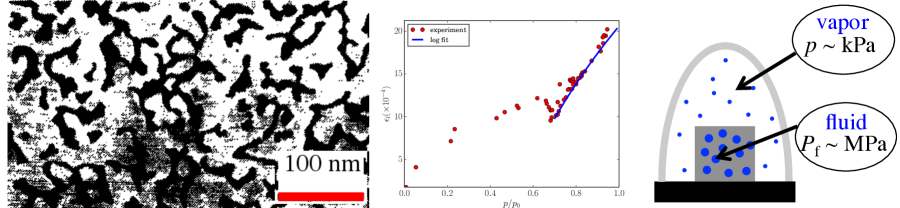
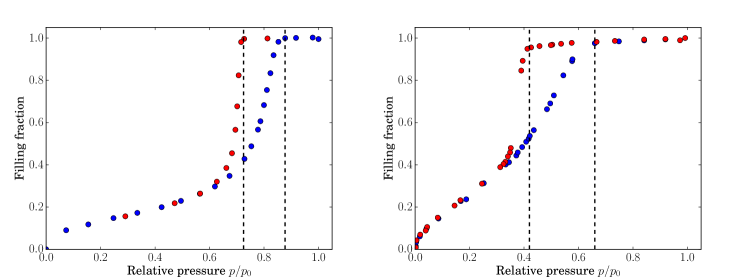
Starting from the 1980s, several groups used Vycor for ultrasonic investigation of nanoconfined fluids and solids (Murphy, 1982; Beamish et al., 1983; Warner and Beamish, 1988; Page et al., 1995; Charnaya et al., 2001; Schappert and Pelster, 2014). We discuss here the experiments in which the pores in Vycor are filled with fluids. In these experiments a dry sample is gradually saturated by means of vapor adsorption at a constant temperature (schematic of such experiments is shown in the right panel of Figure 1). Vapor adsorption in a mesoporous material takes place as the following: at low vapor pressures , the fluid adsorbs as a liquid-like film on the pore walls surface and the thickness of this film gradually grows with the increase of the vapor pressure. After a certain pressure value, , which is lower than the saturated vapor pressure , capillary condensation takes place and the entire pore gets filled with the condensate. Here we consider only the part of the experimental data beyond the capillary condensation, where the system probed by ultrasound consists of only two phases: solid matrix and nanoconfined liquid-like fluid in the pores. If in an adsorption experiment the vapor pressure is decreased from the saturated state, the pores will empty at a certain pressure . Typically and the adsorption isotherms have a hysteresis loop as in Figure 2.
For our analysis we use published data from (Page et al., 1995) and (Schappert and Pelster, 2014). The former is concerned with n-hexane adsorption at room temperature ( K) and the latter uses argon at K. The adsorption isotherms from these works are shown in Figure 2. The vertical dashed lines show the capillary condensation and evaporation points.
III.2 Solid Bulk Modulus of Nanoporous Glass
As mentioned earlier, the Gassmann equation, Eq. 1, requires the knowledge of the solid modulus , which cannot be measured directly, but can be estimated using the following approach. When fluids saturate nanoporous solids they cause noticeable strains, typically of the order of . This phenomenon is known as adsorption-induced deformation and is well documented in the literature (see the review (Gor et al., 2017) and references therein). Adsorption-induced deformation is notorious for causing coal swelling and shrinkage in enhanced coal-bed methane recovery (Yang et al., 2011; Espinoza et al., 2013; Zhang et al., 2016).
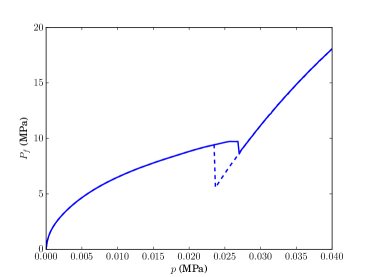
The fluid pressure in the pores , which is the driving force for the strain, is called “solvation pressure” or “adsorption stress”. Typically in sub-critical adsorption experiments, solvation pressure exceeds the external (vapor) pressure by several orders of magnitude (Gor and Neimark, 2010) (see Figure 1). Thus the difference between the adsorption stress and solvation pressure is negligible. For mesoporous materials, i.e when pores are in the range of nm (Thommes et al., 2015), the solvation pressure in the pores filled with capillary condensate can be written in macroscopic terms as (Gor and Neimark, 2010; Gor, 2014)
| (4) |
where the first term is related to solid-fluid interactions and the second term is the Laplace pressure
| (5) |
Here is the gas constant, is the absolute temperature and is the molar volume of the liquid phase. Note that while the first term in Eq. 4 is compressive, the second term causes the tensile stresses when the system is in equilibrium with undersaturated vapor at ; at the Laplace pressure term vanishes.
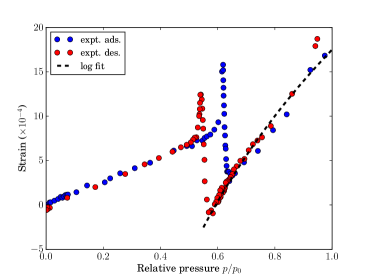
For a given sample saturated with a fluid, the , so Eq. 5 gives the simple logarithmic dependence of linear strain of the porous sample on , shown in Figure 1 and observed for all mesoporous materials (Gor et al., 2017). This dependence is often described using a special elastic modulus related to this process, so-called “pore-load modulus” (Prass et al., 2009; Gor et al., 2015a) as a proportionality constant in the linear relation between the solvation pressure and measured . can be related to elastic moduli using Biot’s theory of poroelasticity. According to Biot’s theory, the volumetric strain is a function of hydrostatic effective stress (compressive stresses are assumed positive) (Nur and Byerlee, 1971; Rice and Cleary, 1976; Berryman, 1993; Detournay and Cheng, 1993)
| (6) |
where is confining pressure, is the fluid pressure in the pores, and is the Biot-Willis effective stress coefficient. For a porous material made up of a single isotropic solid substance with bulk modulus ,
| (7) |
where is the drained bulk modulus
| (8) |
Similarly, the pore load modulus can be written as
| (9) |
where we took into account that the strains are small so that the volumetric strain .
Since the confining pressure is the vapor pressure in the adsorption experiment atm, it can be assumed zero, therefore
| (10) |
Then, using Eqs 4, 6, 10 and 9, Eq. 8 gives
| (11) |
or
| (12) |
so that
| (13) |
When and are known from measurements, then Eq. 13 can be used to estimate . This equation was derived by Mackenzie (1950) for spherical pores, but the above derivation shows that it is valid for any pore geometry as long as all the pores are inter-connected.
The advantage of estimating in this way is that it is independent of pore geometry and does not require the knowledge of porosity or pore fluid properties. Alternatively can be estimated from porosity , bulk and shear moduli of the dry sample and using the EMT (Kuster and Toksöz, 1974; Berryman, 1980) and assuming that the pores are approximately cylindrical in shape. The details of this calculation are given in Supporting Information. It might also be possible to estimate the solid bulk modulus from forced confining and pore fluid pressure oscillation measurements (Pimienta et al., 2017). However for nanoporous media this may be problematic. Indeed, this would need to be done with a non-sorbing fluid, and sorption is an inherent feature of nanopores for almost any fluid.
III.3 Bulk Modulus of the Fluid in the Pores
For macroporous media Eq 3 can be used assuming the properties of solid and liquid constituents being the same as the bulk properties at the same temperature and pressure. In particular, the bulk modulus of the liquid in the pores can be taken from the reference thermodynamic data for a given fluid. However, nanoconfinement is known to alter thermodynamic properties of fluids (Huber, 2015). In particular the fluid in the nanopores is at a pressure different from the pressure of the equilibrium bulk phase (Figure SI.1 in the Supporting Information shows the plot of as a function of for argon in model Vycor pores). Therefore, the effects of the nanoconfinement are manifested in the pressure dependence of these thermodynamic properties. The pressure dependence of the bulk modulus of a bulk liquid is described by a classical Tait-Murnaghan equation (Murnaghan, 1944; Birch, 1952)
| (14) |
where , which is constant for a given liquid in a wide range of pressures. Recent molecular simulations for simple fluids show that the Tait-Murnaghan equation remains valid when the fluids are confined in the nanopores (Gor, 2014; Gor et al., 2015b; Keshavarzi et al., 2016). Moreover, the “slope” in Eq. 14 for confined argon is the same as for bulk, (Gor et al., 2016), and the latter can be readily calculated from reference thermodynamic data. Therefore, knowing the solvation pressure from macroscopic or molecular theories of adsorption (Gor and Neimark, 2011), one can calculate the modulus of the confined fluid in the pores from Eq. 14.
IV Results
To test our method we consider ultrasonic experiments carried out during adsorption of vapors on Vycor samples.
IV.1 Properties of Vycor Samples
IV.1.1 Sample from Schappert and Pelster (2014)
Schappert and Pelster (2014) used Vycor glass No. 7930. The same type of glass was also used by Amberg and McIntosh (1952) to measure deformation induced by adsorption of water. These data are plotted in Figure 1 and can be used to estimate the solid bulk modulus of Vycor. The -fitting for the system shown in Figure 1 gives pore-load modulus GPa. The drained bulk modulus measured by Schappert and Pelster (2014) is GPa. Substitution of these values into Eq. 13 gives GPa.
The obtained value of for Vycor is noticeably smaller than the bulk modulus of -quartz, GPa (Anderson, 1966). It is close, however, to value GPa calculated by Scherer (1986) from the dry moduli using elastic EMT (Scherer (1986) reports the Young’s modulus GPa and Poisson’s ratio ). According to Scherer (1986), the modulus of solid Vycor matrix is lower than for quartz due to the presence of large amount of hydroxyls. When the sample is heated to 550-800∘C, the glass gets dehydroxylated, and the modulus approaches the quartz values.
In addition to the bulk modulus , Schappert and Pelster (2014) report the shear modulus of the dry sample, GPa. Using these values of and , and porosity , and assuming that the pores are infinite circular cylinders, we can estimate the moduli based on the EMT, getting GPa and GPa. The details of this estimation are given in Supporting Information.
The value obtained from the effective stress is independent of porosity, pore geometry and fluid compressibility. However, it is sensitive to , which is estimated from the adsorption-induced deformation measured on a different sample. The solid bulk modulus obtained from the effective stress law is times greater than for a solid with cylindrical pores. This can be interpreted as an indication that pores in Vycor glass are slightly “softer” than straight circular cylinders. Since both poroelasticity and EMT methods have sources of uncertainty, we assume that these two estimates provide a likely range of values.
IV.1.2 Sample from Page et al. (1995)
The Vycor glass sample studied by Page et al. (1995) has slightly higher porosity () and at the same time a higher dry bulk modulus ( GPa) than used by Schappert and Pelster (2014), and hence considerably higher solid bulk modulus. There are no adsorption-induced deformation data for this sample, but EMT with cylindrical pores gives GPa. Assuming that the pore geometry of the Page et al. (1995) samples is similar to that in Vycor 7930, we can multiply the EMT estimate for their sample by the factor to give GPa.
IV.2 Comparison of Gassmann Theory with Experimental Data
IV.2.1 Constant fluid modulus
Although the calculation of the fluid bulk modulus is more straightforward than the solid modulus , it is a key component of the proposed method. Indeed, if we substitute the bulk modulus of bulk fluid at the pressure of the vapor phase into Gassmann equation 3, the result would be almost the same as for dry sample, in variance to the laboratory measurements. This suggests that the the value of needs to be corrected.
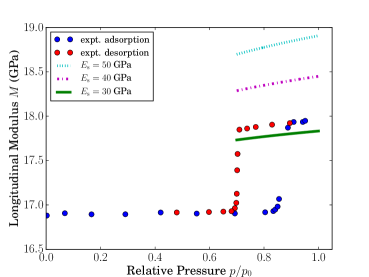
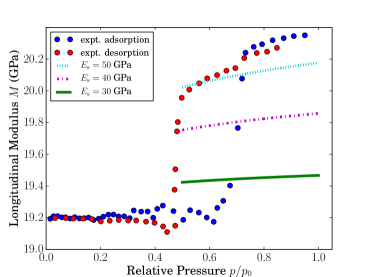
Since above the capillary condensation points the fluids in the nanopores are in liquid-like form, we use the corresponding values for liquids. Hence we use GPa for argon at K (Gor et al., 2015b). Bulk argon freezes at K, and can stay liquid at K only when confined; therefore the properties for liquid argon are taken at saturation at higher temperatures and extrapolated to K (Gor, 2014). For n-hexane at K at saturation we take GPa, following (Page et al., 1995); this value is consistent with the more recent high-quality measurements (Daridon et al., 1998).
Two panels of Figure 3 show the longitudinal moduli calculated from measurements of both wave propagation velocities and mass density as functions of relative pressure for the two considered systems. The markers show the experimental data and the black horizontal lines show the results of calculations using Eq 3 with the bulk value for the fluid moduli. The resulting numbers are close to the experimental data, but the predictions do not capture the observed variation of the saturated modulus with vapor pressure .
IV.2.2 Pressure-dependent fluid modulus
The dependence of the saturated modulus on the vapor pressure (above the capillary condensation point) can be modeled by taking into account the effect of the solvation pressure on the bulk modulus of the confined fluid (Gor, 2014; Gor et al., 2016). We use Tait-Murnaghan equation (Eq. 14) with the parameter (Gor et al., 2016). The calculations in (Gor et al., 2016) were done for isothermal modulus, therefore , where is the heat capacities ratio (Gor, 2014). The Laplace pressure is readily calculated using Eq. 5 and the solid-fluid part of solvation pressure is the least trivial term. According to recent calculations (Gor, 2014), MPa for argon in 8 nm cylindrical pore at K. With these data we can calculate the modulus of the fluid as a function of and substitute it into Gassmann equation 3. The results are shown with the green lines in the left panel of Figure 3.
The left panel of Figure 3 also shows values of the shear modulus measured by Schappert and Pelster (2014). These data show an important experimental result revealed by these authors: saturation of nanoporous glass with fluid does not appreciably change its shear modulus. Despite several observations suggesting that nanoconfinement of fluids causes an appearance of shear modulus (Granick, 1991), we see that for argon in 8 nm pores these effects are small, which justifies extrapolation of liquid properties to nanoconfined argon. Furthermore, this result is consistent with the Gassmann theory (Eq. 2).
Similar analysis of the n-hexane data requires the values of of confined n-hexane and the solid-fluid part of the solvation pressure for the hexane-Vycor system. To our knowledge, none of these quantities have been calculated. Nevertheless, based on the argon simulations (Gor et al., 2016) showing that is not affected by confinement, we can take the bulk value calculated from the n-hexane reference data (Daridon et al., 1998). Furthermore, we can estimate the solid-fluid interaction part of the solvation pressure based on the solvation pressure of n-pentane adsorbed in silica pore of comparable size (Gor et al., 2013). This estimate gives MPa (see Supporting Information). Substitution of these numbers into Gassmann Eq. 3 gives the result shown as green lines in the right panel of Figure 3. Taking into account the sensitivity of the Gassmann equation to the value, we can conclude that the resulting predictions agree with experimental data in both magnitude of the modulus and its variation with pressure. To provide an additional illustration of the sensitivity of Gassmann equation to the (or ) value, we calculated the resulting moduli for several values of this parameter from the range given by Bentz et al. (1998). These results are plotted on Figure SI.3 in Supporting Information.
To summarize, in order to use the Gassmann equation for nanoporous media the fluid properties should be corrected for the solvation pressure using the Tait-Murnaghan equation. The slope parameter can be taken from the reference (bulk) data, which is available for any common fluid. The value of solvation pressure can be estimated from the adsorption-induced deformation experiments (see Supporting Information).
V Discussion
Gassmann theory was originally derived for purely quasi-static deformations, and its use at ultrasonic frequencies may violate its key assumptions. One of these assumptions is that the average pore radius is much smaller than the viscous skin depth , where and are dynamic viscosity and density of the pore fluid respectively, is angular and circular frequency of the propagating wave (Biot, 1956a, b; Johnson et al., 1987). For n-hexane this condition has been checked by Page et al. (1995). Indeed, at normal conditions, n-hexane has a density kgm-3, and dynamic viscosity Pa s, and hence at MHz, nm, which is over an order of magnitude larger than the typical pore size in nanoporous Vycor glass. For liquid argon at 0.1 MPa and 86 K, taking MHz (Schappert and Pelster, 2014), kgm-3 and Pa s (Younglove and Hanley, 1986) gives nm, a smaller value, but still exceeding the pore diameter by an order of magnitude. Thus both experiments are in the low-frequency regime, which justifies the use of the Gassmann equations.
Another effect that can lead to deviations of ultrasonic measurements from the predictions of the Gassmann theory is associated with the assumption that fluid pressure is the same throughout the pore space (within a representative volume). If the pore space is interconnected, this condition is automatically satisfied at zero frequency (due to the Pascal law). However at ultrasonic frequencies this might not be the case as there may not be enough time for the pressure to equilibrate within half period of the wave. Unrelaxed pressure conditions may cause wave-induced fluid flow between pores (or areas of the pore space) of different compressibilities, resulting in significant velocity dispersion and deviation from the Gassmann’s low frequency predictions (Mavko and Nur, 1975; Müller et al., 2010). However, Vycor nanoporous glass appears to be a very homogeneous material, whose pores are approximately of the same worm-like shape and similar size, see Figure 1. This is also consistent with the very sharp jump of the longitudinal modulus at the capillary condensation point in both experiments seen in Figure 3. Indeed, substantial variation in the pore size would lead to a gradual increase of the modulus, as capillary condensation pressure is a function of the pore diameter. This suggests that wave-induced flow effects in Vycor should be minimal and Gassmann theory should be applicable at ultrasonic frequencies. It is also known that wave-induced flow (squirt) effect associated with the presence of microcracks causes a significant deviation not only of the bulk modulus but also of the shear modulus of the saturated material from its value for the dry material (Mavko and Jizba, 1991; Gurevich et al., 2010). Hence the fact that the shear modulus of Vycor is independent of saturation is another indirect indication that the effect of squirt in Vycor is insignificant.
In Section III.3 we introduced the pressure corrections for the modulus of the fluid, while assuming that the solid modulus does not depend on pressure. Strictly speaking, the bulk modulus of the solid constituent changes with pressure according to the Tait-Murnaghan equation, similarly to the fluid.
| (15) |
For most of the solids the , (Tables 2 and 3 in (Anderson, 1966)), which is several times smaller than for fluids. For our estimates we take the value for -quartz, which is relatively high. For the systems discussed above, the maximum pressure difference is MPa, for pressure MPa the correction term in Eq. 15 will be only GPa, and therefore could be neglected (comparing to GPa). The fact that here the solvation pressure in the pores does not cause any noticeable effect on the shear modulus of the sample (Eq. 2) also suggests that the pressure corrections for the solid moduli are insignificant.
Finally, we would like to note that although Schappert and Pelster (2014) reported the adsorption-induced deformation measurements for their Vycor sample, we intentionally did not use the pore-load modulus extracted from these experiments. First, Schappert and Pelster (2014b) themselves admit that their sample shows “unexpected sorption-induced deformation”, which has not been observed for any other mesoporous samples (Gor et al., 2017). Second, even if we extract the value of the pore-load modulus from these data, we get GPa (Gor and Bernstein, 2016). This value is smaller than and hence its substitution into Eq. 13 would give a negative value of the solid bulk modulus.
VI Conclusion
We have considered the propagation of ultrasound in fluid saturated nanoporous media within the context of classical Gassmann theory. As an example of such media we chose Vycor glass, which has well-defined channel-like pores with a narrow pore-size distribution peaking around 7-8 nm. We compared the Gassmann predictions with the two series of experimental measurements, where argon and n-hexane were used as saturating fluids. In both experiments the velocity of ultrasound propagation was measured during the vapor adsorption and the fluid adsorbed inside the pores was in liquid-like state.
Our analysis has shown that the bulk modulus of the solid (pore walls) can be calculated from experimental data on adsorption-induced deformation or estimated using the effective medium theory, giving fairly close values. Substitution of these values and the compressibility of the bulk fluid into the Gassmann equation gives the bulk moduli of the saturated sample close to the measured values. The agreement is further improved by substituting into the Gassmann equation the fluid compressibility obtained as a function of the solvation pressure using the Tait-Murnaghan equation.
Overall, we can conclude that the saturated moduli of the nanoporous glass are consistent with the predictions of the Gassmann theory. However, at this point it would be premature to use this conclusion for practical purposes, namely for analysis of ultrasound propagation in natural nanoporous materials, e.g. coal or shale. Further validation and generalization of this conclusion requires laboratory experiments for a number of well characterized solid-fluid systems.
Acknowledgements.
The data used are listed in the references, figures and Supporting Information. G. G. thanks Drs. Klaus Schappert and Rolf Pelster for multiple detailed discussions of their experimental data. B. G. thanks the sponsors of the Curtin Reservoir Geophysics Consortium for financial support, and Dr. Stas Glubokovskikh and Yongyang Sun for useful discussions.References
- Amberg and McIntosh (1952) Amberg, C. H., and R. McIntosh (1952), A study of adsorption hysteresis by means of length changes of a rod of porous glass, Can. J. Chem., 30(12), 1012 – 1032.
- Anderson (1966) Anderson, O. L. (1966), The use of ultrasonic measurements under modest pressure to estimate compression at high pressure, J. Phys. Chem. Solids, 27(3), 547–565.
- Batzle and Wang (1992) Batzle, M., and Z. Wang (1992), Seismic properties of the pore fluids, Geophysics, 57, 1396–1408.
- Beamish et al. (1983) Beamish, J. R., A. Hikata, L. Tell, and C. Elbaum (1983), Solidification and Superfluidity of He4 in Porous Vycor Glass, Phys. Rev. Lett., 50(6), 425.
- Bentz et al. (1998) Bentz, D. P., E. J. Garboczi, and D. A. Quenard (1998), Modelling drying shrinkage in reconstructed porous materials: application to porous Vycor glass, Modell. Simul. Mater. Sci. Eng., 6(3), 211.
- Berryman (1980) Berryman, J. G. (1980), Long-wavelength propagation in composite elastic media II. Ellipsoidal inclusions, J. Acoust. Soc. Am., 68(6), 1820–1831.
- Berryman (1993) Berryman, J. G. (1993), Effective-stress rules for pore-fluid transport in rocks containing two minerals, Int. J. Rock Mech. Min. Sci., 30(7), 1165–1168.
- Berryman (1999) Berryman, J. G. (1999), Origin of Gassmann’s equations, Geophysics, 64(5), 1627–1629.
- Biot (1956a) Biot, M. A. (1956a), Theory of propagation of elastic waves in a fluid-saturated porous solid. I. Low-frequency range, J. Acoust. Soc. America, 28, 168–178.
- Biot (1956b) Biot, M. A. (1956b), Theory of propagation of elastic waves in a fluid-saturated porous solid. II. Higher frequency range, J. Acoust. Soc. America, 28, 179–191.
- Birch (1952) Birch, F. (1952), Elasticity and constitution of the Earth’s interior, J. Geophys. Res., 57(2), 227–286.
- Brown and Korringa (1975) Brown, R. J. S., and J. Korringa (1975), On the dependence of the elastic properties of a porous rock on the compressibility of the pore fluid, Geophysics, 40, 608–616.
- Charnaya et al. (2001) Charnaya, E. V., P. G. Plotnikov, D. Michel, C. Tien, B. F. Borisov, I. G. Sorina, and E. I. Martynova (2001), Acoustic studies of melting and freezing for mercury embedded into Vycor glass, Physica B, 299(1), 56–63.
- Daridon et al. (1998) Daridon, J. L., B. Lagourette, and J.-P. E. Grolier (1998), Experimental measurements of the speed of sound in n-hexane from 293 to 373 K and up to 150 MPa, Int. J. Thermophys., 19(1), 145–160.
- Detournay and Cheng (1993) Detournay, E., and A.-D. Cheng (1993), Fundamentals of poroelasticity, in Analysis and Design Methods: Comprehensive Rock Engineering: Principles, Practice and Projects, pp. 113–171, Elsevier.
- Egorov et al. (2017) Egorov, V. M., Y. F. Markov, E. M. Roginskii, and E. V. Stukova (2017), Thermal effects in the vicinity of phase transition temperatures in matrix-isolated sodium nitrite NaNO2, Phys. Solid State, 59(7), 1382–1386.
- Espinoza et al. (2013) Espinoza, D. N., M. Vandamme, P. Dangla, J.-M. Pereira, and S. Vidal-Gilbert (2013), A transverse isotropic model for microporous solids: Application to coal matrix adsorption and swelling, J. Geophys. Res., B: Solid Earth, 118(12), 6113–6123.
- Filippov et al. (2016) Filippov, A., N. Azancheev, F. U. Shah, S. Glavatskih, and O. N. Antzutkin (2016), Self-diffusion of phosphonium Bis (Salicylato) Borate ionic liquid in pores of Vycor porous glass, Microporous Mesoporous Mater., 230, 128–134.
- Gassmann (1951) Gassmann, F. (1951), Über die Elastizität poröser Medien, Viertel. Naturforsch. Ges. Zürich, 96, 1–23.
- Gor (2014) Gor, G. Y. (2014), Adsorption stress changes the elasticity of liquid argon confined in a nanopore, Langmuir, 30(45), 13,564–13,569.
- Gor and Bernstein (2016) Gor, G. Y., and N. Bernstein (2016), Revisiting Bangham’s law of adsorption-induced deformation: changes of surface energy and surface stress, Phys. Chem. Chem. Phys., 18(14), 9788–9798.
- Gor and Neimark (2010) Gor, G. Y., and A. V. Neimark (2010), Adsorption-induced deformation of mesoporous solids, Langmuir, 26(16), 13,021–13,027.
- Gor and Neimark (2011) Gor, G. Y., and A. V. Neimark (2011), Adsorption-induced deformation of mesoporous solids: Macroscopic approach and density functional theory, Langmuir, 27(11), 6926–6931.
- Gor et al. (2013) Gor, G. Y., O. Paris, J. Prass, P. A. Russo, M. M. L. Ribeiro Carrott, and A. V. Neimark (2013), Adsorption of n-pentane on mesoporous silica and adsorbent deformation, Langmuir, 29(27), 8601–8608.
- Gor et al. (2015a) Gor, G. Y., L. Bertinetti, N. Bernstein, T. Hofmann, P. Fratzl, and P. Huber (2015a), Elastic response of mesoporous silicon to capillary pressures in the pores, Appl. Phys. Lett., 106, 261,901.
- Gor et al. (2015b) Gor, G. Y., D. W. Siderius, C. J. Rasmussen, W. P. Krekelberg, V. K. Shen, and N. Bernstein (2015b), Relation between pore size and the compressibility of a confined fluid, J. Chem. Phys., 143, 194,506.
- Gor et al. (2016) Gor, G. Y., D. W. Siderius, V. K. Shen, and N. Bernstein (2016), Modulus–pressure equation for confined fluids, J. Chem. Phys., 145(16), 164,505.
- Gor et al. (2017) Gor, G. Y., P. Huber, and N. Bernstein (2017), Adsorption-Induced Deformation of Nanoporous Materials – a Review, Appl. Phys. Rev., 4, 011,303.
- Granick (1991) Granick, S. (1991), Motions and relaxations of confined liquids, Science, 253(5026), 1374–1379.
- Gruener et al. (2016) Gruener, S., H. E. Hermes, B. Schillinger, S. U. Egelhaaf, and P. Huber (2016), Capillary rise dynamics of liquid hydrocarbons in mesoporous silica as explored by gravimetry, optical and neutron imaging: Nano-rheology and determination of pore size distributions from the shape of imbibition fronts, Colloids Surf., A, 496, 13–27.
- Gurevich et al. (2010) Gurevich, B., D. Makarynska, O. B. de Paula, and M. Pervukhina (2010), A simple model for squirt-flow dispersion and attenuation in fluid-saturated granular rocks, Geophysics, 75(6), N109–N120.
- Huber (2015) Huber, P. (2015), Soft matter in hard confinement: phase transition thermodynamics, structure, texture, diffusion and flow in nanoporous media (topical review), J. Phys.: Condens. Matter, 27, 103,102.
- Johnson et al. (1987) Johnson, D. L., J. Koplik, and R. Dashen (1987), Theory of dynamic permeability and tortuosity in fluid-saturated porous media, J. Fluid Mech., 176, 379–402.
- Keshavarzi et al. (2016) Keshavarzi, E., F. Namdari, and S. R. Jildani (2016), Investigation of some well known bulk fluid regularities for Lennard–Jones confined fluid in nanoslit pore, Chem. Phys., 468, 15–24.
- Kuster and Toksöz (1974) Kuster, G. T., and M. N. Toksöz (1974), Velocity and attenuation of seismic waves in two-phase media: Part I. Theoretical formulations, Geophysics, 39, 587–606.
- Levitz et al. (1991) Levitz, P., G. Ehret, S. K. Sinha, and J. M. Drake (1991), Porous Vycor glass: The microstructure as probed by electron microscopy, direct energy transfer, small-angle scattering, and molecular adsorption, J. Chem. Phys., 95(8), 6151–6161.
- Mackenzie (1950) Mackenzie, J. K. (1950), The elastic constants of a solid containing spherical holes, Proceedings of the Physical Society. Section B, 63(1), 2.
- Mavko and Jizba (1991) Mavko, G., and D. Jizba (1991), Estimating grain-scale fluid effects on velocity dispersion in rocks, Geophysics, 56(12), 1940–1949.
- Mavko and Nur (1975) Mavko, G., and A. Nur (1975), Melt squirt in the aesthenosphere, J. Geophys. Res., 80, 1444–1448.
- Mondol et al. (2008) Mondol, N. H., J. Jahren, K. Bj¯rlykke, and I. Brevik (2008), Elastic properties of clay minerals, The Leading Edge, 27(6), 758–770.
- Müller et al. (2010) Müller, T. M., B. Gurevich, and M. Lebedev (2010), Seismic wave attenuation and dispersion resulting from wave-induced flow in porous rocks – a review, Geophysics, 75(5), 75A147–75A164.
- Murnaghan (1944) Murnaghan, F. D. (1944), The compressibility of media under extreme pressures, Proc. Natl. Acad. Sci. U.S.A., 30(9), 244–247.
- Murphy (1982) Murphy, W. F. (1982), Effects of partial water saturation on attenuation in Massilon sandstone and Vycor porous glass, J. Acoust. Soc. Am., 71(6), 1458–1468.
- Nastasi et al. (2012) Nastasi, M., D. M. Parkin, and H. Gleiter (2012), Mechanical properties and deformation behavior of materials having ultra-fine microstructures, vol. 233, Springer Science & Business Media.
- Nur and Byerlee (1971) Nur, A., and J. Byerlee (1971), An exact effective stress law for elastic deformation of rock with fluids, J. Geophys. Res., 76(26), 6414–6419.
- Page et al. (1995) Page, J. H., J. Liu, B. Abeles, E. Herbolzheimer, H. W. Deckman, and D. A. Weitz (1995), Adsorption and desorption of a wetting fluid in Vycor studied by acoustic and optical techniques, Phys. Rev. E, 52(3), 2763.
- Pervukhina et al. (2015) Pervukhina, M., B. Gurevich, D. N. Dewhurst, P. Golodoniuc, and M. Lebedev (2015), Rock Physics Analysis of Shale Reservoirs, pp. 191–205, John Wiley & Sons, Inc.
- Pimienta et al. (2017) Pimienta, L., J. Fortin, and Y. Guéguen (2017), New method for measuring compressibility and poroelasticity coefficients in porous and permeable rocks, J. Geophys. Res. Solid Earth, 122(4), 2670–2689.
- Prass et al. (2009) Prass, J., D. Müter, P. Fratzl, and O. Paris (2009), Capillarity-driven deformation of ordered nanoporous silica, Appl. Phys. Lett., 95(8), 083,121.
- Rezaee (2015) Rezaee, R. (Ed.) (2015), Fundamentals of Gas Shale Reservoirs, John Wiley & Sons, Inc.
- Rice and Cleary (1976) Rice, J. R., and M. P. Cleary (1976), Some basic stress diffusion solutions for fluid-saturated elastic porous media with compressible constituents, Rev. Geophys., 14(2), 227–241.
- Sayers and den Boer (2016) Sayers, C. M., and L. D. den Boer (2016), The elastic anisotropy of clay minerals, Geophysics, 81(5), C193–C203.
- Schappert and Pelster (2014a) Schappert, K., and R. Pelster (2014a), Influence of the Laplace pressure on the elasticity of argon in nanopores, Europhys. Lett., 105(5), 56,001.
- Schappert and Pelster (2014b) Schappert, K., and R. Pelster (2014b), Unexpected sorption-induced deformation of nanoporous glass: evidence for spatial rearrangement of adsorbed argon, Langmuir, 30(46), 14,004–14,013.
- Schappert et al. (2015) Schappert, K., L. Gemmel, D. Meisberger, and R. Pelster (2015), Elasticity and phase behaviour of n-heptane and n-nonane in nanopores, Europhys. Lett., 111(5), 56,003.
- Schappert et al. (2016) Schappert, K., V. Naydenov, and R. Pelster (2016), Oxygen in nanopores: A study on the elastic behavior of its solid phases, J. Phys. Chem. C, 120(45), 25,990–25,995.
- Scherer (1986) Scherer, G. W. (1986), Dilatation of porous glass, J. Am. Ceram. Soc., 69(6), 473–480.
- Smith et al. (2003) Smith, T. M., C. H. Sondergeld, and C. S. Rai (2003), Gassmann fluid substitutions: A tutorial, Geophysics, 68(2), 430–440.
- Soprunyuk et al. (2016) Soprunyuk, V., W. Schranz, and P. Huber (2016), Dynamic mechanical analysis of supercooled water in nanoporous confinement, Europhys. Lett., 115(4), 46,001.
- Thommes et al. (2015) Thommes, M., K. Kaneko, A. V. Neimark, J. P. Olivier, F. Rodriguez-Reinoso, J. Rouquerol, and K. S. W. Sing (2015), Physisorption of gases, with special reference to the evaluation of surface area and pore size distribution (IUPAC Technical Report), Pure Appl. Chem., 87(9-10), 1051–1069.
- Uskov et al. (2016) Uskov, A. V., D. Y. Nefedov, E. V. Charnaya, J. Haase, D. Michel, Y. A. Kumzerov, A. V. Fokin, and A. S. Bugaev (2016), Polymorphism of metallic sodium under nanoconfinement, Nano Lett., 16(1), 791–794.
- Vanorio et al. (2003) Vanorio, T., M. Prasad, and A. Nur (2003), Elastic properties of dry clay mineral aggregates, suspensions and sandstones, Geophys. J. Int., 155(1), 319–326.
- Warner and Beamish (1988) Warner, K. L., and J. R. Beamish (1988), Ultrasonic measurement of the surface area of porous materials, J. Appl. Phys., 63(9), 4372–4376.
- Yang et al. (2011) Yang, K., X. Lu, Y. Lin, and A. V. Neimark (2011), Effects of CO2 adsorption on coal deformation during geological sequestration, J. Geophys. Res., B: Solid Earth, 116(B8), B08,212.
- Younglove and Hanley (1986) Younglove, B., and H. J. Hanley (1986), The viscosity and thermal conductivity coefficients of gaseous and liquid argon, J. Phys. Chem. Ref. Data, 15(4), 1323–1337.
- Zhang et al. (2016) Zhang, Y., M. Lebedev, M. Sarmadivaleh, A. Barifcani, and S. Iglauer (2016), Swelling-induced changes in coal microstructure due to supercritical CO2 injection, Geophys. Res. Lett., 43(17), 9077–9083.
Supporting Information
SI.I Solid bulk and shear moduli from the moduli of the dry porous matrix
Effective bulk and shear moduli of a solid containing randomly oriented ellipsoidal inclusions can be computed using a non-interactive single-scattering approximation of the effective medium theory (Kuster and Toksöz, 1974; Berryman, 1980). For inclusions in a shape of infinite circular cylinders (sometimes called “needles”), the corresponding equations are given in Berryman (1980), equations (23) and (24), Table 1) and reproduced more legibly in the Rock Physics Handbook (Mavko et al., 1998). For bulk and shear moduli of a solid with bulk modulus and shear modulus containing empty (dry) cylindrical inclusions of a volume fraction , these equations read
| (16) |
| (17) |
where
| (18) |
| (19) |
| (20) |
and
| (21) |
Equations 16 - 21 are typically used to compute effective dry moduli and from porosity and solid moduli and . Conversely, if the dry moduli and are known, equations 16 - 21 can be used to estimate solid moduli and . For the sample of Schappert and Pelster (2014), ( GPa, GPa), eqs 16 - 21 give GPa and GPa. For the sample of Page et al. (1995) ( GPa, GPa) eqs 16 - 21 give GPa and GPa.
Strictly speaking. the non-interactive approximation is limited to low concentration of inclusions. However, numerical calculations show that for stiff inclusions like circular cylinders this approximation gives accurate results for concentrations up to and even beyond (Berryman, 1980)
SI.II Distinction between solvation pressure and vapor pressure
The solvation pressure calculated for the argon adsorption at 80 K in cylindrical silica pore is shown in Figure 4. The solvation pressure is shown as a function of absolute argon vapor pressure , taking the saturated vapor pressure at 80 K as 0.037 MPa (extrapolating data to 80 K using the Antoine equation). Figure 4 shows that characteristic solvation pressure in this system exceeds the vapor pressure by 2-3 orders of magnitude.
SI.III Estimation of solvation pressure from the adsorption-induced deformation data
Tait-Murnaghan equation for elastic modulus of fluid requires the pressure in the fluid phase. For nano-confined fluid this pressure is referred to as “solvation pressure” and can be calculated theoretically, which is typically done using molecular modeling (e.g. the case of argon (Gor, 2014) discussed above in Section SI.II). Since solvation pressure is the driving force for the adsorption-induced deformation, it can be also estimated from an experimental strain isotherm (Gor et al., 2017). Experimental data on adsorption-induced deformation of n-hexane-Vycor system is not available, and therefore a rough estimate for the solvation pressure can be made based on the published data of n-pentane adsorption on templated mesoporous silica (Prass et al., 2012; Gor et al., 2013; Balzer et al., 2015). Although the elastic properties (pore-load modulus) of the silica materials studied in these works are significantly lower than that of Vycor, the pore sizes and surface physico-chemical properties, which determine the solvation pressure, are quite close.
Figure 5 gives the experimental data for adsorption-induced strain for n-pentane-SBA-15 system. SBA-15 silica has channel-like pores with a very narrow pore size distribution (Zhao et al., 1998); the mean pore size for the considered sample is 8.14 nm (Gor et al., 2013). Solvation pressure for the filled pores is given by Eqs 4 and 5 in the paper, which can be written as
| (22) |
It is related to the experimentally-measured strain through the pore-load modulus: . Fitting the part of the experimental curve with the logarithmic function provides both parameters for the system, the pore-load modulus GPa and the solvation pressure for a totally filled pore (when ), MPa. Note that the estimate for solvation pressure of n-pentane in a different silica material with similar pore sizes (hierarchical silica-based monoliths) gives a close value of (Balzer et al., 2015).
SI.IV Range of the Gassmann equation predictions
Since the hydrostatic moduli of the fluids considered in the current work are noticeably smaller than the moduli of the solid, the predictions of Gassmann equation are very sensitive to the values of the moduli of the solid constitutive. The literature values for the solid properties of Vycor glass (bulk modulus or Young’s modulus ) vary in a wide range (Bentz et al., 1998). In order to demonstrate the sensitivity of the results to these parameters we show the calculations for the three characteristic values of the Young’s modulus , , and GPa, which lay in the range discussed by Bentz et al. (1998), taking Poisson’s ration Scherer (1986). The results of the calculations for argon and n-hexane systems are shown in Figure 6. These results provide further confirmation of the observation described in the main text that the solid constituent of the Vycor samples used in the experiments of Schappert and Pelster (2014) and Page et al. (1995) differ in their bulk modulus. This is consistent with the observations of Bentz et al. (1998) that different Vycor samples vary in their material properties.
References
- Balzer et al. (2015) Balzer, C., R. Morak, M. Erko, C. Triantafillidis, N. Hüsing, G. Reichenauer, and O. Paris (2015), Relationship between pore structure and sorption-induced deformation in hierarchical silica-based monoliths, Z. Phys. Chem., 229(7-8), 1189–1209.
- Bentz et al. (1998) Bentz, D. P., E. J. Garboczi, and D. A. Quenard (1998), Modelling drying shrinkage in reconstructed porous materials: application to porous Vycor glass, Modell. Simul. Mater. Sci. Eng., 6(3), 211.
- Berryman (1980) Berryman, J. G. (1980), Long-wavelength propagation in composite elastic media II. Ellipsoidal inclusions, J. Acoust. Soc. Am., 68(6), 1820–1831.
- Gor (2014) Gor, G. Y. (2014), Adsorption stress changes the elasticity of liquid argon confined in a nanopore, Langmuir, 30(45), 13,564–13,569.
- Gor and Neimark (2011) Gor, G. Y., and A. V. Neimark (2011), Adsorption-induced deformation of mesoporous solids: Macroscopic approach and density functional theory, Langmuir, 27(11), 6926–6931.
- Gor et al. (2013) Gor, G. Y., O. Paris, J. Prass, P. A. Russo, M. M. L. Ribeiro Carrott, and A. V. Neimark (2013), Adsorption of n-pentane on mesoporous silica and adsorbent deformation, Langmuir, 29(27), 8601–8608.
- Gor et al. (2017) Gor, G. Y., P. Huber, and N. Bernstein (2017), Adsorption-Induced Deformation of Nanoporous Materials – a Review, Appl. Phys. Rev., 4, 011,303.
- Kuster and Toksöz (1974) Kuster, G. T., and M. N. Toksöz (1974), Velocity and attenuation of seismic waves in two-phase media: Part I. Theoretical formulations, Geophysics, 39, 587–606.
- Mavko et al. (1998) Mavko, G., T. Mukerji, and J. Dvorkin (1998), The Rock Physics Handbook: Tools for Seismic Analysis in Porous Media, Cambridge University Press.
- Page et al. (1995) Page, J. H., J. Liu, B. Abeles, E. Herbolzheimer, H. W. Deckman, and D. A. Weitz (1995), Adsorption and desorption of a wetting fluid in Vycor studied by acoustic and optical techniques, Phys. Rev. E, 52(3), 2763.
- Prass et al. (2012) Prass, J., D. Müter, M. Erko, and O. Paris (2012), Apparent lattice expansion in ordered nanoporous silica during capillary condensation of fluids, J. Appl. Crystallogr., 45, 798–806.
- Ravikovitch and Neimark (2006) Ravikovitch, P. I., and A. V. Neimark (2006), Density functional theory model of adsorption on amorphous and microporous silica materials, Langmuir, 22(26), 11,171–11,179.
- Schappert and Pelster (2014) Schappert, K., and R. Pelster (2014), Influence of the Laplace pressure on the elasticity of argon in nanopores, Europhys. Lett., 105(5), 56,001.
- Scherer (1986) Scherer, G. W. (1986), Dilatation of porous glass, J. Am. Ceram. Soc., 69(6), 473–480.
- Zhao et al. (1998) Zhao, D., J. Feng, Q. Huo, N. Melosh, G. H. Fredrickson, B. F. Chmelka, and G. D. Stucky (1998), Triblock copolymer syntheses of mesoporous silica with periodic 50 to 300 angstrom pores, Science, 279(5350), 548–552.