Inversion of the decay of the cyclotron line energy in Her X-1
Recent observations of Her X-1 with NuSTAR and INTEGRAL in 2016 have provided evidence that the 20-year decay of the cyclotron line energy found between 1996 and 2015 has ended and that an inversion with a new increase, possibly similar to the one observed around 1990–1993, has started. We consider this a strong motivation for further observations and for enhanced efforts to significantly improve our theoretical understanding of the accretion process in binary X-ray pulsars. We speculate about the physics behind the long-term decay and its inversion, a possible cyclic behavior, and correlations with other variable observables.
Key Words.:
magnetic fields, neutron stars, – radiation mechanisms, cyclotron scattering features – accretion, accretion columns – binaries: eclipsing – stars: Her~X-1 – X-rays: general – X-rays: stars1 Introduction
The X-ray spectrum of the accreting binary pulsar Her X-1 is characterized by a power law continuum with exponential cutoff and an apparent line-like feature, which was discovered in 1975 (Trümper et al., 1978). This feature is now generally accepted as an absorption feature around 40 keV due to resonant scattering of photons off electrons on quantized energy levels (Landau levels) in the teragauss magnetic field at the polar cap of the neutron star. The feature is therefore often referred to as a cyclotron resonant scattering feature (CRSF). The energy spacing between the Landau levels is given by , where is the strength of the magnetic field in units of , providing a direct method of measuring the magnetic field strength at the site of the emission of the X-ray spectrum. The observed line energy is subject to gravitational redshift, , such that the magnetic field may be estimated by . The discovery of the cyclotron feature in the spectrum of Her X-1 provided the first ever direct measurement of the magnetic field strength of a neutron star, in the sense that no other model assumptions are needed. Originally considered an exception, cyclotron features are now known to be rather common in accreting X-ray pulsars; binary pulsars are now known to be cyclotron line sources. In several objects, multiple lines (up to four harmonics) have been detected (for reviews, see: Coburn et al. 2002; Staubert 2003; Heindl et al. 2004; Terada et al. 2007; Wilms 2012; Caballero & Wilms 2012; Revnivtsev & Mereghetti 2016).
| Observation | 35 d | Center | Obs. Line | max. Flux |
|---|---|---|---|---|
| month/year | cycle | MJD | Energy [keV] | [ASM-cts/s] |
| NuSTAR | ||||
| 21 Aug 2016 | 468 | 57621 | ||
| INTEGRAL | ||||
| 03–04 Apr 2016 | 464 | 57481 | ||
| 19–21 Aug 2016 | 468 | 57621 |
The Her X-1/HZ Her binary system shows strong variability on very different timescales: there is the 1.24 s spin period of the neutron star, the 1.7 d binary period, the 35 d flux modulation, and the 1.65 d period of the pre-eclipse dips. The 35 d On-Off variation can be understood as being due to the precession of a warped accretion disk. Due to the high inclination of the binary () we see the disk nearly edge-on. The precessing warped disk therefore covers the central X-ray source during a substantial portion of the 35 d period. Furthermore, a hot X-ray heated accretion disk corona reduces the X-ray signal (energy independently) by Compton scattering whenever it intercepts our line of sight to the neutron star. As a result, the X-ray source is covered twice during a 35 d cycle. A further modulation appears through the so-called Anomalous Lows (ALs) that reduce the X-ray flux to unobservable levels for time periods ranging from days to years (see Table 2 for a summary of information about the ALs to date). The ALs are probably caused by a low inclination of the accretion disk, possibly combined with a thickening of the inner part of the accretion disk, thereby shading the X-ray emitting regions at the poles of the neutron star. The ALs tend to appear on a quasi-period of 5.5 yr if we assume that two out of seven ALs were actually not realized (at least not observed).
The centroid energy of the CRSF in Her X-1 is variable with respect to several parameters, namely pulse phase, luminosity, time, and possibly a 35 d phase (Staubert et al., 2014). Apart from the discovery of the first CRSF ever, Her X-1 (through repeated observations) has allowed the first discovery of two additional features with respect to its CRSF, both of which have in the meantime been observed in other binary X-ray pulsars. First, a positive correlation between and the X-ray luminosity (Staubert et al., 2007) (confirmed on short timescales by the pulse-amplitude-resolved technique by Klochkov et al. 2011), and second, a long-term decay of , co-existing with the luminosity dependence (Staubert et al., 2014, 2016). The long-term decay was confirmed by Klochkov et al. (2015) using monitoring data of Swift/BAT (even without taking the luminosity dependence into account).
In addition to Her X-1, the following four objects are known to show such a positive correlation: A0535+26 (Klochkov et al., 2011; Sartore et al., 2015), Vela X-1 (Fürst et al., 2014), GX 3041 (Rothschild et al., 2016), and Cep X-4 (Vybornov et al., 2017). A possible additional source is V0332+53 at low luminosity towards the end of an outburst (Doroshenko et al., 2016). At very high luminosity, this object is a good example of a negative – correlation (Mowlavi et al., 2006; Tsygankov et al., 2010; Cusumano et al., 2016; Doroshenko et al., 2016). With regard to the long-term variation in , there are now three additional candidates: a decay in Vela X-1 (La Parola et al., 2016), a decay in V0332+53 during an outburst (Cusumano et al., 2016; Doroshenko et al., 2016), and a possible increase in 4U 1538522 (Hemphill et al., 2016).
In this Letter we present the results of new observations of Her X-1 in 2016 of the energy of the cyclotron resonance scattering feature in the pulse averaged X-ray spectrum of Her X-1: the CRSF energy has apparently stopped its 20-year decay and has started to increase again.
2 Observations
In 2016 Her X-1 was observed by INTEGRAL and NuSTAR, as summarized in Table 1. All observations were close to the maximum flux of a Main-On state (at 35 d phases ). The observations around 2016 August 21 were coordinated between NuSTAR and INTEGRAL and are partly simultaneous. The exposure time of NuSTAR was 37 ks. The details of the data analysis are similar to those described by Staubert et al. (2014) and Staubert et al. (2016). We used the standard nupipeline and nuproducts utilities and XSPEC111https://heasarc.gsfc.nasa.gov/xanadu/xspec/ v12.9 as part of HEASOFT222http://heasarc.nasa.gov/lheasoft/ 6.18. The INTEGRAL observations of 100 ks each were performed in Revolutions 1663 and 1715. Using the current version of the Off-line Science Analysis (OSA) 10.2333http://www.isdc.unige.ch/integral/analysis, we were not able to arrive at reliable spectral results with the data from IBIS because of very large uncertainties in the response and energy calibration.444The hope is that the IBIS data can be used later, after the release of version 11 of the OSA (expected at the end of 2017). The two data points shown in Fig. 1 are therefore from SPI (see also Ferrigno et al. 2016), screened and reduced according to procedures described by Churazov et al. (2011).
3 Results and discussion
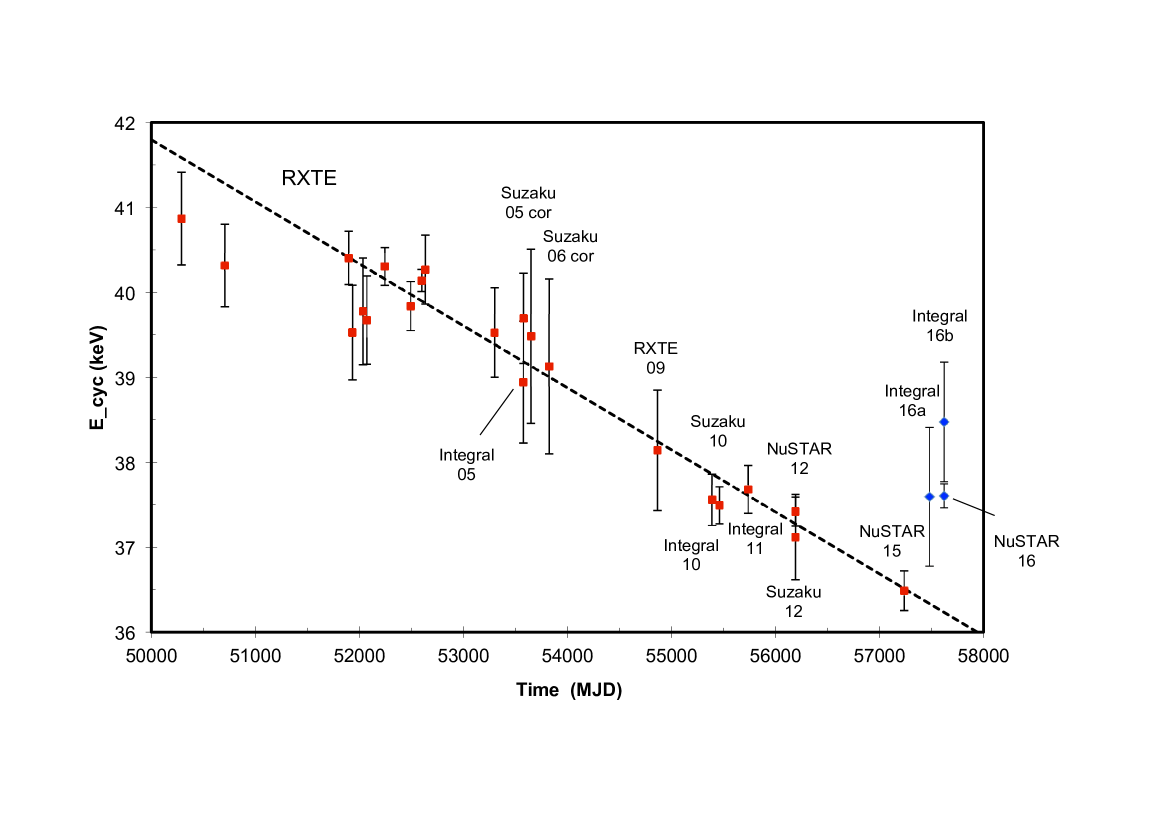
Figure 1 displays the evolution of the CRSF centroid energy of Her X-1 from 1996 to 2016, including the data points (in blue) of the new observations. All other data points (in red) and the linear best fit to the data of 1996–2015 (dashed line) are reproduced from Fig. 2 of Staubert et al. (2016). We point out that in this plot all data points are flux corrected. This is necessary because is dependent on time and on flux (or luminosity). Staubert et al. (2016) have described in detail how the two dependencies can be separated by a simultaneous fit (in time and flux). The new data points are also flux corrected by using the same dependence as before. There is no reason to assume that the flux dependence has changed (all existing data are reasonably consistent with one dependence, as demonstrated in Fig. 3 of Staubert et al. 2016). We note, however, that even if this dependence had changed somewhat, the resulting uncertainty would be negligible, since the flux correction for the new data is very small: from a count rate of 6.09 ASM-cts (see Table 1) to the reference count rate of 6.80.
It is believed that the variation in with pulse phase is due to the changing viewing angle under which the emission regions are seen (Schönherr et al., 2007). The dependence on luminosity (on both long and short timescales) could be due to a change in the height of the emission region above the neutron star surface. Within the concept of different “accretion regimes” (e.g., Becker et al., 2012), the negative / correlation in supercritical accretion (, as in, e.g., V0332+53) is due to the movement of a radiation dominated shock (and the primary emission region) to larger distances from the neutron star surface (i.e., to a weaker -field), when the accretion rate increases. The opposite is expected to happen at subcritical accretion rates. Staubert et al. (2007) have shown that a positive correlation is actually expected in the case of lower accretion rates. Under this condition, the dynamical pressure of the in-falling material reduces the height of the emission region when the accretion rate increases, leading to an increase in , as was also found by Becker et al. (2012). Recently, a model involving a collisonless shock was developed that also explains the deviation from a pure linear dependence (a “roll-off”), as observed in GX 3041 (Rothschild et al., 2017; Vybornov et al., 2017).
From Fig. 1 it is apparent that the 20-year decay of does not continue after 2015; instead, an inversion has happened. By comparing only the last two (flux corrected) data points from NuSTAR of 2015 and 2016 the significance of the turn-up is found to be 4 standard deviations. If the 2016 NuSTAR point is compared to the value expected at this time for a continued linear decay, the separation of the observed value from the dashed line is significant to 8 standard deviations. Using the last three NuSTAR points, the decrease of that was seen between 2012 and 2015 has changed to an increase of between 2015 and 2016. We note that the rate of increase is three to five times faster than that of the last decrease. Even though the uncertainties of the two INTEGRAL/SPI data points are significantly larger, we still consider that these points support a real turn-up. In addition, the fact that the 2016 data point from NuSTAR does not fit into the previous picture is evident if it is time corrected (using the same time dependence as before); plotted into Fig. 3 of Staubert et al. (2016), it would sit at 6.09 ASM-cts and = keV, which is above the best fit central line in this plot.
Because a further increase in might be expected, it seems important to observe Her X-1 over again at short intervals. The new increase could be similar to that observed during the period 1990–1993 (see Gruber et al., 2001; Staubert et al., 2014), which is rather fast. Even though the earlier increase was not well covered by observations, this jump of keV over years suggests a rate around , which is very similar to the rate found for the onset of the current increase.
The long-term decay of was securely established when a model for the simultaneous dependence on luminosity and on time was applied to the existing data of 1996–2015 (Staubert et al., 2016). The overall drop over 20 years amounts to 5 keV, or 13%.555The slight flux reduction of 15% between 1996 and 2016 (Staubert et al., 2016) contributes only 0.4 keV when the derived flux dependence of is applied. The lowest value reached recently is 37 keV, which is similar to the value measured at the time of the discovery of the line in 1975 and for several years thereafter. This may not be a chance coincidence, but could have a physical meaning. Under the assumption of a continued decay, Staubert (2014) speculated that a new turn-up might be expected once reached a “bottom” value comparable to the one before the 1990–1993 turn-up. It seems that this speculation has now come true. It was further speculated that the observed behavior – a rather fast rise followed by a decay over tens of years – might possibly be a cyclic behavior that could be understood in the framework of a physical scenario, the basics of which were outlined by Staubert et al. (2014), Staubert (2014), and Staubert et al. (2016), and are partly repeated here.
With regard to the long-term decay of we think that it is either a geometric displacement of the emission region (away from the neutron star surface) or a change in the local field configuration which evolves due to continued accretion, rather than a change in the strength of the underlying global dipole. 666Here we do not consider screening or burial of the magnetic field by continued accretion, or more exotic effects like Ohmic dissipation or hydrodynamic flows (see Staubert et al. 2014; Staubert 2014).
The whole issue of accretion onto highly magnetized neutron stars in binary X-ray sources is very complex. There are several fundamental questions: What happens to the material that is continuously accreted? Can material be accumulated in the accretion mound, confined by the -field? If so, how much, and what effect does this have on the field? Or is the material somehow lost at the bottom of the mound either by leaking to larger areas of the neutron star surface or by incorporation into the neutron star crust? Is the gain and loss of material in equilibrium?
We suggest that the long-term decay of may be connected to a slight imbalance between gain and loss, such that the structure of the column/mound changes. With an accretion rate of , a variation on relatively short timescales does not seem implausible. If the observed decrease in were due to a simple movement of the resonant scattering region to a greater distance from the neutron star surface (possibly caused by a slightly larger gain than loss), the observed 5 keV reduction in over 20 years (0.25 keV per year) would (for a dipole field) correspond to an increase in height of 400 m (e.g., from 10 m to 410 m). The size of the mound and the magnetic field strength and structure within the mound could have changed with increasing mass. In modeling magnetic accretion mounds, Mukherjee & Bhattacharya (2012) have shown that an accumulated mass of , which is accreted within a few hours, can appreciably change the mound size and the maximum magnetic field strength as well as the field configuration: the accreted material could drag out the central field lines radially, thereby diluting the effective field strength in the center (while enhancing it at larger radii).
So, what is the reason for the turn-up? One might expect that the accumulation of mass in the accretion mound can find a natural end, e.g., when the gas pressure in the accretion mound becomes too large for the magnetic field. Could it be that the fast rise in represents a special event in which the magnetic field in the accretion mound rearranges itself as a result of a sudden radial outflow of substantial amounts of material to larger areas of the neutron star surface?
In the above scenario the long-term decay of would correspond to a phase of continuous buildup of the accretion mound in terms of mass (and height?) which is followed by an event of rather sudden mass loss, associated with a rearrangement of the magnetic field (and of mass and height of the mound) to the unperturbed configuration. This is possibly observed through the fast increase in . If this scenario is viable, and indeed cyclic in nature, we may have now seen one full cycle and measured its length to 23 to 25 yrs. The degree of the postulated imbalance between gain and loss of accreted material may be roughly estimated to by assuming that the total mass in the accretion mound of, say , is doubled in 20 yrs.
One might expect that a dramatic event like a substantial and relatively fast outflow (over a few years) from the accretion mound should show up in other observables. In searching for correlations in time between the two observed inversions (turn-ups) of (1990–1993 and 2015–2016) and all the other observables in Her X-1 that are variable on longer timescales (many of which to tens of years), such as luminosity, pulse period, 35 d turn-on history, (quasi-)period of the Anomalous Lows (AL), we have found the following near coincidences (see Table 2): turn-up 1: 1990–1993 / AL 2: start in Aug. 1993; turn-up 2: Aug. 2015–Apr. 2016 / AL 5: start in Nov. 2015. Both turn-ups in are close in time to rather prominent periods of pulse period increase (spin-down).777Measured pulse periods of Her X-1 can be found at: http://legacy.gsfc.nasa.gov/compton/data/batse/pulsar/onboard_folded/ herx-1 and https://gammaray.nsstc.nasa.gov/gbm/science/pulsars.html The separation is 23 yr, which is close to four times our estimate of the mean period (5.5 yrs) with which Anomalous Lows tend to appear (we note that during these 23 years one AL did actually not occur. The (near) coincidences between turn-ups, ALs, and stretches of significant spin-down may just be by chance, but could also have a physical meaning. Speculating about this is beyond the scope of this contribution.
We note that Her X-1 is the only highly magnetized accreting pulsar for which repeated observations over longer periods of time exist. This provided the base for the discovery and further study of the luminosity and the time dependence of the CRSF, including the new turn-up. We therefore urge that the source continues to be observed regularly on short intervals (e.g., every half year). For 2017 and 2018 this seems to be secured through accepted observing proposals for NuSTAR, INTEGRAL, HXMT, and Astrosat). At the same time, it would be very important that theoretical models be developed further.
| Obs | No. | No. of | Turn- | No. of | Turn- | Dur. | Ref. |
| erved | of | 35 d | On | 35 d | On | of | |
| ALs | AL | cycl. | cycl. | AL | |||
| before | after | ||||||
| AL | [MJD] | AL | [MJD] | [d] | |||
| AL 1 | 1 | 119 | 45469 | 127 | 45752 | 283 | 1,2 |
| AL 2 | 3 | 226 | 49205 | 229 | 49308 | 103 | 3 |
| AL 3 | 4 | 284 | 51224 | 302 | 51826 | 602 | 4,5,6,7 |
| AL 4 | 5 | 334 | 52945 | 340 | 53157 | 212 | 8 |
| AL 5 | 7 | 459 | 57302 | 461 | 57372 | 70 | 8 |
References: 1. EXOSAT: Parmar et al. (1985), 2. optical: Delgado et al. (1983), 3. Rosat / ASCA / BATSE / EUVE: Vrtilek et al. (1994), 4. RXTE/ASM: Levine & Corbet (1999), 5. BeppoSAX: Parmar et al. (1999), 6. RXTE: Coburn et al. (2000), 7. RXTE: Still et al. (2001), 8. RXTE/ASM / Swift/BAT: R. Staubert, this work.
Acknowledgements.
The motivation for this paper are new observational data taken by the NASA satellite NuSTAR and the ESA satellite INTEGRAL. We would like to acknowledge the dedication of all the people who have contributed to the great success of these missions, especially the “schedulers” for their efforts with respect to the nonstandard scheduling of the observations of Her X-1. Earlier important data were provided by the equally successful NASA missions RXTE and Swift. We thank the anonymous referee for useful suggestions.References
- Becker et al. (2012) Becker, P. A., Klochkov, D., Schönherr, G., et al. 2012, A&A, 544, A123
- Caballero & Wilms (2012) Caballero, I. & Wilms, J. 2012, Mem. Soc. Astron. Italiana, 83, 230
- Churazov et al. (2011) Churazov, E., Sazonov, S., Tsygankov, S., Sunyaev, R., & Varshalovich, D. 2011, MNRAS, 411, 1727
- Coburn et al. (2002) Coburn, W., Heindl, W. A., Rothschild, R. E., et al. 2002, ApJ, 580, 394
- Coburn et al. (2000) Coburn, W., Heindl, W. A., Wilms, J., et al. 2000, ApJ, 543, 351
- Cusumano et al. (2016) Cusumano, G., La Parola, V., D’Aì, A., et al. 2016, MNRAS, 460, L99
- Delgado et al. (1983) Delgado, A. J., Schmidt, H. U., & Thomas, H.-C. 1983, A&A, 127, L15
- Doroshenko et al. (2016) Doroshenko, V., Tsygankov, S. S., Mushtukov, A. A., et al. 2016, ArXiv e-prints
- Ferrigno et al. (2016) Ferrigno, C., Ducci, L., Bozzo, E., et al. 2016, ArXiv e-prints
- Fürst et al. (2014) Fürst, F., Pottschmidt, K., Wilms, J., et al. 2014, ApJ, 780, 133
- Gruber et al. (2001) Gruber, D. E., Heindl, W. A., Rothschild, R. E., et al. 2001, ApJ, 562, 499
- Heindl et al. (2004) Heindl, W. A., Rothschild, R. E., Coburn, W., et al. 2004, in American Institute of Physics Conference Series, Vol. 714, X-ray Timing 2003: Rossi and Beyond, ed. P. Kaaret, F. K. Lamb, & J. H. Swank, 323–330
- Hemphill et al. (2016) Hemphill, P. B., Rothschild, R. E., Fürst, F., et al. 2016, MNRAS, 458, 2745
- Klochkov et al. (2015) Klochkov, D., Staubert, R., Postnov, K., et al. 2015, A&A, 578, A88
- Klochkov et al. (2011) Klochkov, D., Staubert, R., Santangelo, A., Rothschild, R. E., & Ferrigno, C. 2011, A&A, 532, A126
- La Parola et al. (2016) La Parola, V., Cusumano, G., Segreto, A., & D’Aì, A. 2016, MNRAS
- Levine & Corbet (1999) Levine, A. M. & Corbet, R. 1999, IAU Circ., 7139
- Mowlavi et al. (2006) Mowlavi, N., Kreykenbohm, I., Shaw, S. E., et al. 2006, A&A, 451, 187
- Mukherjee & Bhattacharya (2012) Mukherjee, D. & Bhattacharya, D. 2012, MNRAS, 420, 720
- Parmar et al. (1999) Parmar, A. N., Oosterbroek, T., dal Fiume, D., et al. 1999, A&A, 350, L5
- Parmar et al. (1985) Parmar, A. N., Pietsch, W., McKechnie, S., et al. 1985, Nature, 313, 119
- Revnivtsev & Mereghetti (2016) Revnivtsev, M. & Mereghetti, S. 2016, Magnetic Fields of Neutron Stars in X-Ray Binaries, ed. V. S. Beskin, A. Balogh, M. Falanga, M. Lyutikov, S. Mereghetti, T. Piran, & R. A. Treumann, 299
- Rothschild et al. (2016) Rothschild, R. E., Kühnel, M., Britton Hemphill, P., et al. 2016, in AAS/High Energy Astrophysics Division, Vol. 15, AAS/High Energy Astrophysics Division, 120.21
- Rothschild et al. (2017) Rothschild, R. E., Kühnel, M., Pottschmidt, K., et al. 2017, MNRAS, 466, 2752
- Sartore et al. (2015) Sartore, N., Jourdain, E., & Roques, J. P. 2015, ApJ, 806, 193
- Schönherr et al. (2007) Schönherr, G., Wilms, J., Kretschmar, P., et al. 2007, A&A, 472, 353
- Staubert (2003) Staubert, R. 2003, in Multifrequency behaviour of high energy cosmic sources, ed. L.S.-G.F. Giovanelli, Vol. ChJAA, Vol. 3, S270
- Staubert (2014) Staubert, R. 2014, in PoS(INTEGRAL2014)024
- Staubert et al. (1983) Staubert, R., Bezler, M., & Kendziorra, E. 1983, A&A, 117, 215
- Staubert et al. (2016) Staubert, R., Klochkov, D., Vybornov, V., Wilms, J., & Harrison, F. A. 2016, A&A, 590, A91
- Staubert et al. (2014) Staubert, R., Klochkov, D., Wilms, J., et al. 2014, A&A, 572, A119
- Staubert et al. (2007) Staubert, R., Shakura, N. I., Postnov, K., et al. 2007, A&A, 465, L25
- Still et al. (2001) Still, M., O’Brien, K., Horne, K., et al. 2001, ApJ, 553, 776
- Terada et al. (2007) Terada, Y., Mihara, T., Nagase, F., et al. 2007, Adv. in Space Research, 40, 1485
- Trümper et al. (1978) Trümper, J., Pietsch, W., Reppin, C., et al. 1978, ApJ, 219, L105
- Tsygankov et al. (2010) Tsygankov, S. S., Lutovinov, A. A., & Serber, A. V. 2010, MNRAS, 401, 1628
- Vrtilek et al. (1994) Vrtilek, S. D., Mihara, T., Primini, F. A., et al. 1994, ApJ, 436, L9
- Vybornov et al. (2017) Vybornov, V., Klochkov, D., Gornostaev, M., et al. 2017, ArXiv e-prints
- Wilms (2012) Wilms, J. 2012, in Proceed. 39th COSPAR Sci. Assembly, 14-22 July 2012, Mysore, India, Vol. 39, 2159