Directional Design of Materials Based on the Multi-Objective Optimization: A Case Study of Two-Dimensional Thermoelectric SnSe
Abstract
Directional design of functional materials with multi-objective constraints is a big challenge, whose performance and stability are determined by different physics factors entangled with each other complicatedly. In this work, we apply the multi-objective optimization based on the Pareto Efficiency and Particle-Swarm Optimization methods to design new functional materials directionally. As a demonstration, we achieve the thermoelectric design of 2D SnSe materials through the methods. We identify several novel metastable 2D SnSe structures with simultaneously lower free energy and better thermoelectric performance over the experimentally-reported monolayer structures. We hope our results about the multi-objective Pareto Optimization method can make a step towards the integrative design of multi-objective and multi-functional materials in the future.
The thermoelectric devices and materials can directly convert the electricity into thermal energy for cooling or generate electrical power from waste heat, indicating that they have a great potential to reduce the environmental pollution and provide the cleaner energy. Moreover, the Seebeck effect can generate electrical power from waste heat described by the Seebeck coefficient and thermopower, , where is the voltage potential and is the temperature difference Bell (2008). Thermopower plays an important role in the thermoelectric materials.
Recently, bulk tin selenide (SnSe), which could undergo a second-order phase transition from the low symmetry Pnma to high symmetry Cmcm phase at 810 K, sheds a light over the field of thermoelectric materials mostly due to its ultralow thermal conductivity and ultrahigh power factor Zhao et al. (2014, 2016). This outstanding material has rapidly aroused widespread attention in various fields including the theoretical exploration Wang et al. (2015a); Bansal et al. (2016); Mehboudi et al. (2016); Skelton et al. (2016); Zhang et al. (2018) and the experimental study Li et al. (2013); Zhang et al. (2014); Zhao et al. (2015); Chang et al. (2018); Wang et al. (2018); Qin et al. (2019); Burton et al. (2019). it has a great potential for studying the thermoelectric property Chen et al. (2018), which also presents a bright prospect for the development of the novel thermoelectric materials. Even though there is a controversy about the single-crystalline SnSe sample and measured thermal conductivity Wei et al. (2016a), these seminal works have made a crucial step forward to the high thermoelectric performance in simple and pure bulk materials without doping or phononic crystals. Moreover, T. Nishimura et al. Nishimura et al. (2019) revealed the convergency of new Fermi pockets of the SnSe Pnma structure at about 0.89 GPa. On account of the quantum confinement effect, two dimensional (2D) materials have some unexpected properties compared with their pristine bulk counterparts Xu et al. (2014); Gao et al. (2017); Shimizu et al. (2016).
Furthermore, the materials discover and design using machine learning strategies to explore the materials design Schmidt et al. (2019); Gubernatis and Lookman (2018) has made a remarkable progress. Recently, the clustering and inverse design of topological materials with machine learning have been applied in the phononic Long et al. (2020) and photonic Long et al. (2019) materials. As the same time, applying machine learning strategies could guide to discover and design more thermoelectric materials with high performance Hao et al. (2019); Iwasaki et al. (2019). Several monolayer SnSe structures have been discovered recently Hu et al. (2017); Ul Haq et al. (2018, 2019). With the innovation, it is worth exploring the more novel stable 2D SnSe materials with high thermopower. However, it is a multi-objective optimization problem to satisfy two objectives, the stability and the performance of generating electrical power from waste heat at the same time.
In the mapping from structure to function, the microscopic atomic configuration is the core of macroscopic properties. Owing to the significant development of crystal structures prediction, new materials can be inversely searched by artificial intelligence such as Genetic Algorithm (GA) Oganov and Glass (2006), Particle Swarm Optimization (PSO) Wang et al. (2010), etc. rather than the traditional costly Edisonaian trial-and-error approach. The metastable structures are also important and may have high performance in some properties Kappera et al. (2014); Cho et al. (2015). Some multiple objective algorithms Núñez-Valdez et al. (2018); Chen et al. (2014) have been applied to deal with the multi-objective problem efficiently. Due to the multi-objective Particle Swarm Optimization (MOPSO) algorithm is simple to implement relatively with less hyper-parameters. Meanwhile, it also has faster convergence rate for global or local optima with sharing the information among the particles Yang et al. (2009); Lalwani et al. (2013); Coello et al. (2004). There are some studies to search for novel atomic SiO2 monolayers with negative Poisson’s ratio Gao et al. (2017) and HfO2 monolayers with high static dielectric constant Wang and Ren (2020) through the multi-objective Optimization, which are combining the first-principle calculations with GA.
In this letter, we adopt the efficient and reliable algorithm, MOPSO-sigma Núñez-Valdez et al. (2018), to directionally design 2D SnSe materials with the lower free energy and the larger thermopower based on the Pareto Optimality. In the process, The Pareto Fronts are obtained by the fast Non-dominated sorting approach Deb et al. (2002).
During the design process with MOPSO algorithm, the self-consistent energy calculations and structure optimization were employed using the Perdew-Burke-Ernzerhof (PBE) exchange-correlation functional Perdew et al. (1996) along with the projector-augmented wave (PAW) potentials Blöchl (1994) implemented in the Vienna Ab-initio Simulation Package (VASP) Kresse and Furthmüller (1996). The energy convergence threshold is set to 10-4 eV and all the atoms are allowed to relax until the maximal Hellmann-Feynman force is less than 0.001 eV/Å. After this process, in order to get accurate results of crystal structure, the band structure, thermopower and phonon dispersion, we reset the energy convergence threshold and maximal Hellmann-Feynman force to the 10-8 eV and 10-6 eV/Å. The kinetic energy cut-off was 500 eV and phonon dispersion was obtained using Phonopy package Togo et al. (2008). The Seebeck coefficient was evaluated by BoltzTraP Madsen and Singh (2006) and the MOPSO approach Núñez-Valdez et al. (2018); Zhang et al. (2015) discussed here has been implemented in our homemade computer code.
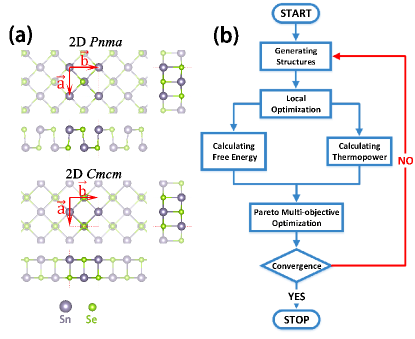
The workflow of directional design for the thermoelectric materials based on the Pareto Optimality is shown in Fig. 5(b). Firstly, the initial crystal structures are generated through the atomic Wyckoff position and 230 space groups, and similar structures are removed in order to avoid wasting computational resources Wang et al. (2010). Then local optimization (structure relaxation) is utilized sequentially to eliminate some worst structures and this crucial process guarantees population diversity and makes whole energy landscapes a well-organized shape. Thirdly, two objectives, free energy and thermopower, can be calculated. Here, as a benchmark, we only consider the thermopower at room temperature (300 K) data in all calculations. The next pivotal step is to apply multi-objective method to design the structures with the lower free energy and higher Seebeck coefficient based on the Pareto Optimality. Different from any other single objective optimization algorithm, the leader is not one structure with unique property, but a leader set, which is named the Pareto Front including the structures with lower free energy and the larger thermopower. Generally, in a collection of 2D SnSe materials, , , N is the number of all structures. If possesses the lower free energy and larger thermopower than , it means that is dominated by , is a non-dominated solution of , as following equations: ; and , where the and are free energy and thermopower of the structure , respectively.
If is not dominated by any other, the is regarded as a Pareto Optimality or Pareto Efficiency structure. All the Pareto Optimality structures constitute the Pareto Front. Then we apply the PSO algorithm to make the Pareto Front lead all the population structures forward to the next Pareto Front Núñez-Valdez et al. (2018) with lower free energy and larger thermopower. Finally, if the convergence criterion is reached, the whole procedure will stop and output the reasonable Pareto Front. Otherwise, return and repeat all the above processes.
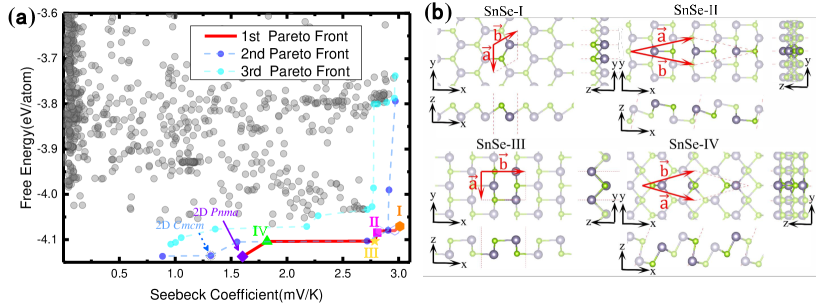
The result of adopting multi-objective is shown in Fig. 6(a), which includes 2700 samples in the process to design the stable functional structures only based on the chemical composition. For examples, there are only first three Pareto Fronts highlighted in the Fig. 6(a). The red line is the first Pareto Front set inherently with the lower free energy and the larger thermopower than other structures presented by circles. Interestingly, we find the known 2D SnSe structures Wang et al. (2015b); Zhang et al. (2016), the violet rhombus symbols and its left nearest neighbor gray dash circles corresponding to 2D Pnma and 2D Cmcm structures of SnSe shown in Fig. 5(a), respectively, during our blind searching processes, which does validate the correctness and exhibit robustness of our multi-objective design method. Furthermore, as shown in Fig. 6(b), there are four novel monolayer materials with superior stability and much larger thermopower than the known structures in Fig. 5(a), namely, SnSe-I, SnSe-II, SnSe-III and SnSe-IV, which are corresponding to the orange hexagon, magenta square, yellow pentagram and green triangle on the first Pareto Front, respectively. Here, we only focus on their monolayer structures and ignore the bilayer phases. Those bilayer phases are corresponding to the blue hollow hexagons on the first Pareto Front, as shown in the Supporting Information. Shenshen Yan and Ren (2020). Moreover, the light blue circles with blue dash line and the light cyan circles with cyan dash line are the second and third Pareto Fronts, respectively. The monolayer of Cmcm phase is also found corresponding the light blue circle with dot circle lied on the second Pareto Front. More structures on the second and the third Pareto Front are shown in the Supporting Information Shenshen Yan and Ren (2020), which contain quasi-one dimensional, bilayer and novel metastable atomic configurations. The grey circles represent the dominated structures with much higher free energy and lower thermopower than the first three Pareto Fronts, which are not discussed in this manuscript.
The structure of orange hexagon, SnSe-I, is the honeycomb monolayer, similar to the silicene Cahangirov et al. (2009) with small buckling from one side view. The blue hollow hexagons are the bilayer counterparts of the honeycomb structures. SnSe-III, the yellow pentagram, is the structure with armchair and zigzag ridges from the different side view. As well as, we discovered accidentally that same main group and stoichiometric number of GeSe has been synthesised by high-pressure techniques von Rohr et al. (2017), whose one layer is very similar to the SnSe-III structure. The structure of magenta square, SnSe-II, is a combination of cells of SnSe-I and SnSe-III. More interestingly, we also find another structure, the green triangle, SnSe-IV, is constructed with the cells of the monolayer of Pnma and SnSe-I. The optimized structural properties of the novel 2D SnSe structures are summarized in the Table 2.
| Materials | Space group (NO.) | (Å) | (Å) | (eV/atom) | () | () | (mV/K) | |
|---|---|---|---|---|---|---|---|---|
| SnSe-I | P3m1 (156) | 3.91 | 3.91 | -4.08 | 1.34 | 8.03 | 6 | 3.587 |
| SnSe-II | Cm (8) | 9.64 | 9.64 | -4.09 | 2.19 | 4.38 | 2 | 2.763 |
| SnSe-III | Pmmn (59) | 3.92 | 6.17 | -4.10 | 1.31 | 2.62 | 2 | 2.596 |
| SnSe-IV | Cm (8) | 7.67 | 7.67 | -4.11 | 0.37, 0.76 | 1.13 | 2 | 1.871 |
Then we confirm the thermoelectric performance and the stabilities of the novel 2D SnSe structures on the first Pareto Front adopting the multi-objective method, which have light higher free energy and much larger thermopower than the structures in Fig. 5(a). The first priority is to certify the stabilities of these new freestanding 2D SnSe materials. The free energy of SnSe-I (-4.079 eV/atom), SnSe-II (-4.091 eV/atom) SnSe-III (-4.103 eV/atom) and SnSe-IV (-4.106 eV/atom) are higher than free energy of Pnma phase (-4.137 eV/atom). The dynamical stabilities of these metastable structures have been confirmed by phonon dispersion relations at 0 K and ab initio molecular dynamics (AIMD) simulations at 300 K shown in Fig. 7(a) and Fig. 7(b). There is not any imaginary frequency in the phonon dispersions of the 2D SnSe-I, SnSe-III and SnSe-IV. And there are little imaginary frequencies near point in the phonon dispersion of 2D SnSe-II. For 2D materials, the imaginary frequencies near the point were also reported in germanene Cahangirov et al. (2009), honeycomb arsenenes Kamal and Ezawa (2015) and this artificial imprecision in the computation has nothing to do with a structural transition and instability Carrete et al. (2016); Liu et al. (2016); Şahin et al. (2009). After AIMD with the NVT ensemble simulations, the atomic configurations are changed to the position of equilibrium at 300K. Furthermore, the AIMD simulations with NVE ensemble at a series of elevated temperatures with lifetime 9 ps at 300 K are performed to verify their dynamic stabilities with the oscillating free energy shown in Fig. 7(b). The top views of 2D SnSe-I, SnSe-II, SnSe-III and SnSe-IV after the AIMD simulations are shown in the inset pictures. They show the dynamic stabilities of the four structures.
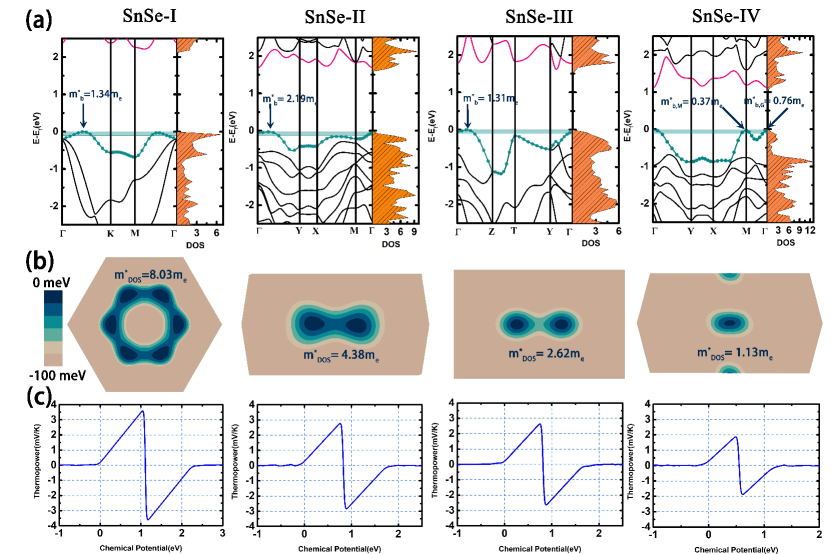
Electronic band structure linked density of states(DOS), Fermi surface and thermopower of SnSe-I, SnSe-II, SnSe-III and SnSe-IV, are shown in Fig. 8. We can find that in the structure SnSe-I, the valance band maximum (VBM) is in the -K path, and the conduction band minimum (CBM) is in the M- path in the Brillouin Zone (BZ) with an indirect band gap of 2.22 eV. In the SnSe-II, the VBM is in the Y- path, and the CBM is in the point with an indirect band gap of 1.66 eV. For the SnSe-III, the VBM is in the Y- path, the CBM is in the -Z path with the indirect band gap of 1.61 eV. Furthermore, in the SnSe-IV, both VBM and CBM are in the point with a direct band gap of 1.10 eV. Their band gaps are larger than that of the monolayer Pnma phase (0.91 eV Wang et al. (2015a)). In the four structures, the sharp peaks of DOS near the valence maxima and conduction minima may enhance the thermopower.
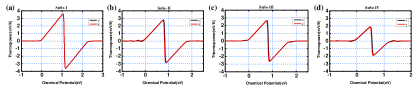
Figure. 8(c) shows the average thermopower depending on the chemical potential. The thermopower along the x and y directions is shown in the Supporting Information Shenshen Yan and Ren (2020). The positive and negative signs of thermopower correspond to the hole carrier (p-type and ) and electron carrier (n-type and ). The maximum of thermopower with p-type carrier concentrations of SnSe-I, SnSe-II, SnSe-III and SnSe-IV are 3.587 (), 2.763(), 2.596 () and 1.871 () which are much larger than the known 2D SnSe monolayer of Pnma phase (around 1.75 ()) Shafique and Shin (2017) and 3-6 times of bulk SnSe (0.5-0.58 ()) Dewandre et al. (2016).
Generally speaking, there are several approaches to enhance the thermopower, including high valley degeneracy produced by carrier pocket engineering Pei et al. (2011); Liu et al. (2012); Wang et al. (2018); Zhang et al. (2018); Qin et al. (2019); Nishimura et al. (2019), a distorted DOS by doping that resonates one energy level of a localized atom Heremans et al. (2008), weak electron-phonon coupling Wang et al. (2012), phonon drag effect Ohta et al. (2007) and pudding-mold-like shape in the highest valence band or lowest conduction band that is beneficial to a high Seebeck and conductivity Kuroki and Arita (2007). In the Mott formula Mahan and Sofo (1996), , where is the energy-dependent electrical conductivity. Meanwhile, is dominated by , , , , and , the Fermi-Dirac distribution function, the DOS, the carrier charge, the Boltzmann constant and the mobility, respectively. Generally, the materials have a local substantially increase of the energy-dependent DOS at the Fermi energy, the thermopower will be significantly enhanced.
For the 2D materials, the correlation between the thermopower and the DOS effective mass at the Fermi energycan be expressed as following equation (details can be found in the Appendix): different from thermopower of 3D materials , for the 2D materials, , where is reduced Planck constant, is the DOS effective mass at the Fermi energy level, is the carrier concentration. Therefore, the larger DOS effective mass will lead to a larger thermopower.
For the 2D materials, the correlation between the DOS effective mass () and the isotropic parabolic band effective mass () is:
| (1) |
different from the 3D density of states effective mass formula: , where the is the band degeneracy (details can be found in the Appendix). In the sense of p-type doping, the Fermi energy is close to the top of the valence band, and the Fermi surfaces within 100 meV from the top of the valence band in the first Brillouin zone are calculated, as shown in the Fig. 8(b). From the electronic band structures and Fermi surfaces of the SnSe-I, SnSe-II, SnSe-III and SnSe-IV structures, we can find that the band degeneracy, , are 6, 2, 2, 2, and the DOS effective mass (the isotropic parabolic band effective mass) are 8.03 (1.34), 4.38 (2.19), 2.62 (1.31), 1.13 (0.37 at M point and 0.76 at G point) respectively, where the is free electron mass.
According to the Mott formula and the DOS effective mass of 2D materials, we can obtain directly the thermopower for 2D materials:
| (2) |
which is different from the thermopower for 3D materials: . The thermopower is determined by band degeneracy(), band effective mass() and carrier concentration(). In addition, the band degeneracy in 2D material is more important than 3D material to the thermopower. For the four 2D SnSe materials, the higher band degeneracy and band effective mass could lead to the larger density of states effective mass, , and also the higher thermopower in Table 2. Due to the different correlations between thermopower and band degeneracy, for 2D materials and for 3D materials, the band degeneracy, , plays a more vital role for the 2D materials. Moreover, the band engineering strategies Pei et al. (2012, 2011); Ding et al. (2015); Yan et al. (2015) has ability to increase the band degeneracy for the 3D materials, which will be more effective for the 2D materials.
In conclusion, we have achieved the directional design of materials through the Multi-Objective Pareto Optimization method based on the Pareto Efficiency and Particle-Swarm Optimization only according to the chemical composition. This method can design the structures with the lower free energy and the larger thermopower at the same time. The designed novel 2D SnSe monolayers on the first Pareto Front also indicate that the main group IV-VI, for instance, the monolayer of -GeSe at the high-pressure von Rohr et al. (2017) and main group-V, like abundant Phosphorene Guan et al. (2014); Li et al. (2017); Han et al. (2017) may share similar homogeneous configurations because of the similar outer valence electrons. Hence, the efficiency of Pareto Optimization of structures has demonstrated that it is instructive to the further materials design and even the experimental synthesis.
So far, we only focus on the stability and the thermopower, moreover, we explain the band degeneracy is more important to the themopower for 2D materials than 3D materials. In the future, we will add more functional objectives, such as, electronic relaxation time and lattice thermal conductivity to design the efficient thermoelectric materials, even to design the multiple functional materials.
Acknowledgements
We acknowledge the support from the National Natural Science Foundation of China (No. 11935010 and No.11775159), the Shanghai Science and Technology Committee (Grants No. 18ZR1442800 and No. 18JC1410900), and the Opening Project of Shanghai Key Laboratory of Special Artificial Microstructure Materials and Technology.
Appendix A Correlation between band effective mass and density of states effective mass, and Seebeck Coefficient for 3D and 2D materials
Here, we show the different correlations between Seebeck coefficient and density of states (DOS) effective mass () for 3D and 2D materials. Meanwhile, we can also obtain the correlations between band effective mass () and density of states (DOS) effective mass () for 3D and 2D materials.
According to the Onsager reciprocal relations of the charge and heat currents G. K. H. Madsen (2018): , , where , we can obtain the electronic conductivity and the Seebeck coefficient under the parabolic band model approximation: , where the , E, , , and are the charge , electric field, energy, temperature, Fermi energy and Fermi-Dirac distribution function, respectively.
When only considering the electronic transport near the Fermi level, after performing a Sommerfeld expansion, we can obtain the Mott’s relations Mahan and Sofo (1996): . We can find that the DOS will make an important effect on the Seebeck coefficient.
The is the energy-dependent electronic conductivity, expressed as: , where the , and are the electronic relaxation time, group velocity of carriers and DOS of multiple degenerate bands. The DOS of multiple degenerate bands, is determined by the DOS of single band: , where the and are band degeneracy and the DOS of single band respectively. If only considering the acoustic phonon scattering, we can get: D. L. Young and Mulligan (2000). According to the free electron approximation, the correlation between group velocity of carriers and energy is . Here we will give the DOS expression for 3D and 2D systems.
For 3D system, the DOS of single band model is: where is reduced Planck constant. If considering the multiple degenerate bands model, the DOS of multiple degenerate bands model, is: . Then we can obtain that: . Therefore, we can find the correlation among the DOS effective mass, band degeneracy and single band effective mass for the 3D systemWei et al. (2016b); Gibbs et al. (2017): .
Similarly, for 2D system, the DOS of single band model is: . If considering the multiple degenerate bands model, the DOS of multiple degenerate bands model, is: . Hence, we also can obtain that: . We can also find the correlation among the DOS effective mass, band degeneracy and single band effective mass for the 2D system: . Then, we give the formulas of the Seebeck coefficient for 3D and 2D systems.
For 3D system, the energy-dependent electronic conductivity: , we could obtain the Seebeck coefficient:
| (3) |
where is the DOS effective mass at the Fermi energy level, is the Fermi radius, the is the Fermi radius for 3D system, and is carrier concentration.
Similarly, for 2D system, the energy-dependent electronic conductivity: , we could obtain the Seebeck coefficient:
| (4) |
where the is the Fermi radius for 2D system.
Appendix B Supporting Information: Directional Design of Materials Based on Multi-Objective Optimization: A Case Study of Two-Dimensional Thermoelectric SnSe
B.1 The thermopower along x and y directions
Appendix C The bilayer structures on the first Pareto Front
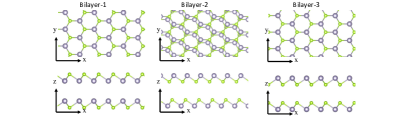
| Materials | Space group | (Å) | (Å) | (eV/atom) | (mV/K) |
|---|---|---|---|---|---|
| Bilayer-1 | P-6m2 | 3.920 | 3.920 | -4.081 | 2.829 |
| Bilayer-2 | P-1 | 3.913 | 3.915 | -4.080 | 2.965 |
| Bilayer-3 | P-6m2 | 3.910 | 3.910 | -4.079 | 2.968 |
C.1 Structures on the second Pareto Front and third Pareto Front
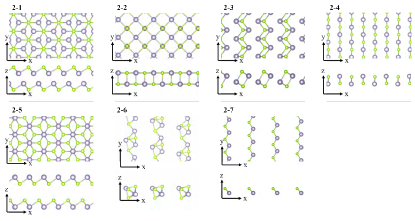
| Materials | Space group | (Å) | (Å) | (eV/atom) | (mV/K) |
|---|---|---|---|---|---|
| 2-1 | P-3m1 | 4.094 | 4.094 | -4.137 | 0.887 |
| 2-2 | Cmcm | 4.320 | 4.320 | -4.135 | 1.320 |
| 2-3 | P-1 | 4.112 | 5.109 | -4.105 | 1.555 |
| 2-4 | Ama2 | 3.937 | 6.148 | -4.103 | 2.719 |
| 2-5 | C2/m | 6.795 | 3.918 | -4.080 | 2.906 |
| 2-6 | P1 | 7.031 | 7.329 | -3.990 | 2.914 |
| 2-7 | P1 | 3.800 | 7.134 | -3.794 | 2.971 |
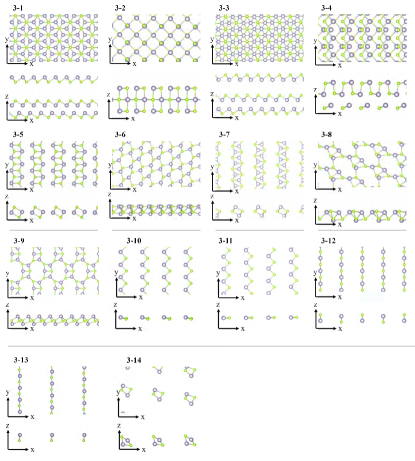
| Materials | Space group | (Å) | (Å) | (eV/atom) | (mV/K) |
|---|---|---|---|---|---|
| 3-1 | P3m1 | 4.039 | 4.039 | -4.110 | 0.961 |
| 3-2 | Cm | 6.154 | 6.039 | -4.107 | 1.003 |
| 3-3 | Cm | 6.825 | 3.989 | -4.096 | 1.054 |
| 3-4 | Pm | 4.532 | 4.134 | -4.077 | 1.359 |
| 3-5 | P-1 | 3.911 | 6.410 | -4.071 | 2.178 |
| 3-6 | P1 | 6.516 | 6.501 | -4.047 | 2.279 |
| 3-7 | P-1 | 3.955 | 7.964 | -4.034 | 2.720 |
| 3-8 | P1 | 6.109 | 7.060 | -4.027 | 2.762 |
| 3-9 | P1 | 7.224 | 7.232 | -3.986 | 2.775 |
| 3-10 | Pm | 6.594 | 7.615 | -3.801 | 2.778 |
| 3-11 | Amm2 | 3.793 | 13.768 | -3.800 | 2.813 |
| 3-12 | Pmmn | 3.789 | 12.448 | -3.797 | 2.894 |
| 3-13 | P1 | 3.816 | 10.770 | -3.787 | 2.963 |
| 3-14 | P1 | 8.306 | 9.612 | -3.738 | 2.970 |
References
- Bell (2008) L. E. Bell, Science 321, 1457 (2008).
- Zhao et al. (2014) L.-D. Zhao, S.-H. Lo, Y. Zhang, H. Sun, G. Tan, C. Uher, C. Wolverton, V. P. Dravid, and M. G. Kanatzidis, Nature 508, 373 (2014).
- Zhao et al. (2016) L.-D. Zhao, G. Tan, S. Hao, J. He, Y. Pei, H. Chi, H. Wang, S. Gong, H. Xu, V. P. Dravid, C. Uher, G. J. Snyder, C. Wolverton, and M. G. Kanatzidis, Science 351, 141 (2016).
- Wang et al. (2015a) F. Q. Wang, S. Zhang, J. Yu, and Q. Wang, Nanoscale 7, 15962 (2015a).
- Bansal et al. (2016) D. Bansal, J. Hong, C. W. Li, A. F. May, W. Porter, M. Y. Hu, D. L. Abernathy, and O. Delaire, Phys. Rev. B 94, 054307 (2016).
- Mehboudi et al. (2016) M. Mehboudi, B. M. Fregoso, Y. Yang, W. Zhu, A. van der Zande, J. Ferrer, L. Bellaiche, P. Kumar, and S. Barraza-Lopez, Phys. Rev. Lett. 117, 246802 (2016).
- Skelton et al. (2016) J. M. Skelton, L. A. Burton, S. C. Parker, A. Walsh, C.-E. Kim, A. Soon, J. Buckeridge, A. A. Sokol, C. R. A. Catlow, A. Togo, et al., Phys. Rev. Lett. 117, 075502 (2016).
- Zhang et al. (2018) K. Zhang, K. Deng, J. Li, H. Zhang, W. Yao, J. Denlinger, Y. Wu, W. Duan, and S. Zhou, Phys. Rev. Mater. 2, 054603 (2018).
- Li et al. (2013) L. Li, Z. Chen, Y. Hu, X. Wang, T. Zhang, W. Chen, and Q. Wang, J. Am. Chem. Soc. 135, 1213 (2013).
- Zhang et al. (2014) C. Zhang, H. Yin, M. Han, Z. Dai, H. Pang, Y. Zheng, Y.-Q. Lan, J. Bao, and J. Zhu, ACS Nano 8, 3761 (2014).
- Zhao et al. (2015) S. Zhao, H. Wang, Y. Zhou, L. Liao, Y. Jiang, X. Yang, G. Chen, M. Lin, Y. Wang, H. Peng, et al., Nano Res. 8, 288 (2015).
- Chang et al. (2018) C. Chang, M. Wu, D. He, Y. Pei, C.-F. Wu, X. Wu, H. Yu, F. Zhu, K. Wang, Y. Chen, L. Huang, J.-F. Li, J. He, and L.-D. Zhao, Science 360, 778 (2018).
- Wang et al. (2018) Z. Wang, C. Fan, Z. Shen, C. Hua, Q. Hu, F. Sheng, Y. Lu, H. Fang, Z. Qiu, J. Lu, et al., Nat. Commun. 9, 47 (2018).
- Qin et al. (2019) B. Qin, D. Wang, W. He, Y. Zhang, H. Wu, S. J. Pennycook, and L.-D. Zhao, J. Am. Chem. Soc. 141, 1141 (2019).
- Burton et al. (2019) M. R. Burton, S. Mehraban, D. Beynon, J. McGettrick, T. Watson, N. P. Lavery, and M. J. Carnie, Adv. Energy Mater. 9, 1900201 (2019).
- Chen et al. (2018) Z.-G. Chen, X. Shi, L.-D. Zhao, and J. Zou, Prog. Mater. Sci. 97, 283 (2018).
- Wei et al. (2016a) P.-C. Wei, S. Bhattacharya, J. He, S. Neeleshwar, R. Podila, Y. Chen, and A. Rao, Nature 539, E1 (2016a).
- Nishimura et al. (2019) T. Nishimura, H. Sakai, H. Mori, K. Akiba, H. Usui, M. Ochi, K. Kuroki, A. Miyake, M. Tokunaga, Y. Uwatoko, K. Katayama, H. Murakawa, and N. Hanasaki, Phys. Rev. Lett. 122, 226601 (2019).
- Xu et al. (2014) X. Xu, L. F. Pereira, Y. Wang, J. Wu, K. Zhang, X. Zhao, S. Bae, C. T. Bui, R. Xie, J. T. Thong, et al., Nat. Commun. 5 (2014).
- Gao et al. (2017) Z. Gao, X. Dong, N. Li, and J. Ren, Nano Lett. 17, 772 (2017).
- Shimizu et al. (2016) S. Shimizu, M. S. Bahramy, T. Iizuka, S. Ono, K. Miwa, Y. Tokura, and Y. Iwasa, Proc. Natl. Acad. Sci. U.S.A. 113, 6438 (2016).
- Schmidt et al. (2019) J. Schmidt, M. R. G. Marques, S. Botti, and M. A. L. Marques, NPJ Comput. Mater. 5, 83 (2019).
- Gubernatis and Lookman (2018) J. E. Gubernatis and T. Lookman, Phys. Rev. Mater. 2, 120301 (2018).
- Long et al. (2020) Y. Long, J. Ren, and H. Chen, Phys. Rev. Lett. 124, 185501 (2020).
- Long et al. (2019) Y. Long, J. Ren, Y. Li, and H. Chen, Appl. Phys. Lett. 114, 181105 (2019).
- Hao et al. (2019) S. Hao, V. P. Dravid, M. G. Kanatzidis, and C. Wolverton, NPJ Comput. Mater. 5, 58 (2019).
- Iwasaki et al. (2019) Y. Iwasaki, I. Takeuchi, V. Stanev, A. G. Kusne, M. Ishida, A. Kirihara, K. Ihara, R. Sawada, K. Terashima, H. Someya, K.-i. Uchida, E. Saitoh, and S. Yorozu, Sci. Rep. 9, 2751 (2019).
- Hu et al. (2017) Z.-Y. Hu, K.-Y. Li, Y. Lu, Y. Huang, and X.-H. Shao, Nanoscale 9, 16093 (2017).
- Ul Haq et al. (2018) B. Ul Haq, S. AlFaify, R. Ahmed, F. K. Butt, A. Laref, and M. Shkir, Phys. Rev. B 97, 075438 (2018).
- Ul Haq et al. (2019) B. Ul Haq, S. AlFaify, and A. Laref, Phys. Chem. Chem. Phys. 21, 4624 (2019).
- Shenshen Yan and Ren (2020) Y. L. Shenshen Yan, Zhibin Gao and J. Ren, Supporting Information (2020).
- Oganov and Glass (2006) A. R. Oganov and C. W. Glass, J. Chem. Phys. 124, 244704 (2006).
- Wang et al. (2010) Y. Wang, J. Lv, L. Zhu, and Y. Ma, Phys. Rev. B 82, 094116 (2010).
- Kappera et al. (2014) R. Kappera, D. Voiry, S. E. Yalcin, B. Branch, G. Gupta, A. D. Mohite, and M. Chhowalla, Nat. Mater. 13, 1128 (2014).
- Cho et al. (2015) S. Cho, S. Kim, J. H. Kim, J. Zhao, J. Seok, D. H. Keum, J. Baik, D.-H. Choe, K. J. Chang, K. Suenaga, S. W. Kim, Y. H. Lee, and H. Yang, Science 349, 625 (2015).
- Núñez-Valdez et al. (2018) M. Núñez-Valdez, Z. Allahyari, T. Fan, and A. R. Oganov, Comput. Phys. Commun. 222, 152 (2018).
- Chen et al. (2014) H.-Z. Chen, Y.-Y. Zhang, X. Gong, and H. Xiang, J.Phys. Chem. C 118, 2333 (2014).
- Yang et al. (2009) J. Yang, J. Zhou, L. Liu, and Y. Li, Comput. Math. with Appl 57, 1995 (2009).
- Lalwani et al. (2013) S. Lalwani, S. Singhal, R. Kumar, and N. Gupta, Trans. Comb. 2, 39 (2013).
- Coello et al. (2004) C. A. C. Coello, G. T. Pulido, and M. S. Lechuga, IEEE Trans. Evol. Comput. 8, 256 (2004).
- Wang and Ren (2020) Y. Wang and J. Ren, Phys. Chem. Chem. Phys. 22, 4481 (2020).
- Deb et al. (2002) K. Deb, A. Pratap, S. Agarwal, and T. Meyarivan, IEEE Trans. Evol. Comput. 6, 182 (2002).
- Perdew et al. (1996) J. P. Perdew, K. Burke, and M. Ernzerhof, Phys. Rev. Lett. 77, 3865 (1996).
- Blöchl (1994) P. E. Blöchl, Phys. Rev. B 50, 17953 (1994).
- Kresse and Furthmüller (1996) G. Kresse and J. Furthmüller, Phys. Rev. B 54, 11169 (1996).
- Togo et al. (2008) A. Togo, F. Oba, and I. Tanaka, Phys. Rev. B 78, 134106 (2008).
- Madsen and Singh (2006) G. K. Madsen and D. J. Singh, Comput. Phys. Commun. 175, 67 (2006).
- Núñez-Valdez et al. (2018) M. Núñez-Valdez, Z. Allahyari, T. Fan, and A. R. Oganov, Comput. Phys. Commun. 222, 152 (2018).
- Zhang et al. (2015) Y.-Y. Zhang, W. Gao, S. Chen, H. Xiang, and X.-G. Gong, Comput. Mater. Sci. 98, 51 (2015).
- Wang et al. (2015b) F. Q. Wang, S. Zhang, J. Yu, and Q. Wang, Nanoscale 7, 15962 (2015b).
- Zhang et al. (2016) L.-C. Zhang, G. Qin, W.-Z. Fang, H.-J. Cui, Q.-R. Zheng, Q.-B. Yan, and G. Su, Sci. Rep. 6 (2016).
- Cahangirov et al. (2009) S. Cahangirov, M. Topsakal, E. Aktürk, H. Şahin, and S. Ciraci, Phys. Rev. Lett. 102, 236804 (2009).
- von Rohr et al. (2017) F. O. von Rohr, H. Ji, F. A. Cevallos, T. Gao, N. P. Ong, and R. J. Cava, J. Am. Chem. Soc. 139, 2771 (2017).
- Kamal and Ezawa (2015) C. Kamal and M. Ezawa, Phys. Rev. B 91, 085423 (2015).
- Carrete et al. (2016) J. Carrete, W. Li, L. Lindsay, D. A. Broido, L. J. Gallego, and N. Mingo, Mater. Res. Lett. 4, 204 (2016).
- Liu et al. (2016) D. Liu, A. G. Every, and D. Tománek, Phys. Rev. B 94, 165432 (2016).
- Şahin et al. (2009) H. Şahin, S. Cahangirov, M. Topsakal, E. Bekaroglu, E. Akturk, R. T. Senger, and S. Ciraci, Phys. Rev. B 80, 155453 (2009).
- Shafique and Shin (2017) A. Shafique and Y.-H. Shin, Sci. Rep. 7, 506 (2017).
- Dewandre et al. (2016) A. Dewandre, O. Hellman, S. Bhattacharya, A. H. Romero, G. K. Madsen, and M. J. Verstraete, Phys. Rev. Lett. 117, 276601 (2016).
- Pei et al. (2011) Y. Pei, X. Shi, A. LaLonde, H. Wang, L. Chen, and G. J. Snyder, Nature 473, 66 (2011).
- Liu et al. (2012) W. Liu, X. Tan, K. Yin, H. Liu, X. Tang, J. Shi, Q. Zhang, and C. Uher, Phys. Rev. Lett. 108, 166601 (2012).
- Heremans et al. (2008) J. P. Heremans, V. Jovovic, E. S. Toberer, A. Saramat, K. Kurosaki, A. Charoenphakdee, S. Yamanaka, and G. J. Snyder, Science 321, 554 (2008).
- Wang et al. (2012) H. Wang, Y. Pei, A. D. LaLonde, and G. J. Snyder, Proc. Natl. Acad. Sci. U.S.A. 109, 9705 (2012).
- Ohta et al. (2007) H. Ohta, S. Kim, Y. Mune, T. Mizoguchi, K. Nomura, S. Ohta, T. Nomura, Y. Nakanishi, Y. Ikuhara, M. Hirano, et al., Nat. Mater. 6, 129 (2007).
- Kuroki and Arita (2007) K. Kuroki and R. Arita, J. Phys. Soc. Jpn. 76, 083707 (2007).
- Mahan and Sofo (1996) G. Mahan and J. Sofo, Proc. Natl. Acad. Sci. U.S.A. 93, 7436 (1996).
- Pei et al. (2012) Y. Pei, H. Wang, and G. J. Snyder, Adv. Mater. 24, 6125 (2012).
- Ding et al. (2015) G. Ding, J. Li, and G. Gao, RSC Adv. 5, 91974 (2015).
- Yan et al. (2015) J. Yan, P. Gorai, B. Ortiz, S. Miller, S. A. Barnett, T. Mason, V. Stevanović, and E. S. Toberer, Energy Environ. Sci. 8, 983 (2015).
- Guan et al. (2014) J. Guan, Z. Zhu, and D. Tománek, Phys. Rev. Lett. 113, 046804 (2014).
- Li et al. (2017) L. Li, J. Kim, C. Jin, G. J. Ye, D. Y. Qiu, H. Felipe, Z. Shi, L. Chen, Z. Zhang, F. Yang, et al., Nat. Nanotechnol. 12, 21 (2017).
- Han et al. (2017) W. H. Han, S. Kim, I.-H. Lee, and K. J. Chang, J. Phys. Chem. Lett. 8, 4627 (2017).
- G. K. H. Madsen (2018) M. J. V. G. K. H. Madsen, J. Carrete, Comput. Phys. Commun. 231, 140 (2018).
- D. L. Young and Mulligan (2000) V. I. K. A. S. G. D. L. Young, T. J. Coutts and W. P. Mulligan, J. Vac. Sci. Technol. 18, 2978 (2000).
- Wei et al. (2016b) T.-R. Wei, G. Tan, X. Zhang, C.-F. Wu, J.-F. Li, V. P. Dravid, G. J. Snyder, and M. G. Kanatzidis, J. Am. Chem. Soc. 138, 8875 (2016b).
- Gibbs et al. (2017) Z. M. Gibbs, F. Ricci, G. Li, Z. Hong, K. Persson, G. Ceder, G. Hautier, A. Jain, and G. J. Snyder, NPJ Comput. Mater. 3, 1 (2017).