A model of cell-wall dynamics during sporulation in Bacillus subtilis
Abstract
To survive starvation, Bacillus subtilis forms durable spores. After asymmetric cell division, the septum grows around the forespore in a process called engulfment, but the mechanism of force generation is unknown. Here, we derived a novel biophysical model for the dynamics of cell-wall remodeling during engulfment based on a balancing of dissipative, active, and mechanical forces. By plotting phase diagrams, we predict that sporulation is promoted by a line tension from the attachment of the septum to the outer cell wall, as well as by an imbalance in turgor pressures in the mother-cell and forespore compartments. We also predict that significant mother-cell growth hinders engulfment. Hence, relatively simple physical principles may guide this complex biological process.
INTRODUCTION
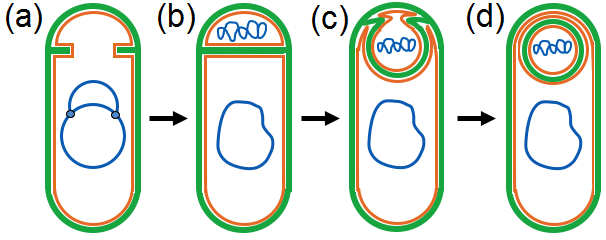
Bacillus subtilis is a rod-shaped bacterium with a thick (- nm) outer cell wall made of peptidoglycan (PG) polymers for withstanding high ( MPa) turgor pressures banerjee . To survive starvation, this bacterium forms robust and dormant endospores in several steps (Fig. 1): during DNA replication, septation is initiated asymmetrically by FtsZ (a), followed by pumping of one of the DNA molecules through the forespore’s closing septum by ATP hydrolysis (b) errington ; bisson ; levine ; narula . Subsequently, the septum (made of PG) is remodeled and grows around the forespore (c), allowing the mother cell to engulf the forespore by its membrane for spore maturation (d) tocheva ; meyer ; doan . This remodeling process is highly complicated, involving penicillin binding proteins (PBPs) to synthesize PG typas , the PG-degradation enzymes SpoIID/M/P ojkic , the SpoIIQ-SpoIIIAH backup mechanism ojkic , and many other proteins meeske . While MreB may help localise PBPs to the leading edge of engulfment, there are no known cytoskeletal force generators or motor proteins involved abanesdm . What then drives PG remodeling and hence engulfment? We hypothesize that physical organizing principles may guide the engulfment process.
Here, we aimed to derive a theoretical model of engulfment in the presence of cell-wall remodeling. To understand the various forces acting on the cell wall, we built on a theoretical framework recently introduced for studying the cell-wall dynamics at a cellular scale banerjee . This framework is based on Rayleigh’s principle of least-energy dissipation rayleigh (equivalent to maximizing the rate of entropy production), with PG remodeling described as an active force that arises from changes in the mechanochemical energy associated with maintaining cell shape. We adapted it to mathematically derive a model for the dynamics of cell-wall remodeling during engulfment. By plotting comprehensive phase diagrams, we were able to determine the impact of various parameters on engulfment. Specifically, we predict that sporulation is driven by a positive line tension and an imbalance in turgor pressure between the mother cell and the forespore. We also investigated the theoretical relationship between engulfment and mother-cell growth, finding that significant growth hinders engulfment.
GENERAL EQUATION FOR CELL-WALL DYNAMICS
Similar to the original framework banerjee , the active and mechanical forces in our model are given by the derivatives of the total energy with respect to shape degrees of freedom. Similar to Ref. 1, we focused on the cell wall, but in the ESI† we also considered the role of the membrane pedrido (Figs. S1a-b in ESI†). These shape degrees of freedom are specified by the generalized coordinates () and their respective velocities :
| (1) |
with viscosity constant and volume over which dissipation of occurs. Here, is the thickness of the cell wall assumed to be constant and is the surface area of dissipation.
The left-hand side of Eq. 1 describes the dissipative force, whose corresponding energy represents the work done to the medium when the cell shape deforms at a rate , arising from the insertion of newly synthesized PG strands into the cell wall jiang10 ; jiang ; jiang_rev . The right-hand side describes the sum of active and mechanical forces, both of which, when integrated, represent the work done to the cell wall when the cell shape deforms by . The active forces arise from distributed macromolecules that convert chemical energy into mechanical work; these forces include the chemical potential for PG synthesis, as well as the line tension caused by the active remodeling of the septum, which provides room for the mother-cell cytoplasm to entropically expand and hence engulf the forespore ojkic16 . The mechanical forces arise from the internal turgor pressure and the opposing surface tension of the elastic cell wall that act to increase and decrease cell volume, respectively. Further included in the mechanical force is the bending stiffness, reducing the degree of bending away from zero or any preferred curvature. We neglected the energy of interaction with cytoskeletal filaments due to lack of concrete experimental evidence. (The FtsZ-initiated septum is our initial condition in the models, and there are no established roles of FtsZ and MreB during engulfment.) Assuming no external forces or thermal noise, the dissipative energy is balanced by the active and mechanical energies rayleigh . We implemented both a minimal model for engulfment and a more realistic model, which accounts for mother-cell and forespore growth.
MINIMAL MODEL OF ENGULFMENT
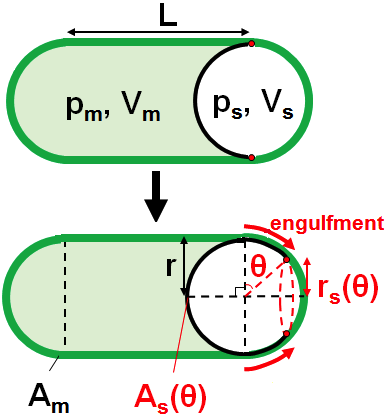
B. subtilis is modeled as a cylindrical cell with two hemispherical poles. Here, we use a minimal model for the purpose of gaining intuition. In this minimal model, we assumed for simplicity that the septum is already curved from the start (Fig. 2), although in reality the septum is initially flat tocheva . Since the shape of the septum is fixed, the forespore is always spherical. Therefore, the radius and length of the central cylindrical region of the mother cell, as well as the different turgor pressures and volumes of the mother cell (, and ) and forespore (, and ) are constant. The only shape degree of freedom is angle of engulfment (Fig. 2), and the surface area over which dissipation occurs during increase in is . Surface area of the forespore cell wall and distance between the leading edge of the engulfing membrane and the longitudinal axis are both functions of . The Helfrich bending energy of the septum is also a function of . Conversely, surface area of the mother-cell wall and bending energy of the mother-cell wall are not functions of and hence are constant. The bending energies are described in terms of circumferential bending rigidity ( for mother cell, for forespore) and preferred radius of the cell-wall cross-section.
The sum of active and mechanical energies is given by:
| (2) |
with surface tension , chemical potential for PG remodeling, line tension , mother-cell and forespore turgor pressures and , and cell-wall and septum bending energies and . Similar to Ref. 1, we used a constant surface tension as is either fixed or strongly constrained by MreB so that different functional forms of would not have much effect. The line tension may represent the energy cost for remodeling the attachment of the septum to the outer cell wall by the SpoIID/M/P complex ojkic ; ojkic16 , or originate from the membrane, which has to bend backwards onto itself. This expression for was substituted into Eq. 1 for cell-wall dynamics with . Since we are interested in the partial derivative of with respect to , the terms of Eq. (2) that are either constant or not functions of can be ignored:
| (3) |
with . Using Eq. (3) in Eq. (1), we obtained:
| (4) |
where is the mobility coefficient of engulfment. To make the various parameters dimensionless, surface tension was rescaled as , chemical potential as , line tension as , and circumferential bending rigidity of the mother-cell and forespore as banerjee and (see Table S1 in ESI†) respectively, with MPa banerjee ; lan , m banerjee and . Since is fixed at the same value as (see Table S1 in ESI†), the last term in Eq. (4) effectively cancels out. Moreover, as the septum and forespore cell wall are initially assumed to be a single PG layer ojkic16 , , so has a minor contribution to the engulfment dynamics (Fig. S1f in ESI†). As and are not well-constrained by experiments, we scanned through these parameters.
We first investigated the conditions of and that favor engulfment. For engulfment to occur, energy must be released into the environment, i.e. , allowing to increase from to the maximum . As evident from Eq. 3, engulfment is favored when , i.e. when the chemical potential for PG remodeling is greater than the surface tension (Fig. 3a). Thus, there is competition between and , where favors engulfment, whereas represents an energy penalty for engulfment (both parameters are assumed positive). The more negative is, the easier it is to overcome the energy barrier for engulfment. Engulfment is favored when (Fig. 3b). This is because is multiplied by , and decreases as increases and engulfment proceeds. In fact, if is sufficiently large, engulfment may occur even for positive (Fig. 3c). It may seem strange that engulfment is favored by a positive line tension , because a tension represents an energy penalty. However, engulfment forces are about changes in energy, and engulfment reduces the penalty from the line tension due to decreasing radius . Hence, Figs. 3a-b show that engulfment is driven by both growth () and line tension (). In the ESI†, we also varied , and found that deviation from the preferred radius has limited effect on the plot for (Fig. S1c in ESI†).
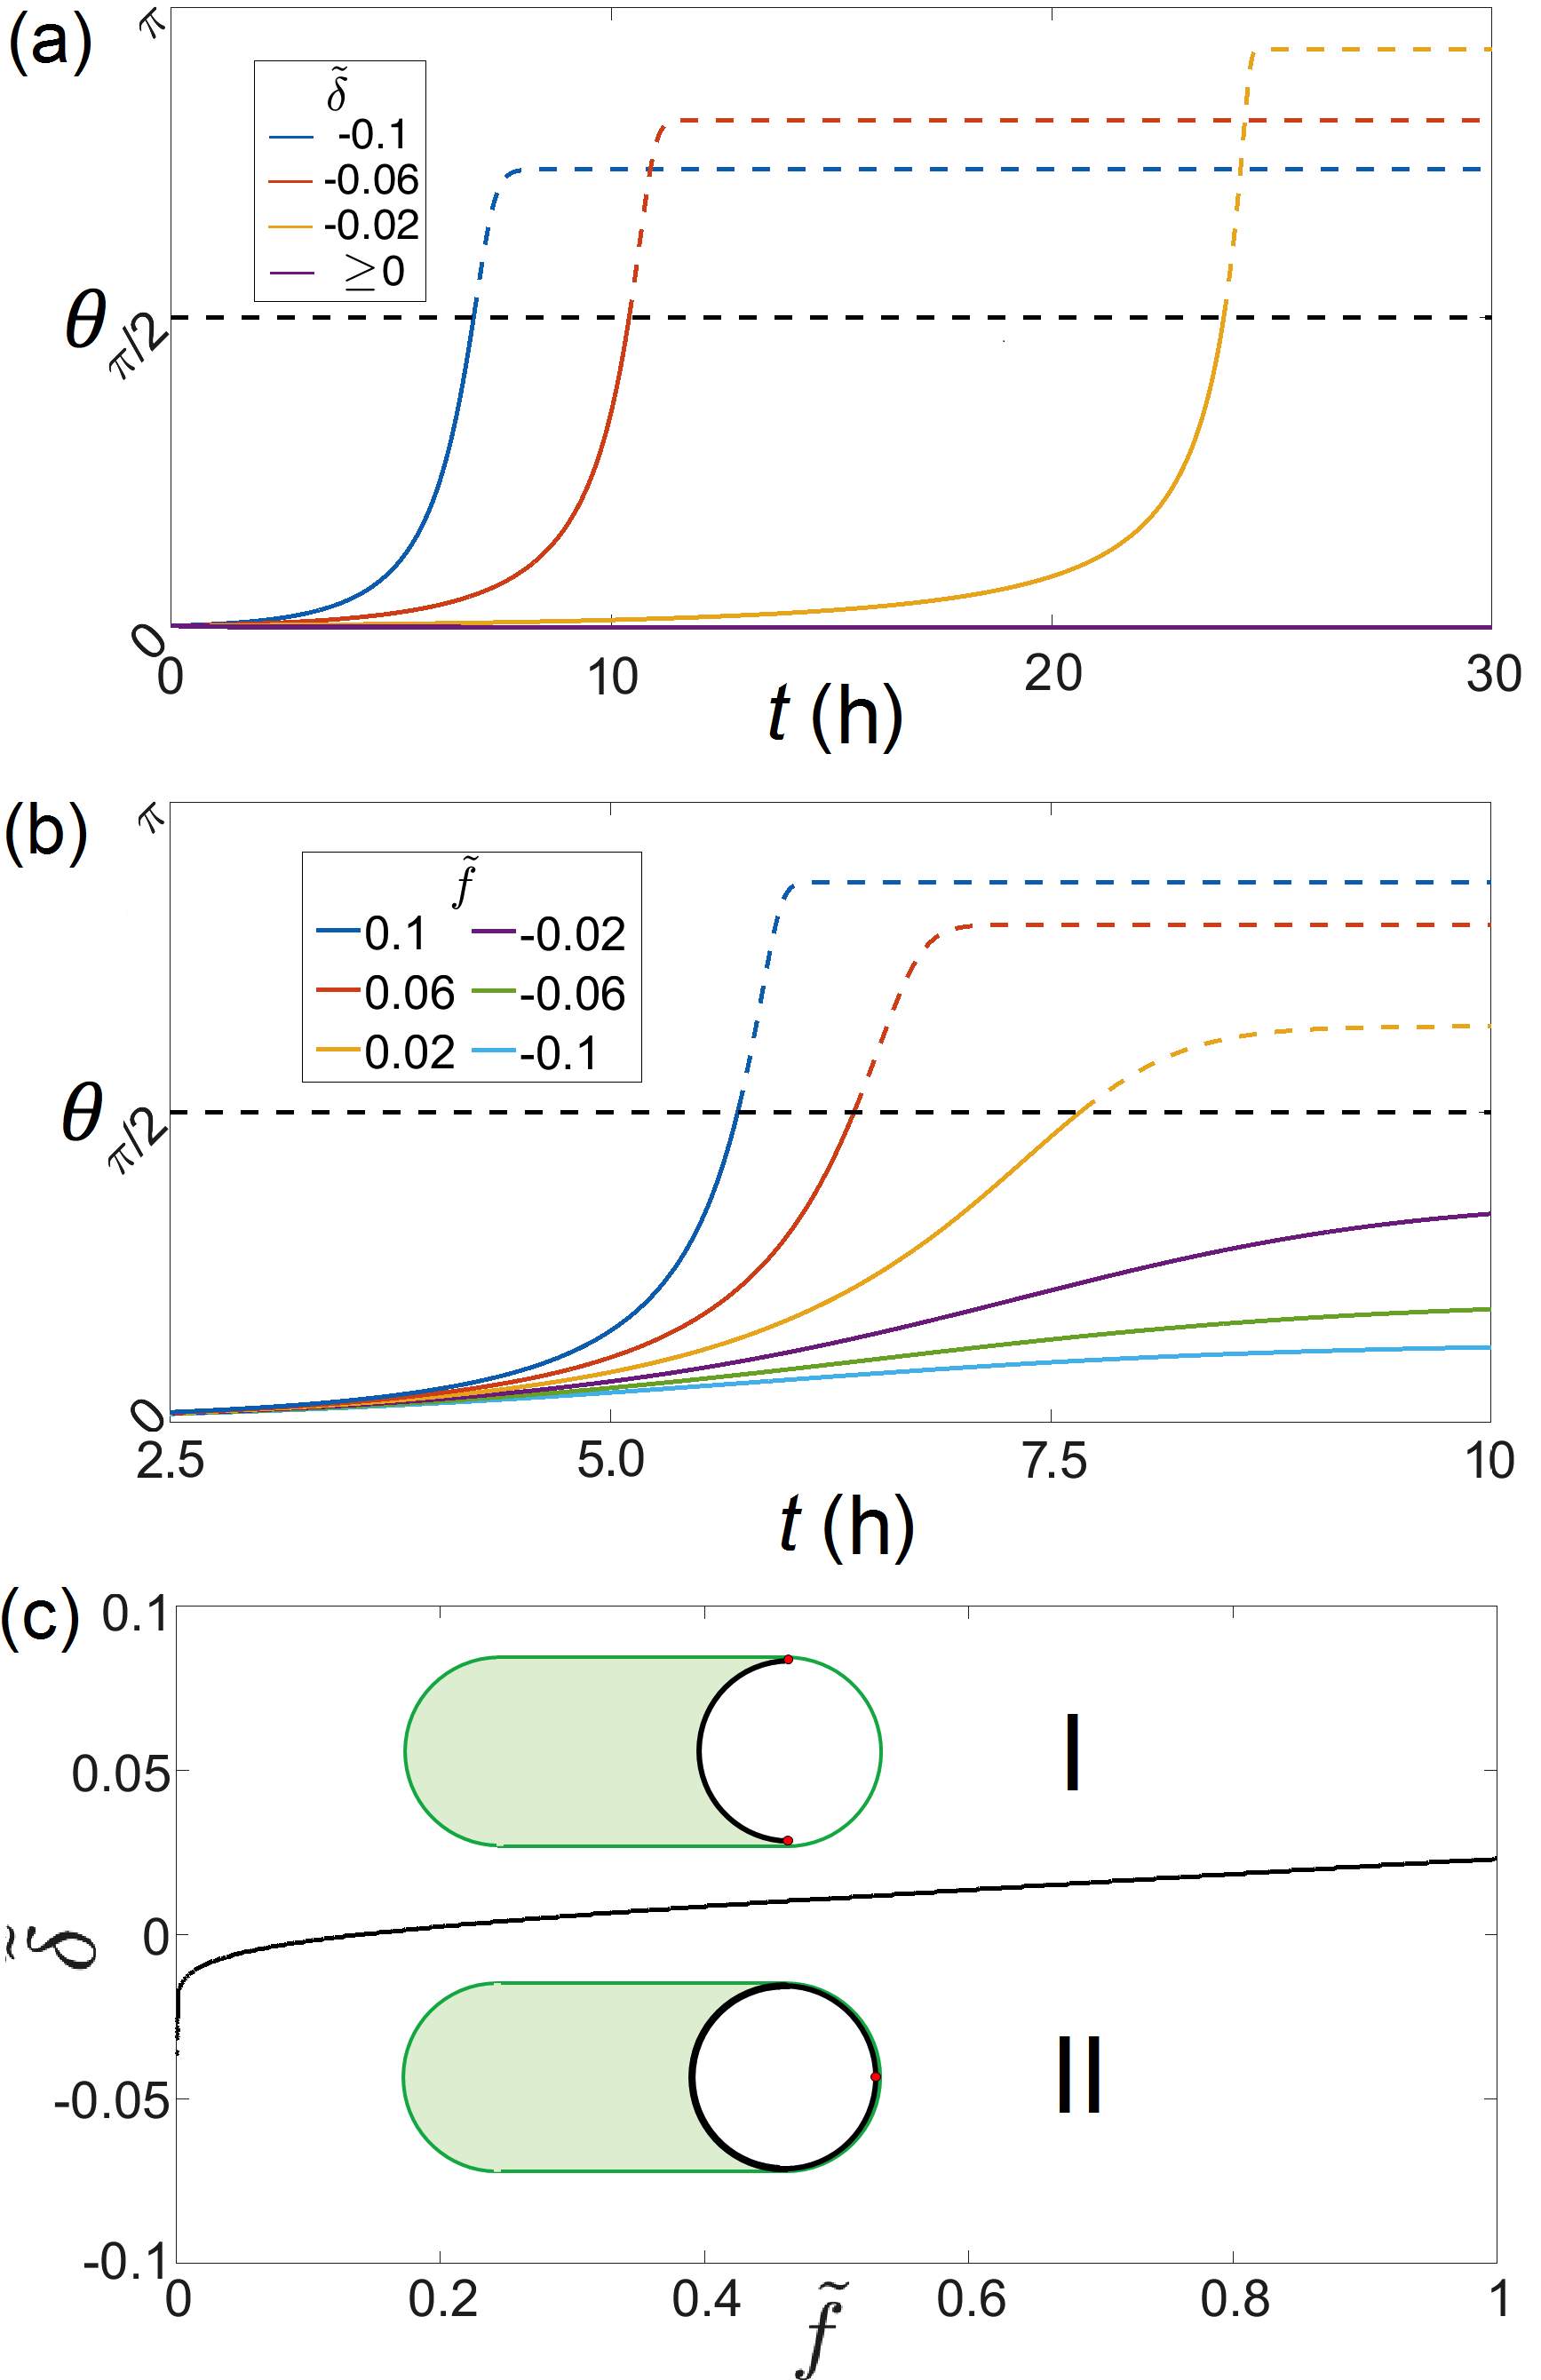
We analytically verified the steady-state angles of engulfment (Figs. 3a-b) using Eq. 4. The lower steady state () is in fact the initial , which increases over time towards the upper steady state (). Although engulfment is completed when , the upper steady state might be greater than . In fact, is undefined, so only in the absence of line tension () will the steady state be exactly . This implies excess energy in the cell wall when engulfment is complete. The larger the difference between and the upper steady state, the higher the engulfment rate at (Figs. 3a-b). This excess energy might be used to promote membrane fission doan .
Linear stability analysis was conducted for all values of and in the ensemble plots (Figs. 3a-b) to determine stability at both steady states using . If , the perturbation () grows exponentially, indicating unstable equilibrium, whereas if , dampens out, indicating stable equilibrium strogatz . Note that , which indicates a need for energy consumption at . We found that there is instability at small (near ) and stability at , which explains the increase in over time. To analyze the stability of the lower steady state further, we take the limit of in Eq. 4, leading to , where engulfment proceeds for , i.e. . Hence, synthesis is required to get engulfment started.
The mother cell synthesizes considerable amounts of membrane, also required for compartment-specific expression of transcription factors pedrido ; tan . To study the effect of membrane synthesis on the cell wall, we extended the minimal model in the ESI† to include the membrane surface areas (Fig. S1b in ESI†). Assuming that the chemical potentials for synthesizing the cell wall and membrane are the same, the value of in the ordinate axis of the phase diagram (Fig. 3c) is effectively reduced, so that it is easier for cells to be in Region II in which engulfment occurs. Whilst this seems counter-intuitive as additional membrane synthesis is required (a cost), we assumed that there is sufficient energy available to drive membrane synthesis. This implies that engulfment actually relieves this drive or ‘pressure’.
REALISTIC MODEL OF ENGULFMENT
In reality the septum is initially flat, so that the forespore is hemispherical prior to engulfment tocheva ; meyer . Over time, the septum becomes increasingly curved as the forespore expands into the mother cell to form a hemispheroid joined to the initial hemisphere. Hence, there might be competition between engulfment and forespore expansion for limited resources during starvation.
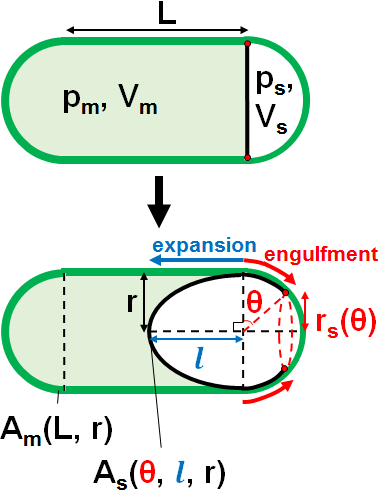
With mother-cell growth, there are four shape degrees of freedom: angle of engulfment, expansion of the forespore into the mother cell along its longitudinal axis, as well as the mother-cell radius and length (Fig. 4). The mother cell and forespore volumes are and , respectively. The forespore cell wall surface area is . The mother cell wall surface area , distance between leading edge of engulfing membrane and longitudinal axis, the surface area over which dissipation occurs during increase in , as well as the cell-wall bending energy , are the same as in the minimal model. Since , has a minor contribution to the engulfment dynamics, we neglect in order to remain having analytical expressions for the energies (further explained in Discussion and Conclusions). The surface area over which dissipation occurs during increase in is . The surface area over which dissipation occurs during increase in is . The surface area over which dissipation occurs during increase in is . With Eq. (2) for the sum of active and mechanical energies, we derived , , and (see ESI† for the complete formulae).
We initially assumed for simplicity that no resources are diverted to mother-cell growth due to starvation, so and are constant. This is consistent with previously published time-lapse microscopy data meyer ; ojkic16 , showing that the cell volume remains constant throughout engulfment. (Later, the mother cell is allowed to grow during sporulation, so that and increase simultaneously with and .) To make the various parameters dimensionless, surface tension and circumferential bending rigidity were rescaled as in the minimal model. The initial radius is set to banerjee , whilst the initial length was set to m, which is the average experimentally measured value sharpe .
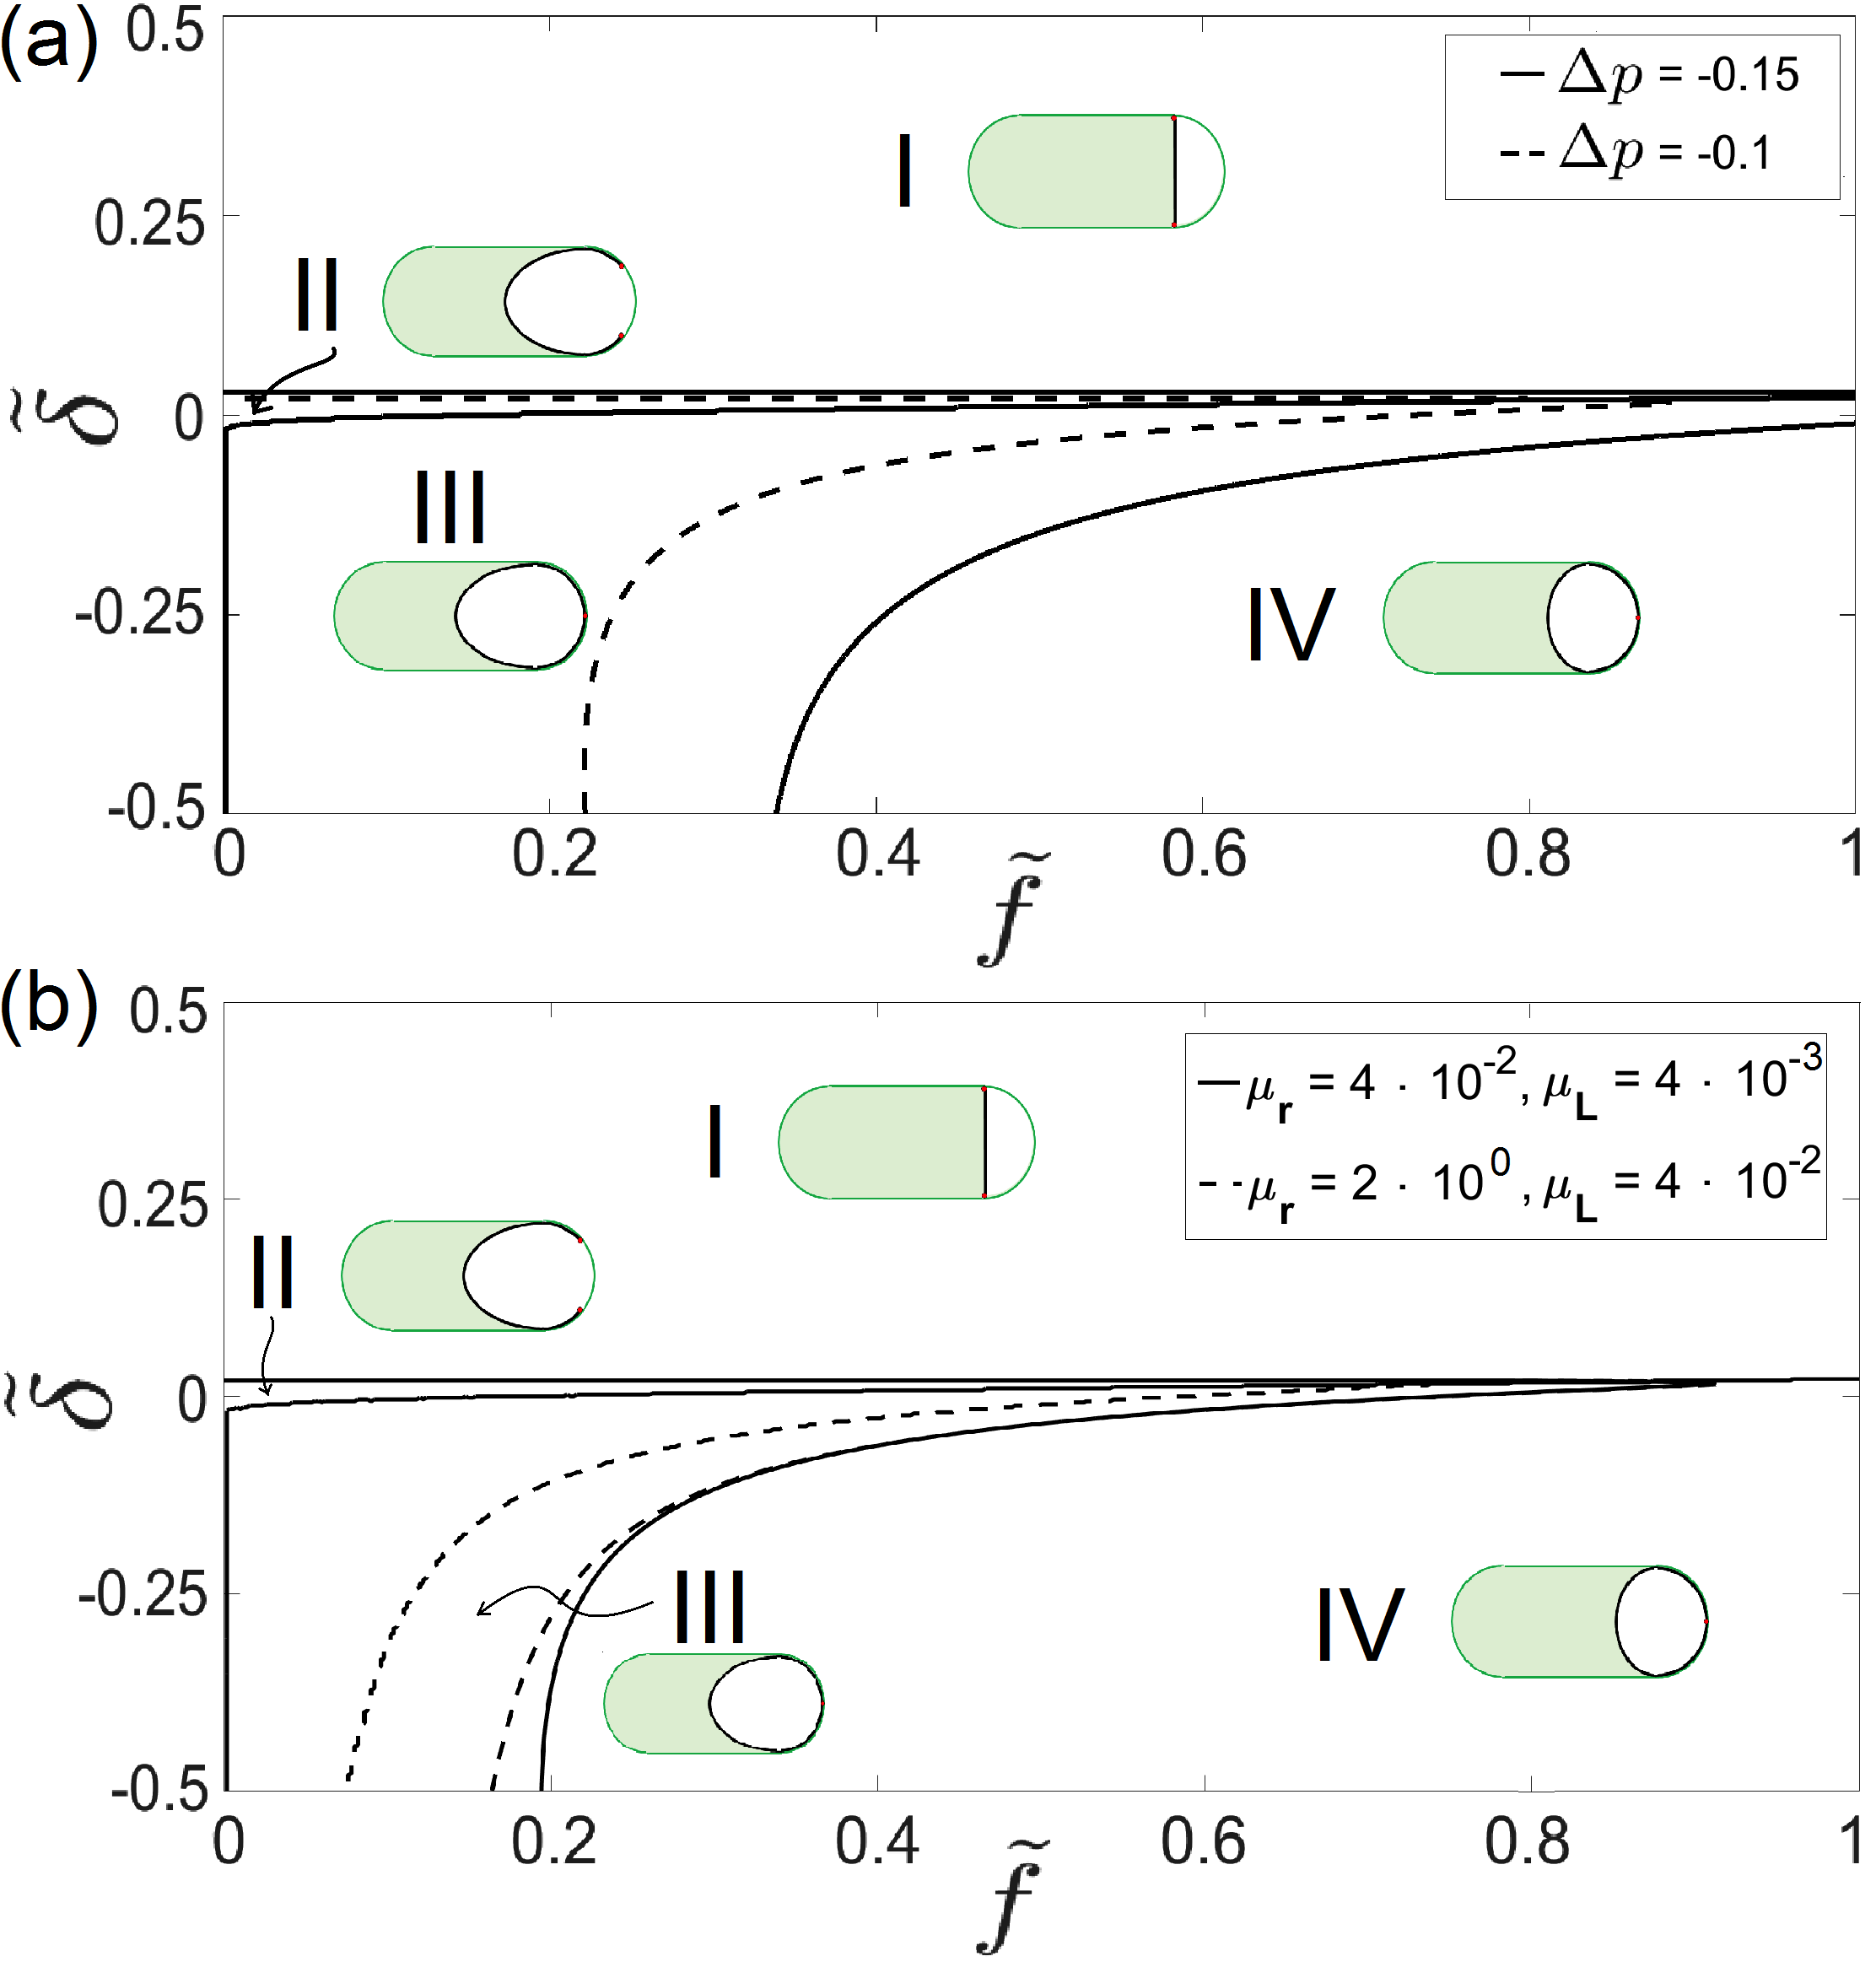
We investigated the conditions of turgor pressure that favor an increase in and . Phase diagrams were plotted for varying values of the pressure difference between the mother cell and forespore (Fig. 5a). The value of was set to , as in the original framework banerjee , and we chose banerjee . In the phase diagrams, there are four different regions where engulfment and/or forespore expansion are favored, but these regions have different sizes depending on . Region I represents the absence of both engulfment and forespore expansion. Region II represents the situation of incomplete engulfment (terminated at ) and excessive forespore expansion. Region III represents the situation where forespore expansion is completed before engulfment. Finally, Region IV represents the situation where forespore engulfment is completed without major forespore expansion.
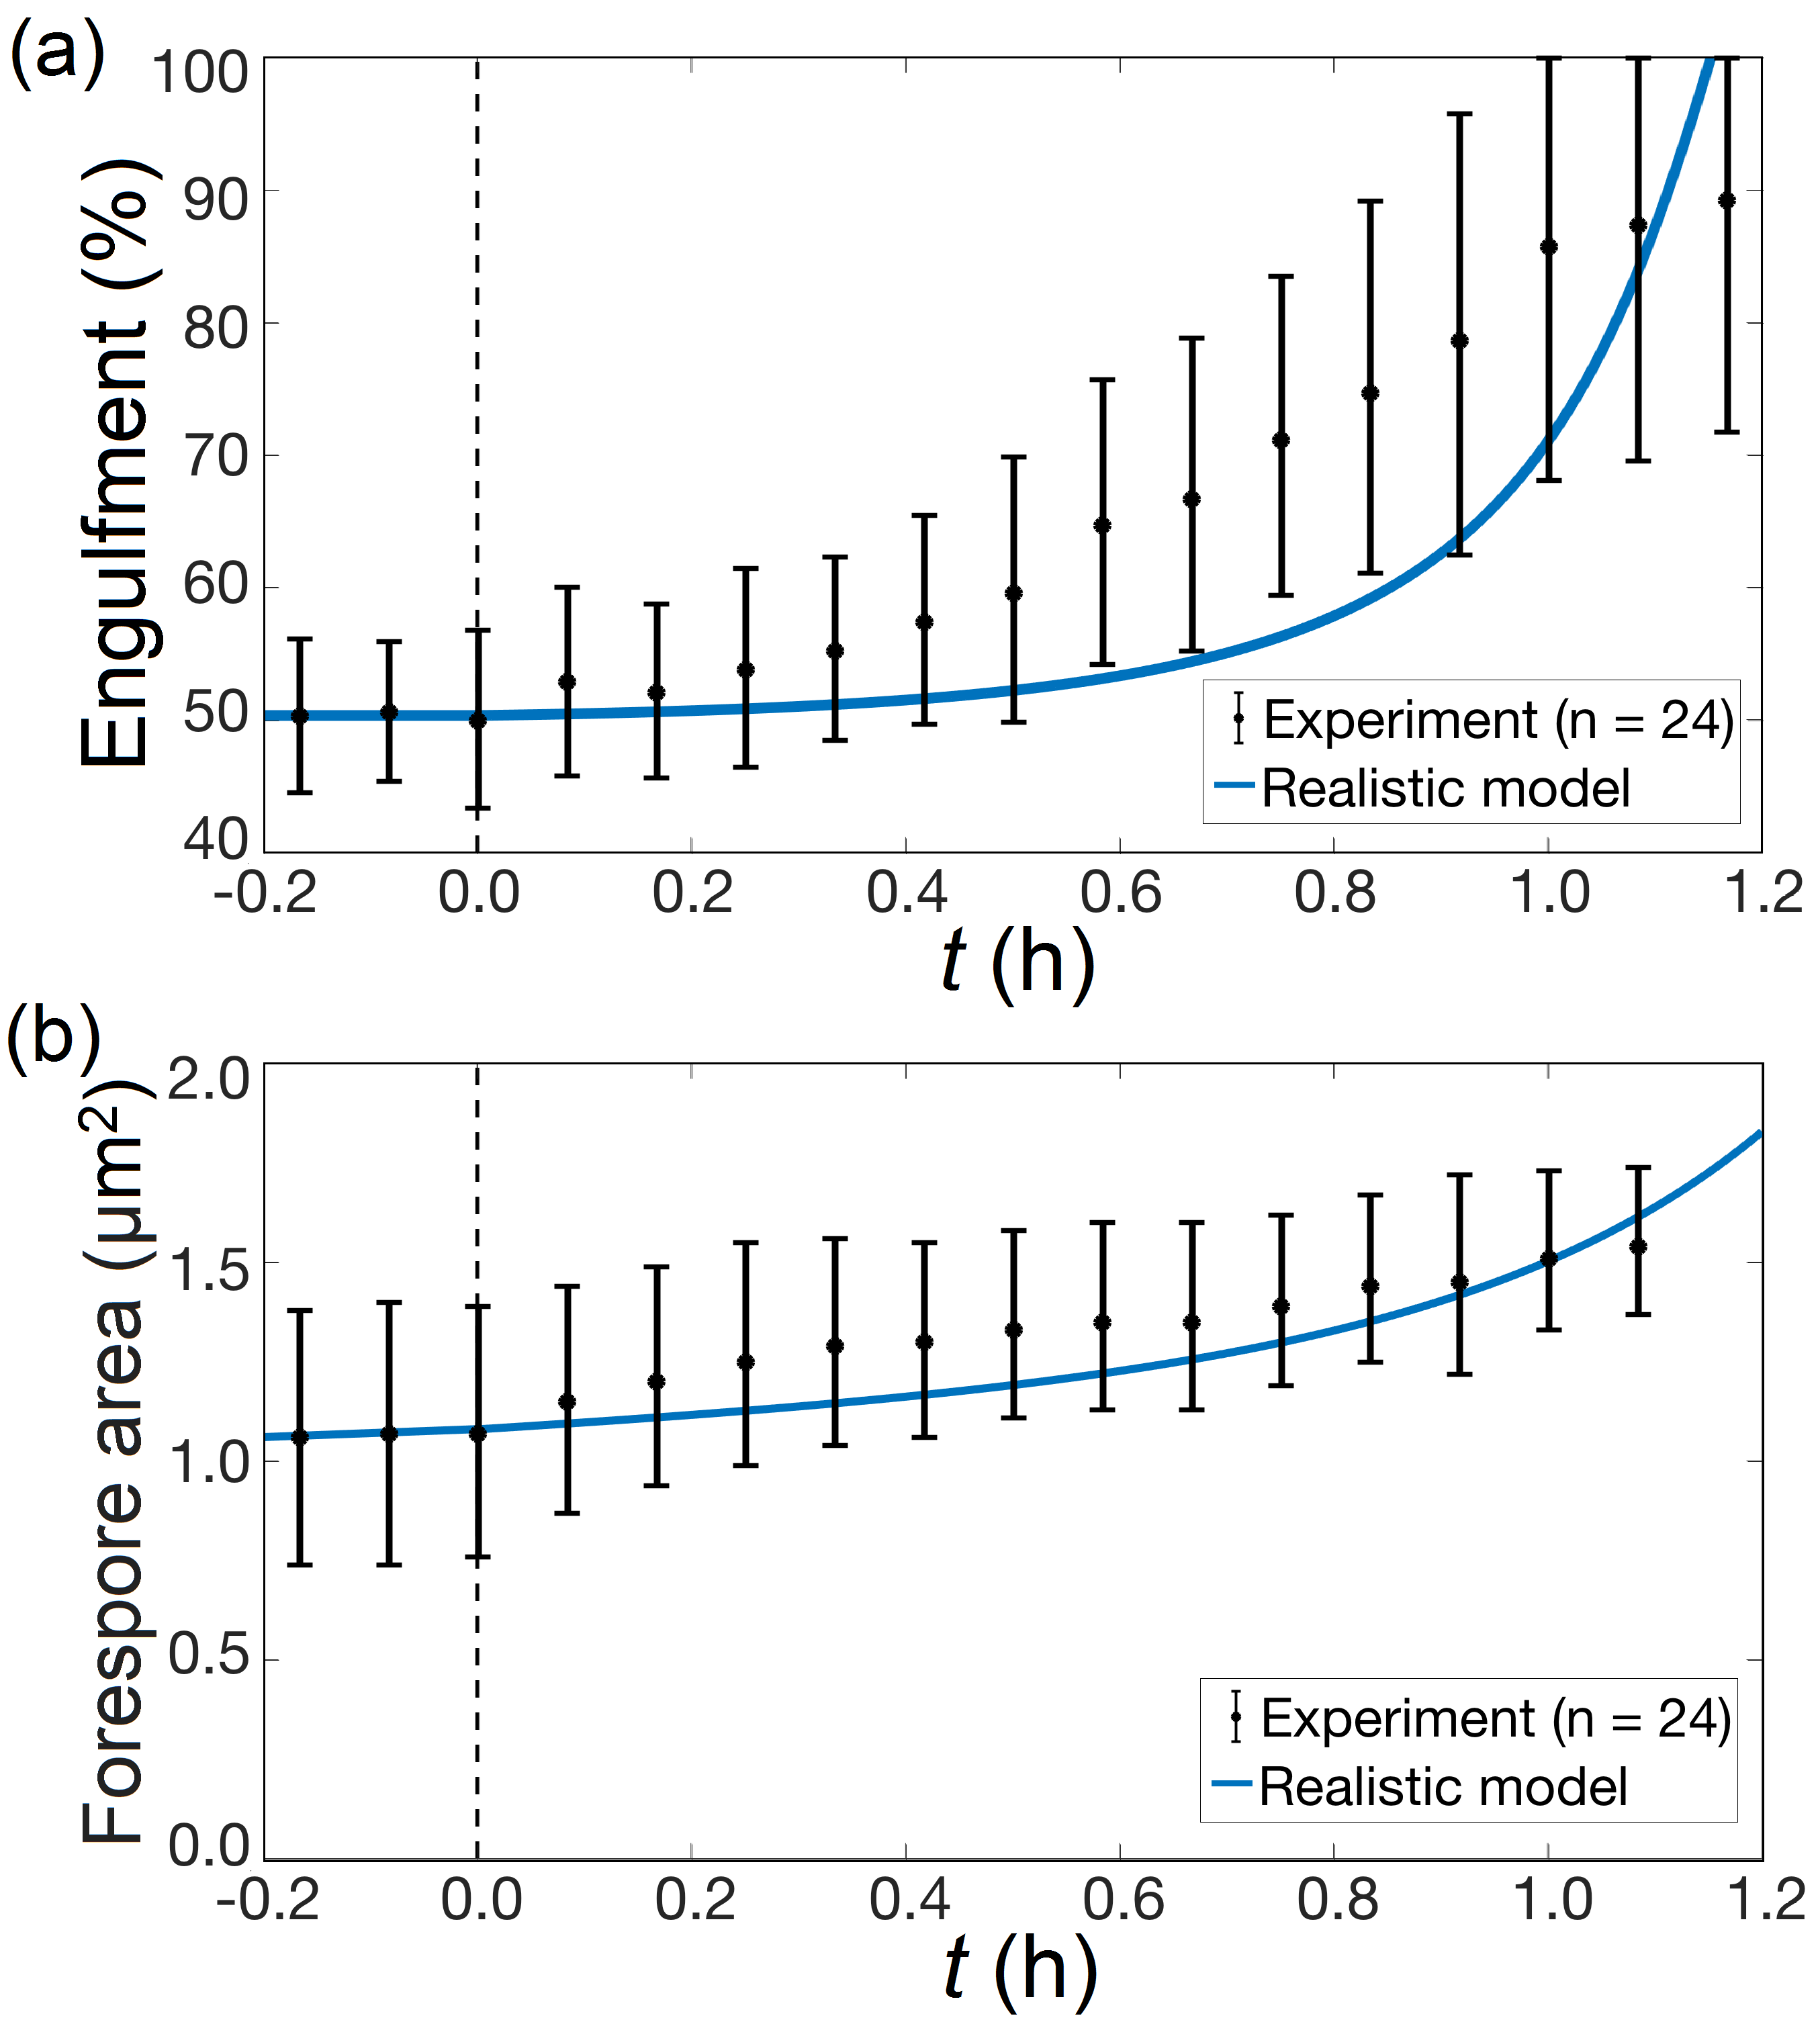
To understand which region in Fig. 5a might be physiologically relevant, we compared the model with time-lapse microscopy data ojkic16 . For , , and MPa, our realistic model matched experimental measurements of time-dependent engulfment and forespore surface area (Figs. 6a-b, see caption as well as Table S1 in ESI† for extracted parameter values). The experimental data ojkic16 only shows little increase in once engulfment is complete, so Region III represents the ideal set of parameter values for engulfment and forespore expansion. As decreases, Region III increases, whilst Region IV decreases (transition from dashed to solid lines). This confirms a previous hypothesis that the forespore expands because of higher osmolarity and in turn higher turgor pressure than in the mother cell stragier . Further support comes from the ensemble plot of for MPa (Fig. S2b in ESI†). The dashed lines in the ensemble plot show forespore expansion if allowed to continue after engulfment is complete, and for MPa, is predicted to increase sharply to the point of complete forespore expansion only after engulfment is complete. This, taken together with the experimental data ojkic16 , suggests that MPa.
Linear stability analysis of again shows instability at small (near ) and stability at , which explains the increase in over time. Linear stability analysis of shows that small (near ) is unstable for but stable for MPa, so the sharp increase in occurs earlier when MPa (Fig. 3b). Interestingly, this sharp increase occurs even though the equilibrium is much more unstable at than at small , suggesting a need for energy for forespore expansion. Perhaps forespore expansion is driven by the utilization of limited energy resources in the cytoplasm freese . Furthermore, the instability at indicates excess energy in the cell wall, which might be used to promote forespore maturation eijlander .
For fixed and , we wondered how forespore shape influences engulfment. For that purpose, we compared the engulfment dynamics of the realistic (with fixed and ) and the minimal model (see ESI†). Indeed, as differing only by forespore shape, we found that both models yield nearly the same engulfment dynamics for the same set of parameter values, e.g. the same plot for is produced by the minimal and the realistic model for and (Figs. S2a and S2c in ESI†).
Finally, we investigated whether engulfment and/or forespore expansion would still be favored if and are allowed to increase simultaneously with and . Phase diagrams for different and were plotted for a constant in the () plane, using the same values of and as before (Fig. 5b). Here, and are the mobility coefficients of radial and longitudinal growth, respectively. Notably, if , then the phase diagram is the same as in Fig. 5a, since .
For large values of and , mother-cell growth is significant, leading to a significant increase in Region II and a significant decrease in Region III (Fig. 5b, dashed lines). Thus, there is a higher chance that engulfment is not completed. Hence, significant growth is detrimental to sporulation, potentially because a large amount of chemical potential is required for PG remodeling. If this chemical potential is diverted to mother-cell growth, then there would not be enough resources for engulfment or forespore expansion, in line with sporulation being a starvation response. However, for small values of and , mother-cell growth is limited and leads to only a slight decrease in Region III and no increase in Region II (solid lines). Thus, the inhibition of engulfment by growth is limited. Although rod-shaped bacteria like B. subtilis usually grow longitudinally rather than radially angert , our model predicts similar behavior of and as compared to the original framework banerjee , especially for MPa. This can be seen from the plot for , which increases slightly and reaches a plateau (Figs. S3c and S4c in ESI†), as well as from the plot for , which increases linearly (Figs. S3d and S4d in ESI†), whilst engulfment is not yet complete. That we re-obtain similar behavior of and is remarkable given that the original framework does not account for sporulation.
DISCUSSION AND CONCLUSIONS
Elucidating the dynamics of cell-wall remodeling is key to understanding the conditions that favor engulfment during sporulation in B. subtilis. With our model, we showed that it is energetically possible for PG remodeling to drive membrane migration and forespore expansion. Thus, PG likely arose before the evolution of sporulation as the latter is a consequence of PG biochemistry tocheva16 . To promote sporulation, PG remodeling is surprisingly aided by a line tension and a turgor-pressure imbalance in the mother cell and forespore compartments. Furthermore, significant mother-cell growth is detrimental to sporulation, as it diverts excessive energy resources from engulfment. How could these predictions be tested? Pressure could be measured in the mother cell and forespore by AFM indentation and fluorescence microscopy arnoldi ; deng . Indeed, packing of charged DNA in the small forespore may induce osmotic swelling in line with Region III garrido . High-throughput imaging could be used to test if some cells grow despite sporulation.
While predictive, our modeling is minimalistic and a number of simplifications were necessarily made. First, similar to earlier models banerjee ; jiang10 ; jiang ; jiang_rev , membrane energetics and dynamics were neglected. Indeed, as shown in Figs. S1a-b with the minimal model, membrane contributions are negligible (as long as there is sufficient energy available to drive membrane synthesis). Second, the detailed shape of the forespore cell wall is unknown. However, by comparing the spherical and spheroidal forespore shapes without mother-cell growth, the results from the ensemble plots for are very similar without qualitative differences (Figs. S2a and S2c in ESI†). Third, the cell-wall bending energy of the forespore was neglected in Section 3. As the septum and forespore are initially assumed to be a single PG layer ojkic16 , using a significantly smaller bending stiffness for the forespore in the minimal model shows that its contribution to engulfment is indeed minor, especially when does not grow by more than 5% (Fig. S1f in ESI†). Indeed, increases by 5% in the case of significant growth (Fig. S3c in ESI†) and by 3% in the case of limited growth (Fig. S4c in ESI†), justifying this model simplification.
Another model simplification concerns how the cell-wall surface energy is described. In Eq. (2) we assumed a constant surface tension , with the area energy given by , where is the total cell-wall area of mother cell and forespore. This models a plastic cell wall, determined by growth amir . In contrast, elastic cell-wall deformations could be considered around the minimum-free energy surface area determined by Laplace law, where pressure, surface tension, and geometry are all connected. However, Laplace law does not lead to stable rod shapes koch , and in sporulation, the pressures in mother cell and forespore are likely different, which would lead to different radii in mother cell and forespore compartments. However, this has not been observed ojkic16 . Furthermore, rod-shaped bacteria in the original framework banerjee are modeled with a constant surface tension as well, leading to the same growth law as more detailed models with elastic strain jiang ; jiang_rev . Lastly, including a small non-linear elastic correction herant to our minimal model () has only minor effects on engulfment (Figs. S1d-e in ESI†). This is in line with previous studies involving microfluidics amir , which showed that B. subtilis cell-wall deformations during PG synthesis are usually plastic, whereas any elastic deformations tend to be transient and hence have little relation to growth. Taken together, our presented model provides insights while being minimal and conceptually straightforward to interpret.
We believe that our findings could aid the design of whole-cell radiation-biosensors, insecticides, probiotics, vectors for the delivery of drugs, vaccine antigens, or immunomodulators barak . Furthermore, some spore-forming bacteria constitute major health threats, such as Clostridium difficile and Bacillus anthracis ojkic16 , and our model may provide insights into preventing spore formation e.g. by influencing mother-cell growth, turgor pressure, or line tension. Indeed, our findings are of great interest to soft matter, because bacterial cell walls, like other biological systems, exhibit properties rarely found in condensed matter physics which are often caused by growth amir . Future work may incorporate the effects of stochasticity and molecular-scale defects for closer connection with molecular biology experiments banerjee ; ojkic16 .
ACKNOWLEDGEMENTS
We thank N. Ojkic for help with the modeling as well as J. López-Garrido, G. Salbreux, and S. Banerjee for helpful discussions. R.G.E. acknowledges financial support from the European Research Council Starting-Grant No. 280492-PPHPI and the Biotechnology and Biological Sciences Research Council Grant No. BB/I019987/1.
Present address: Department of Biosystems Science and Engineering (D-BSSE), ETH Zürich, Switzerland. Email: liwei.yap13@alumni.imperial.ac.uk
Email: r.endres@imperial.ac.uk
Electronic Supplementary Information (ESI) available. See DOI: 10.1039/b000000x/
References
- (1) S. Banerjee, N. F. Scherer, and A. R. Dinner, Soft Matter 12, 3442 (2016).
- (2) J. Errington, Nat. Rev. Microbiol. 1, 117 (2003).
- (3) A. W. Bisson-Filho, Y.-P. Hsu, G. R. Squyres, E. Kuru, F. Wu, C. Jukes, Y. Sun, C. Dekker, S. Holden, M. S. VanNieuwenhze, et al., Science 355, 739 (2017).
- (4) J. H. Levine, M. E. Fontes, J. Dworkin, and M. B. Elowitz, PLoS Biol. 10, e1001252 (2012).
- (5) J. Narula, A. Kuchina, D.-Y. D. Lee, M. Fujita, G. M. Süel, and O. A. Igoshin, Cell 162, 328 (2015).
- (6) E. I. Tocheva, J. López-Garrido, H. V. Hughes, J. Fredlund, E. Kuru, M. S. VanNieuwenhze, Y. V. Brun, K. Pogliano, and G. J. Jensen, Mol. Microbiol. 88, 673 (2013).
- (7) P. Meyer, J. Gutierrez, K. Pogliano, and J. Dworkin, Mol. Microbiol. 76, 956 (2010).
- (8) T. Doan, J. Coleman, K. A. Marquis, A. J. Meeske, B. M. Burton, E. Karatekin, and D. Z. Rudner, Genes Dev. 27, 322 (2013).
- (9) A. Typas, M. Banzhaf, C. A. Gross, and W. Vollmer, Nat. Rev. Microbiol. 10, 123 (2011).
- (10) N. Ojkic, J. López-Garrido, K. Pogliano, and R. G. Endres, PLoS Comput. Biol. 10, e1003912 (2014).
- (11) A. J. Meeske, C. D. A. Rodrigues, J. Brady, H. C. Lim, T. G. Bernhardt, and D. Z. Rudner, PLoS Biol. 14, e1002341 (2016).
- (12) A. A.-D. Mello, Y.-L. Sun, S. Aung, and K. Pogliano, Genes Dev. 16, 3253 (2002).
- (13) L. Rayleigh, Proc. Math. Soc. (London) 4, 357 (1873).
- (14) M. E. Pedrido. P. de Oña, W. Ramirez, C. Leñini, A. Goñi, and R. Grau, Mol. Microbiol. 87, 348 (2013).
- (15) H. Jiang and S. X. Sun, Phys. Rev. Lett. 105, 028101 (2010).
- (16) H. Jiang, F. Si, W. Margolin, and S. X. Sun, Biophys. J. 101, 327 (2011).
- (17) S. X. Sun and H. Jiang, Biophys. J. 75, 543 (2011).
- (18) N. Ojkic, J. López-Garrido, K. Pogliano, and R. G. Endres, Elife 5, e18657 (2016).
- (19) G. Lan, C. W. Wolgemuth, and S. X. Sun, Proc. Natl. Acad. Sci. USA 104, 16110 (2007).
- (20) S. H. Strogatz, Nonlinear dynamics and chaos: with applications to physics, biology, chemistry, and engineering (Addison-Wesley Publishing Company, 1994), 1st. ed.
- (21) I. S. Tan and K. S. Ramamurthi, Environ. Microbiol. Rep. 6, 212 (2014).
- (22) M. E. Sharpe, P. M. Hauser, R. G. Sharpe, and J. Errington, J. Bacteriol. 180, 547 (1998).
- (23) P. Stragier and R. Losick, Annu. Rev. Genet. 30, 297 (1996).
- (24) E. Freese, J. M. Lopez, and E. B. Freese, Initiation of bacterial and yeast sporulation by partial derivation of guanine nucleotides. In: Regulation of Macromolecular Synthesis by Low Molecular Weight Mediators (Academic Press, Inc., 1979), 1st ed.
- (25) R. T. Eijlander, A. de Jong, A. O. Krawczyk, S. Holsappel, and O. P. Kuipers, Nucleic Acids Res. 42, D685 (2014).
- (26) E. R. Angert, Nat. Rev. Microbiol. 3, 214 (2005).
- (27) E. I. Tocheva, D. R. Ortega, and G. J. Jensen, Nat. Rev. Microbiol. 14, 535 (2016).
- (28) M. Arnoldi, M. Fritz, E. Bäuerlein, M. Radmacher, E. Sackmann, and A. Boulbitch, Phys. Rev. E 62, 1034 (2000).
- (29) Y. Deng, M. Sun, and J. W. Shaevitz, Phys. Rev. Lett. 107, 158101 (2011).
- (30) J. López-Garrido, N. Ojkic, K. Khanna, F. R. Wagner, E. Villa, R. G. Endres, and K. Pogliano, (under review in Cell) preprint: https://www.mendeley.com/sneak-peek/cellpress/#79360d0c-36ea-4e29-b227-efaee3617ff7 (2017).
- (31) A. Amir, F. Babaeipour, D. B. McIntosh, D. R. Nelson, and S. Jun, Proc. Natl. Acad. Sci. USA 111, 5778 (2014).
- (32) A. L. Koch, J. Gen. Microbiol. 128, 2527 (1982).
- (33) M. Herant, V. Heinrich, and M. Dembo, J. Cell Sci. 119, 1903 (2006).
- (34) I. Barák, E. Ricca, and S. M. Cutting, Mol. Microbiol. 55, 330 (2005).