Spin dynamics of FeGa3-xGex studied by Electron Spin Resonance
Abstract
The intermetallic semiconductor FeGa3 acquires itinerant ferromagnetism upon electron doping by a partial replacement of Ga with Ge. We studied the electron spin resonance (ESR) of high-quality single crystals of FeGa3-xGex for from 0 up to 0.162 where ferromagnetic order is observed. For we observed a well-defined ESR signal, indicating the presence of pre-formed magnetic moments in the semiconducting phase. Upon Ge doping the occurrence of itinerant magnetism clearly affects the ESR properties below K whereas at higher temperatures an ESR signal as seen in FeGa3 prevails independent on the Ge-content. The present results show that the ESR of FeGa3-xGex is an appropriate and direct tool to investigate the evolution of 3d-based itinerant magnetism.
1 Introduction
FeGa3 is expected to be a nonmagnetic, narrow-gap semiconductor with a gap of eV that originates from a strong hybridization of the Fe d and Ga p atomic orbitals [1, 2]. Doping with Ge leads to an evolution of a metallic magnetic state which for low Ge substitutions shows properties of an antiferromagnetic -electron heavy fermion system. At a critical Ge-concentration of ferromagnetic (FM) order sets in and three-dimensional quantum critical FM fluctuations are indicated by 71Ga nuclear quadrupole resonance (NQR) relaxation data [3]. FeGa3-xGex serves as a rare platform in which heavy fermions occur in the vicinity of a FM quantum critical point with pronounced three-dimensional FM fluctuations.
Yet, the nature and evolution of the magnetic order is not clear. Models with itinerant magnetism as well as the local moment scenario are discussed. Density functional theory (DFT) calculations show that itinerant ferromagnetism (possibility a Stoner mechanism) can be produced by electron- (or hole-) doping of FeGa3 (independent on the presence of pre-formed moments in FeGa3) [4].
However, the magnetic moments are not evenly distributed throughout all Fe atoms as expected in an itinerant picture. The magnetic moments introduced by Ge are found to be distributed on the Fe atoms in a complex, strongly Ge-concentration dependent way and it is under strong discussion if all Fe moments are itinerant or if some stay localized [5]. This may also explain that the mainly ferromagnetic magnetic ordering display a minor AFM component which leads to clear differences in field cooled / zero field cooled magnetization.
Therefore, experimental methods sensitive to the local Fe environment are desirable. Muon spin rotation (SR) and Mössbauer spectrocopies provided evidence for a continuous evolution of magnetic order from short-range below and near the critical concentration to long-range for higher Ge-concentrations [6]. Moreover, the SR data show that the distribution of the Ge on the two Ga sites in this host strongly determines the character of the magnetic order, confirming the results of DFT calculations [5].
The technique of electron Spin Resonance (ESR) is like NQR another microscopic probe for magnetism. It has proven to provide direct access to the spin dynamics of many ferromagnetic metals, i.e. itinerant magnets where the magnetism arises from conduction electrons. In general, a conduction electron spin resonance (CESR) in itinerant magnets shows a narrow and observable linewidth in the presence of ferromagnetic correlations. This holds, in particular, for Kondo lattice systems like YbRh2Si2 and CeRuPO [7] but also for 3d itinerant magnets such as ZrZn2 [8, 9], Sc3.12In [10], TiBe2 [11], or NbFe2 [9, 12]. Recently, the interplay between a CESR and ferromagnetism was investigated for Cr2B where a paramagnetic to ferromagnetic transition is induced by Fe-doping [13]. Without ferromagnetic correlations the CESR linewidth is mainly determined by spin-flip scattering which also determines the electrical resistivity.
In this paper we could interpret the spin resonance in FeGa3-xGex in a dual way: at low temperatures and in terms of a CESR with strong ferromagnetic correlations and at high temperatures in terms of a resonance of local spins.
2 Experimental
Electron Spin Resonance (ESR) probes the absorbed power of a transversal magnetic microwave field as a function of an external magnetic field . To improve the signal-to-noise ratio, a lock-in technique is used by modulating the static field, which yields the derivative of the resonance signal d/d. The ESR experiments were performed at X- and Q-band frequencies (=9.4 GHz and 34 GHz) using a continuous-wave ESR spectrometer. The sample temperature was set with a helium-flow cryostat allowing for temperatures between 2.7 and 300 K and a nitrogen-gas flow cryostat for temperatures up to 500 K.
The obtained spectra were fitted by a Lorentzian line shape yielding the parameters linewidth which is a measure of the spin-probe relaxation rate, and resonance field which is determined by the effective -factor ) and internal fields. The fitting included also a dispersion-to-absorption ratio from metallic contributions, as was done for the ESR spectra in the ferromagnetic metal NbFe2 [12]. parametrizes an asymmetry in the lineshape. refers to ESR spins within the microwave skin depth which is smaller than the sample thickness due to the electrical conductivity. The ESR intensity corresponds to the integrated ESR absorption and was calculated using the line amplitude, line width and D/A as reported in reference [14]. is determined by the static spin-probe susceptibility, i.e. it provides a microscopic probe of the sample magnetization.
High-quality, ultrapure single crystals of FeGa3 and FeGa3-xGex were grown by the Czochralski method from Ga-rich solutions at temperatures below the peritectic transformation. Whereas for FeGa3 the crystal growth has already been described elsewhere [15] the problem with FeGa3-xGex was the missing ternary Fe-Ga-Ge phase diagram. We assumed an only weak change of the liquidus by adding small amounts of Ge (bulk, 99.999%, ChemPur) and did a couple of normal freezing experiments in order to determine the solid-phase compositions being in equilibrium with various ternary Ga-rich solutions. From this, we found a pseudobinary segregation coefficient resulting in a slight axial increase of the Ge content along the growth direction. Starting in three Czochralski growth runs with ternary solutions in which 2.35, 5.0, and 5.75 % of the Ga was substituted with Ge, we got FeGa3-xGex single crystals in the range . All Czochralski-grown crystals were pulled along the [001] direction using undoped FeGa3 seeds and very low pulling rates of 0.05 to 0.1 mm/h. The ESR experiments on FeGa3-xGex were performed on pieces cut from these crystals showing an axial Ge-concentration gradient. This gradient was determined by electron probe microanalysis (WDX). We studied samples with x = 0, 0.06, 0.127, 0.133, and 0.162.
3 Results
The observed ESR in FeGa3-xGex shows two different and independent types of spectra, one with and one without dispersive (i.e. metallic) contribution. The metallic type appears only for higher Ge concentrations () and only for temperatures below K. The other type of signal is very weak (compared to the first type) and is seen above K (for above 5 K) up to the highest investigated temperature of 500 K. The presence of these two different spectra types indicates the complex way magnetism is created in FeGa3-xGex which is a topic that recently came into focus [5]. In the following we present and discuss the ESR spectra for undoped FeGa3 and the effect of Ge doping on the spectra.
3.1 FeGa3
Typical ESR spectra in the high and low temperature regime are shown in the left frame of figure 1 together with fits by Lorentzian lines which result in temperature dependent parameters as shown in the right frame of figure 1. The spectra consist of two well-defined resonance lines, a broad and a narrow one, denoted as line 1 and line 2. The narrow line appears at temperatures below K whereas the broad one is observable in the whole temperature range 5-300 K. Both lines appear at resonance fields corresponding to a -value of 2.05 This indicates a configuration 3 (Fe3+) rather than 3 (Fe2+) for which, due to contributions from the orbital momentum, a much larger g-value is expected [16].

We interpret the narrow line 2 as a resonance of Fe-impurity centers because its intensity is very small ( times weaker than line 1, note the intensity scale in figure 1) and line 2 is not reproducible in samples from different batches.
Regarding line 1 it is important to note that very similar lines are also observed in the Ge-containing FeGa3 (see the following section). This particularly holds for the temperature dependencies of all ESR parameters as shown in the right frame of figure 1 where the dashed lines refer to the Ge-concentration x=0.127. For both x=0 and x=0.127 (and all the other Ge-concentrations, see figure 2) a continuous increase of and decrease of is observed towards low temperatures (discussion in the following paragraph). The ESR intensity shows a clear Curie law which indicates the local character of the ESR-active probes.
At high temperatures a remarkable kink in linewidth and intensity occurs. It originates from an additional line superimposed on line 1 as indicated by the blue arrow in figure 1. Near above K this line dominates the single-Lorentzian line fitting. With further heating this additional line gets narrower and less intense which both is characteristic for paramagnetic centers near magnetic order. Thus the appearance of this spectral feature suggests the onset of magnetic order near below 400 K of some of the paramagnetic centers. This conclusion is consistent with neutron diffraction measurements which indicate antiferromagnetic order in FeGa3 above 300 K [17]. The presence of Fe-rich foreign phases like Fe3Ga4 with its magnetic transition at 360 K [18] should also be taken into account to understand features at high temperatures.
3.2 FeGa3-xGex
A partial substitution of Ga by Ge leads to a strong change in the magnetic properties of FeGa3 (see the phase diagrams in Refs. [3, 6]). Also, as illustrated in figure 2, the ESR properties change dramatically, namely for the higher concentrations a striking change appears in linewidth and resonance field at temperatures of K.

When cooling below this temperature we observed a remarkable crossover to a strong and narrow line developing out of the noisy and relatively weak high-temperature line. This crossover is most obviously seen in the linewidth but also, as shown in the lower insets of figure 2, in the resonance field and the dispersion-to-absorption ratio (D/A). The change in resonance field is strongest for x=0.162 which is the composition with the strongest ferromagnetic correlations [3, 6]. The change from a symmetric signal (D/A=0) to an asymmetric signal (D/A=1) demonstrates that the influence of the electrical conduction in the environment of the spin probe becomes important. Again it is the sample with the strongest ferromagnetic correlations, x=0.162, where a pronounced line asymmetry reaches up to the highest temperatures.
Above K the ESR lines and their properties seem to remain unchanged by Ge doping (compare Figs. 1 and 2 and note the common plot of parameters for x=0 (solid square) and x=0.127 (dashed line) in figure 1). With increasing temperature the linewidth continuously decreases in way agreeing well with a law (dashed line in figure 2). This behavior points towards a relaxation by spin fluctuations if they have a spin correlation rate [19] and the static susceptibility showing a local Curie law. A variation of this powerlaw behavior among the various Ge contents should be expected on the basis on NQR results on the spin correlation rate [3]. However, such a variation could not be resolved by our ESR linewidth data.
Regarding the weak temperature dependence of the resonance field above one might relate its origin to the temperature evolution of effective internal magnetic fields. The presence of such internal fields sounds most plausible for FeGa3 for which AFM order is suggested by our high-temperature ESR results (see section below).
For the compositions with the low-temperature ESR results are influenced by strong FM correlations and FM ordering. This is illustrated in greater detail in figure 3 where the linewidth and ESR intensity is compared with the DC magnetic susceptibility measured at the same samples. Broad linewidth maxima indicate a crossover to a low-temperature region with an intense, narrow and asymmetric ESR. As shown in the lower frame the temperature dependencies of both ESR intensity and susceptibility coincide roughly below temperatures where the linewidth displays a broad maximum. This demonstrates that in the low-temperature region the ESR probes the same bulk magnetic properties that determine the DC magnetic susceptibility.


Comparing the linewidth with the reciprocal susceptibility as shown in the upper frame of figure 3 suggests a direct relation between these quantities. Plotting vs. as shown in figure 4 further establishes such a relation which in turn is consistent with the properties of a CESR in spin systems with magnetic correlations. As was observed, for instance, in the itinerant ferromagnet ZrZn2 [8], a ’ferromagnetic slowing down’ of the relaxation rate (or ’exchange enhancement’ of the spin lifetime) [8, 20] strongly reduces the spin-orbit relaxation und thus leads to a narrow CESR linewidth with . This relation allows to check whether a power law behavior in for three-dimensional ferromagnetic quantum critical fluctuations [21] can be found in the ESR linewidth. Indeed, as shown in the inset of figure 3, taking into account a reasonable residual, temperature independent contribution , the linewidth temperature dependence for is consistent with . This power law is also reported for the NQR-probed dynamical susceptibility of the critical composition [3].
The inset of figure 4 illustrates for x=0.127 a characteristic hallmark of a CESR, namely a linear relation between the temperature dependencies of linewidth and electrical resistivity (). This behavior is similarly observed for the itinerant ferromagnets ZrZn2 and NbFe2 above magnetic ordering [9, 12].
The above discussed presence of an ’exchange enhancement’ implies that the influence of ferromagnetic correlations on the ESR linewidth should depend on the applied magnetic field. The so far presented ESR data were taken at GHz (X-band) that corresponds to a resonance at a field of T (figure 2). Using GHz (Q-band) with T one can expect a strengthened effect of the ferromagnetic correlations to the ESR parameters. This, indeed, could be observed as shown in figure 5. The low-temperature linewidth depends on both the Ge content and the resonance field (at X-, or Q-band). The stronger the ferromagnetic correlations, i.e. the larger the Ge content, the more clear are the effects on the linewidth.

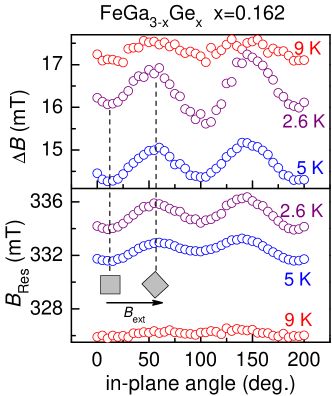
The linewidth is quite obviously related to the Ge content (see figure 3) which determines the formation of ferromagnetism in a delicate way. Muon spin rotation results indicate short range ferromagnetic order for a Ge content larger than [6]. The weak increase of the linewidth for at low temperatures evidences long-range ferromagnetic order which leads to pronounced anisotropies in the ESR parameters as shown in figure 6. The crystal was rotated around the crystallographic -axis and a clear anisotropy with a 90 degree periodicity was found only for temperatures below the ferromagnetic ordering temperature K. Mössbauer spectroscopy results [6] have demonstrated that the ordered moments are aligned in the plane perpendicular to the crystallographic -axis. Thus, the observed anisotropies shown in figure 6 are indeed a consequence of FM magnetic ordering and point out that the observed line actually is a ferromagnetic resonance mode.
3.3 High temperature properties.
Neutron scattering measurements on FeGa3 suggested antiferromagnetic order at temperatures above 300 K [17]. We therefore investigated the ESR properties of FeGa3-xGex for temperatures between 300 K up to 500 K. It is also in this temperature region where upon heating the electrical resistivity starts to decrease (activated behavior with gap eV, Refs.[15, 17]) and the susceptibility shows a continuous increase [17, 22].
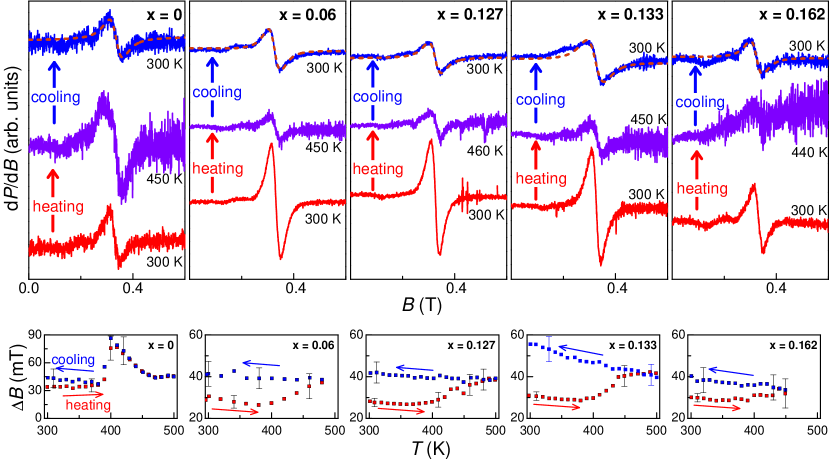
By heating the FeGa3-xGex samples up to 500 K and cooling them back to 300 K we observe a remarkable “heat effect” on the ESR spectra. As shown in figure 7 this heating-cooling cycle irreversibly changes the ESR of Ge-containing FeGa3-xGex whereas the ESR properties of pure FeGa3 can be fully recovered. The ESR properties of Ge-containing FeGa3-xGex seem to change upon heating towards properties which are very similar to those of pure FeGa3: the intensity as well as the linewidth approach values of FeGa3. This observation allows the conclusion that Ge doping strenghtens the high-temperature ESR signal in FeGa3. However, the ESR properties of FeGa3-xGex below 40 K (i.e. the CESR) are not influenced at all from such a heating-cooling cycle. This in turn means, that the Ge-ions have two possibilities to influence the ESR-probed magnetism. They contribute to a stable, heat-insensitive CESR and also to the ESR with properties as seen in the undoped FeGa3.
4 Discussion
The ESR results in FeGa3-xGex show a remarkable temperature behavior which strongly depends on the Ge content. The picture that evolves is characterized by a conduction spin resonance (CESR) developing at low temperatures and a local spin resonance at elevated temperatures.
Below temperatures of K and for we observed a well-defined and strong resonance in a conductive environment with typical asymmetric lineshapes. The resonant spinsystem may be interpreted as a CESR with the properties of a strongly coupled 3d – conduction electron system. The spin dynamics of this coupled system can be related to the resistivity and magnetization yielding information on the nature of interactions as was done for various other itinerant 3d ferromagnetic materials [10].
Two relaxation mechanisms for CESR in itinerant magnets are important namely the spin-lattice relaxation by spin-orbit coupling to transport collisions (characterized by the momentum scattering time which also determines the electrical resistivity) [23] and a reduction of the relaxation rate by exchange enhancement (characterized by the magnetization) [24]. Whether or not the temperature dependence of dominates the relaxation depends on how strong the exchange effect depends on temperature: the corrections introduced from the resistivity may be small compared to line width variations due to changes in magnetization, as observed in ZrZn2 [8, 9] or in Sc3.12In [25]. In TiBe2 the linewidth broadening can be interpreted as a variation in because there the exchange effect is constant also at high temperatures (only d-electron pockets in the Fermi surface contribute and the interaction strength to other electrons is small). In our case of FeGa3-xGex the low-temperature relaxation is clearly related to the inverse magnetization, see figure 4. Its relation to the electrical resistivity, see inset figure 4, points to a typical CESR property although the temperature independent part of the resistivity is considerable.
Above temperatures of K the resonance properties point to a local spin probe although pure FeGa3 is expected to be non-magnetic [26]. Preformed magnetic moments may arise from the presence of Fe-dimers in the structure [15] because their magnetic properties are very sensitive to the electronic environment [27] (being in turn affected by structural defects). Substituting some Ga by Ge stabilizes this magnetism and the high-temperature ESR spectra gain intensity without strongly changing their other parameters (see figure 2). Approaching the highest temperatures (500 K) the local spin resonance for FeGa3-xGex with irreversibly changes its properties in such a way that the ESR properties of pure FeGa3 are “recovered”. This observation implies that heating up to 500 K changes the way Ge-doped electrons are distributed in the lattice. As there are two different Ge-substitutable Ga sites [3, 6] it might be possible that heat shifts the Ge to a preferred site and this site would then have less influence on the Fe-dimer magnetism. The insensitivity of the low-temperature CESR to a heating-cooling cycle may indicate that the presence of itinerant spin probes does not depend on which of the two Ga sites are substituted by Ge.
5 Conclusion
The presented ESR studies confirm the rather complex microscopic formation of magnetism in FeGa3-xGex. Structural defects easily lead to residual Fe-moments which are the origin of the local-type ESR observed for temperatures above K. The ESR properties strongly depend on the substitution of Ga sites by Ge which leads to electron doping. This supports an itinerant type of resonance below K but it also leads to a stabilization of the local Fe-dimer magnetism, increasing the intensity of the local type of resonance.
The itinerant-type resonance can be interpreted as a conduction spin resonance (CESR) of a system with a strong coupling between 3d- and conduction electrons. Strong ferromagnetic correlations allow an exchange enhancement of the spin lifetime, thus leading to a narrow and well-observable CESR. This resonance should be an appropriate tool to investigate the evolution of ferromagnetic correlations close to the suggested ferromagnetic quantum critical point [3] in FeGa3-xGex.
Acknowledgements
We acknowledge valuable discussions with Raul Cardoso-Gil, Dmitry Sokolov and Hiroshi Yasuoka. B.K. was supported by the National Research Foundation of Korea funded by the Korean government (MSIT) (No.2016K1A4A4A01922028).
References
References
- [1] Yin Z P and Pickett W E 2010 Phys. Rev. B 82 155202
- [2] Arita M, Shimada K, Utsumi Y, Morimoto O, Sato H, Namatame H, Taniguchi M, Hadano Y and Takabatake T 2011 Phys. Rev. B 83 245116
- [3] Majumder M, Wagner-Reetz M, Cardoso-Gil R, Gille P, Steglich F, Grin Y and Baenitz M 2016 Phys. Rev. B 93 064410
- [4] Singh D J 2013 Phys. Rev. B 88 064422
- [5] Alvarez-Quiceno J C, Cabrera-Baez M, Ribeiro R A, Avila M A, Dalpian G M and Osorio-Guillén J M 2016 Phys. Rev. B 94 014432
- [6] Munevar J, Cabrera-Baez M, Alzamora M, Larrea J, Bittar E M, Baggio-Saitovitch E, Litterst F J, Ribeiro R A, Avila M A and Morenzoni E 2017 Phys. Rev. B 95(12) 125138
- [7] Krellner C, Förster T, Jeevan H, Geibel C and Sichelschmidt J 2008 Phys. Rev. Lett. 100 066401
- [8] Walsh W M, Knapp G S, L W Rupp J and Schmidt P H 1970 J. Appl. Phys. 41 1081
- [9] Förster T, Sichelschmidt J, Grüner D, Brando M, Kimura N and Steglich F 2010 J. Phys.: Conf. Ser. 200 012035
- [10] Shaltiel D 1988 Helv. Phys. Acta 61 505
- [11] Shaltiel D, Monod P and Felner I 1980 J. Physique Lett. 41 567
- [12] Rauch D, Kraken M, Litterst F J, Süllow S, Luetkens H, Brando M, Förster T, Sichelschmidt J, Neubauer A, Pfleiderer C, Duncan W J and Grosche F M 2015 Phys. Rev. B 91 174404
- [13] Arcon D, Schoop L M, Cava R J and Felser C 2016 Phys. Rev. B 93 104413
- [14] Wykhoff J, Sichelschmidt J, Lapertot G, Knebel G, Flouquet J, Fazlishanov I I, Krug von Nidda H A, Krellner C, Geibel C and Steglich F 2007 Science Techn. Adv. Mat. 8 389
- [15] Wagner-Reetz M, Kasinathan D, Schnelle W, Cardoso-Gil R, Rosner H, Grin Y and Gille P 2014 Phys. Rev. B 90(19) 195206
- [16] Abragam A and Bleaney B 1970 Electron Paramagnetic Resonance of Transition Ions (Oxford: Clarendon Press)
- [17] Gamża M B, Tomczak J M, Brown C, Puri A, Kotliar G and Aronson M C 2014 Physical Review B 89 195102
- [18] Mendez J H, Ekuma C E, Wu Y, Fulfer B W, Prestigiacomo J C, Shelton W A, Jarrell M, Moreno J, Young D P, Adams P W, Karki A, Jin R, Chan J Y and DiTusa J F 2015 Phys. Rev. B 91 144409
- [19] Cox D L 1987 Phys. Rev. Lett. 58 2730
- [20] Barnes S E 1981 Adv. Phys. 30 801
- [21] Mishra S G and Sreeram P A 1998 Phys. Rev. B 57 2188
- [22] Tsujii N, Yamaoka H, Matsunami M, Eguchi R, Ishida Y, Senba Y, Ohashi H, Shin S, Furubayashi T, Abe H and Kitazawa H 2008 J. Phys. Soc. Jap. 77 024705
- [23] Elliott R J 1954 Phys. Rev. 96 266
- [24] Fulde P and Luther A 1968 Phys. Rev. 175 337
- [25] Dunifer G L, Knapp G S and Corenzwit E 1970 J. Appl. Phys. 41 1075
- [26] Hadano Y, Narazu S, Avila M A, Onimaru T and Takabatake T 2009 J. Phys. Soc. Jap. 78 013702
- [27] Haldolaarachchige N, Prestigiacomo J, Phelan W A, Xiong Y M, McCandless G, Chan J Y, DiTusa J F, Vekhter I, Stadler S, Sheehy D, Adams P and Young D 2013 arXiv 1304 1897