High-fidelity entanglement between a trapped ion and a telecom photon via quantum frequency conversion
Matthias Bock***These authors contributed equally to this work , Pascal Eich, Stephan Kucera, Matthias Kreis, Andreas Lenhard,
Christoph Becher†††christoph.becher@physik.uni-saarland.de , and Jürgen Eschner‡‡‡juergen.eschner@physik.uni-saarland.de
Universität des Saarlandes, Fachrichtung Physik, Campus E2.6, 66123 Saarbrücken, Germany
Entanglement between a stationary quantum system and a flying qubit is an essential ingredient of a quantum-repeater network. It has been demonstrated for trapped ions, trapped atoms, color centers in diamond, or quantum dots. These systems have transition wavelengths in the blue, red or near-infrared spectral regions, whereas long-range fiber-communication requires wavelengths in the low-loss, low-dispersion telecom regime. A proven tool to interconnect flying qubits at visible/NIR wavelengths to the telecom bands is quantum frequency conversion. Here we use an efficient polarization-preserving frequency converter connecting 854 nm to the telecom O-band at 1310 nm to demonstrate entanglement between a trapped 40Ca+ ion and the polarization state of a telecom photon with a high fidelity of 98.2 0.2. The unique combination of 99.75 0.18% process fidelity in the polarization-state conversion, 26.5 external frequency conversion efficiency and only 11.4 photons/s conversion-induced unconditional background makes the converter a powerful ion-telecom quantum interface.
Introduction
Quantum repeaters that establish long-distance entanglement are essential tools in the emerging field of quantum communication technologies [1]. While proposals for memoryless repeaters exist (e.g. [2]), many currently pursued approaches require efficient, low-noise quantum memories as nodes that exchange quantum information via photonic channels [3]. Various atomic and solid-state systems have been identified as suitable quantum nodes, e.g. trapped ions [4, 5], trapped atoms [6, 7], color centers in diamond [8] or quantum dots [9, 10]. Their optical transitions, however, are –with few exceptions– located outside the wavelength regime between 1260 nm and 1625 nm, where telecom fibres afford low-loss transmission. Thus, there is a demand for interfaces connecting the telecom-wavelength regime and the visible/NIR range in a coherent way, i.e., preserving quantum information encoded in a degree of freedom of a single photon, such as its polarization.
Promising candidates for such interfaces are, e.g., non-degenerate photon-pair sources [11, 12, 13] or quantum frequency converters (QFC) [14]. The latter can be implemented either by four-wave mixing (FWM) using resonances in cold atomic ensembles [15, 16] or by a solid-state approach utilizing three-wave mixing in - or four-wave mixing in -nonlinear media [17]. It has been shown that -based QFC preserves nonclassical properties of single photons and photon pairs, such as second-order coherence [18, 19, 20], time-energy entanglement [21], time-bin entanglement [22], orbital angular momentum entanglement [23], polarization entanglement [24], and photon indistinguishability [25, 26]; furthermore, nonclassical correlations between telecom photons and spin waves in cold atomic ensembles [27, 28] have been demonstrated. Using near-resonant QFC based on FWM in an atomic ensemble, entanglement of a spin wave qubit with the polarization state of a telecom photon has been realized [16]. A corresponding implementation using solid-state QFC has remained an open challenge, despite being a highly desirable approach for its wavelength flexibility: while atomic ensembles are restricted to the particular transition wavelengths of neutral atoms, solid-state QFC can be adjusted to the system wavelength of other promising stationary quantum bits for quantum nodes, such as trapped ions, color centers in diamond or rare-earth ensembles. The main obstacle has been the strong polarization dependence of the -process and the high demands on efficiency and noise properties of the converter. Despite successful attempts to overcome the polarization dependency [24, 29, 30], the integration of a solid-state QFC device that fulfills all above mentioned requirements into a quantum node has not been achieved.
Single trapped ions are promising systems for quantum nodes, providing a very high level of control over their photonic interaction [5, 31, 32] and large coherence times [33, 34]; importantly, single-ion qubits are directly addressable and thus allow quantum information processing via high-fidelity quantum gates [35, 36]. In our work we connect a trapped-ion quantum node via QFC to the telecom regime in a coherent way, creating high-quality entanglement between the ion and a telecom photon. To this end, we generate entanglement between an atomic quantum bit in a single trapped 40Ca+ ion and the polarization state of a single photon at 854 nm. Subsequent polarization-preserving QFC to the telecom O-Band establishes high-fidelity entanglement between ion and telecom photon, which we verify by quantum state tomography.
Results
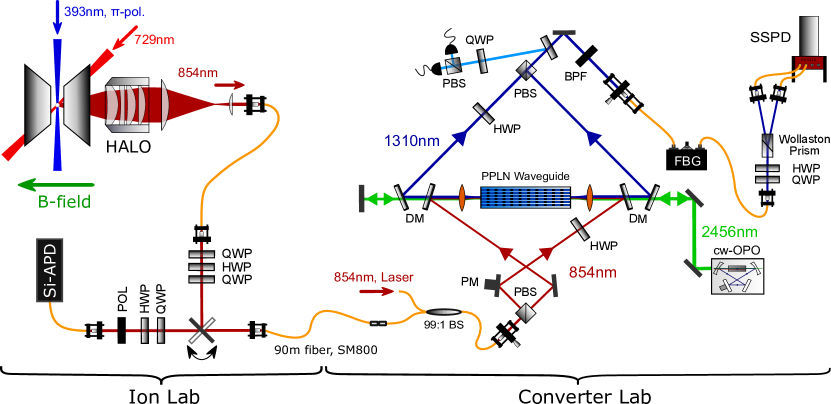
Ion-photon quantum interface. The ion-photon interface is shown in Fig. 1. A single 40Ca+ ion is confined in a linear Paul trap and laser-excited. Photons at 854 nm emitted along the quantization axis –defined by a magnetic field– are collected with 3.6% efficiency by a HALO (”High numerical-Aperture Laser Objective”, NA = 0.4) and coupled to a single-mode fiber with 39% efficiency (for details see methods section). Further details on the setup are found in earlier publications [31, 32, 37]. The experimental sequence to generate atom-photon entanglement is shown in Fig. 2a. Starting from the ground state , the ion is excited to the short-lived state with -polarized laser light at 393 nm. Spontaneous decay to leads to entanglement between the atomic states = and = and the emitted 854 nm photon in the polarization states and . For details on the sequence see Supplementary Note 1. Taking into account the Clebsch-Gordan coefficients (CGC) of the two transitions (see Fig. 2a), the ideal ion-photon state is
| (1) |
The experimentally generated ion-photon state is characterized by quantum-state tomo-graphy (see methods). The real and imaginary parts of the reconstructed density matrix are shown in Fig. 2b. From we deduce the fidelity , denoting the overlap between the generated and the ideal state, and the purity , a measure for the depolarization of the state. We find and . An upper bound of the fidelity for a given purity is = (1+) = 98.3% indicating that the fidelity is solely limited by depolarization and not by undesired unitary rotations of the state [11]. Depolarization is mainly caused by polarization-dependent loss in the optics behind the ion trap; minor contributions arise from non-perfect readout pulses and loss of atomic coherence. Calculating the overlap with a maximally entangled Bell state yields . The maximum possible value of for our state is 97% (for ), due to the asymmetric CGCs. Note that these numbers are calculated after subtraction of the detector dark counts, in order to characterize the functionality of our method. In a realistic repeater scenario these dark counts have to be included. Without background subtraction we deduce a purity and fidelities and . Even without background subtraction, all fidelities are many standard deviations above the classical threshold of 50%, as well as above the threshold of 70.7% necessary to violate Bell’s inequalities. The method to perform the background subtraction along with tables summarizing all fidelities and purities can be found in Supplementary Note 7 and Supplementary Tables 1,2 & 3.
![[Uncaptioned image]](/html/1710.04866/assets/x2.png)
With a sequence repetition rate of kHz, we obtain 236 generated (27.6 projected and detected) entanglement events/s, which compares well with other Ca+-ion systems [5]. One order of magnitude higher entanglement rates were reported in a Yb+-system, mainly due to a higher sequence repetition rate enabled by shorter cooling times and the use of ultrafast laser pulses [38]. Our signal-to-background ratio (SBR) is 29.5, solely limited by detector dark counts. A detailed account of the derivation of all numbers is given in Supplementary Notes 4 & 5.
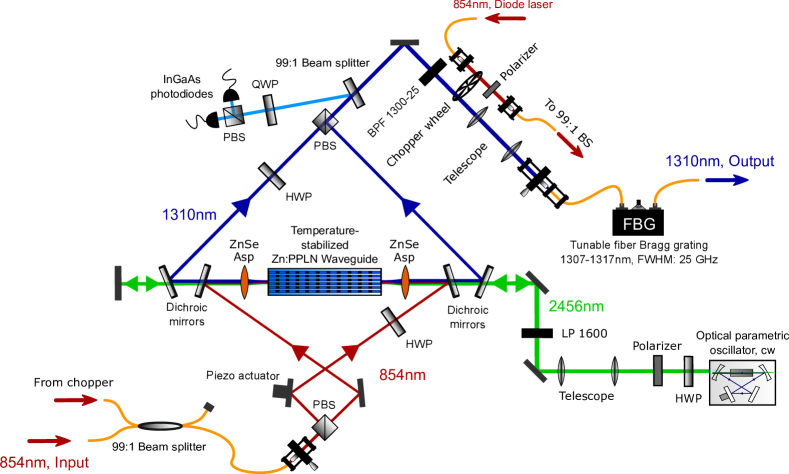
Polarization-preserving quantum frequency converter. The ion-trap setup is connected by 90 m of fiber to the converter setup, where the ion-entangled photons at 854 nm are converted to 1310 nm employing a periodically-poled lithium niobate (PPLN) ridge waveguide designed for the DFG-process - = . As shown in Fig. 1, the polarization selectivity of the DFG-process is overcome using a polarization interferometer: an arbitrary input state is split into H- and V-polarizations, a HWP rotates the H-polarization to the convertible V-polarization, and both are coupled via dichroic mirrors and zinc selenide aspheric lenses to the same waveguide from opposite directions. The V-polarized strong pump field at 2456 nm, generated by a home-built optical parametric oscillator (OPO, see methods) is aligned in double-pass configuration to facilitate conversion in both directions. The two converted polarizations are separated with dichroic mirrors from the other beams and superimposed on a second PBS after undoing the rotation from H to V with another HWP. To ensure faithful conversion of arbitrary input polarizations, the path length of the interferometer is actively stabilized by injecting light from a stabilized diode laser at 854 nm via a chopper wheel and a 99:1 beam splitter into the setup. A second 99:1 BS splits a part of the converted laser light from the photon path, with which we measure the path length difference (light blue beam path). Feedback on the path length is realized by a piezo actuator connected to one of the mirrors (PM). Spectral filtering of the converted light with a broadband bandpass filter (25 nm) and a narrowband fiber Bragg grating (25 GHz) suppresses the remaining pump light as well as noise arising from non-phase-matched nonlinear processes. With these two filter stages, the conversion-induced unconditional noise is reduced to 11.4 photons/s. The external conversion efficiency (defined as ”fiber-to-fiber” efficiency of the complete QFC device) of the two interferometer arms vs. the power of the pump field at 2456 nm, , is shown in Fig. 3a. The data points are described quite well by the theoretical curve [39]. However, the setup is not fully symmetric with respect to forward and backward conversion: due to losses in the optics behind the waveguide, the backwards-propagating pump power is lower, thus the curve of the V-polarized arm (red data points) is shifted to higher pump powers. Nevertheless, we identify a working point at the intersection of the curves, which ensures an equal conversion efficiency of 26.5% for H- and V-polarized light, which compares well with other QFC systems [18, 20, 22, 25, 30]. In order to verify that the converter preserves arbitrary input polarization states, we apply process tomography [40] using laser photons. We prepare four different input states {H,V,D,L} and measure the respective Stokes vectors of the output state. With that the process matrix in the Pauli basis, connecting the in- and output density matrices via = , is calculated (Fig. 3b). In the ideal case, possesses only a single non-zero entry denoting the identity operation. This entry can be identified as process fidelity, which in our case is = 99.75 0.18%, confirming very high-fidelity conversion of the input polarization state. The error in is deduced from a Poissonian distribution and arises from power fluctuations of the input and the pump field. Further details on the converter are given in the method section.
![[Uncaptioned image]](/html/1710.04866/assets/x3.png)
Ion-telecom-photon entanglement. To characterize the full quantum interface we investigate the performance of the combined ion-converter system: detecting the telecom output photons on a superconducting single-photon detector (SSPD) yields 43.5 generated (24.8 projected/detected) events/s with a SBR of 24.3. These numbers are in very good agreement with the previously determined conversion and detection efficiencies (see Supplementary Notes 4 & 5). Despite the loss in the conversion, the SBR is only weakly affected as we benefit from the detector’s higher efficiency and lower dark-count rate. The density matrix of the ion-photon state after conversion is depicted in Fig. 4a, yielding %, %, and = 94.8 0.2% after background subtraction. This result unambiguously verifies the entanglement between the ion and the telecom photon after QFC. The reduction of the fidelity by 0.6% compared to the unconverted ion-photon state is higher than what we expect from the process fidelity. We attribute this to power fluctuations of the pump laser and slow polarization drifts in the fiber connecting the setups. The background in these measurements has two contributions: a minor part of 6.5% due to conversion-induced noise and a major part of 93.5% stemming from detector dark counts (Supplementary Note 7). To quantify the influence of the converter on the final entangled state, it is useful to consider the case when only the detector part of the background is subtracted: we obtain , and , which confirms that the conversion-induced noise has only a minor influence on the final state. If no background subtraction is applied, we get , and .
![[Uncaptioned image]](/html/1710.04866/assets/x4.png)
Beyond the faithful QFC of ion-photon entanglement, the converter also renders possible the generation of maximally entangled states: we realize this by rotating the polarization of the 854 nm photons in a way that and correspond to the converter’s interferometer arms. Then we reduce the conversion efficiency of the arm by a factor of two to compensate the higher CGC, at the cost of one third of the photons. The resulting measured density matrix is displayed in Fig. 4b. The asymmetry in the diagonal elements disappeared, and we obtain %, (after subtraction of only detector dark counts: % and ; without background subtraction: %, ). Thus, within the error bars, we have created a Bell state between ion and telecom photon with the same purity as the initially generated state, which proves that the converter leaves the ion-photon entanglement practically unaltered. Note that fidelity and purity in this measurement run are also in accordance with the process fidelity, which we attribute to a slightly more stable operation of the converter.
Discussion
Our results demonstrate the operation of a complete quantum node that produces entangled states between a single trapped Ca+ ion and a fiber-coupled telecom photon with a high fidelity. This constitutes a step towards the implementation of a fiber-based repeater node consisting of two ions in remote traps. In future experiments, the entanglement generation rate might be enhanced with a cavity [5]. Furthermore, conversion to the telecom C-band at 1550 nm wavelength [30] shall be pursued for lower transmission losses enabling remote entanglement of ions over hundreds of kilometer fiber length. Moreover, spectral filters with narrower bandwidth combined with SSPDs with ultra-low dark-count rates [41] will lead to a much reduced background and higher SBR. Beyond these efforts, our techniques are transferable to a wide range of relevant platforms for quantum networks, such as other trapped-ion species (Yb+, Ba+), neutral atoms (Rb, Cs), color centers in diamond (NV-, SiV-), rare-earth ions in solids (Pr3+, Nd3+, Eu3+), or quantum dots. Eventually, this approach opens the possibility to implement hybrid networks by coupling different quantum systems via a common bus wavelength in the telecom regime [42].
Note added: Recently, we became aware of a related experiment by Ikuta et al. demonstrating entanglement between a cold atomic ensemble and a telecom photon via solid-state QFC [43].
Methods
Photon collection from the ion. Single 854 nm photons emitted from the ion are collected by an in-vacuum high-numerical-aperture laser objective (HALO, Linos) with numerical aperture NA = 0.4 at a working distance of 13 mm from the ion, covering about 4% of the full solid angle. Collection efficiencies for photons emitted on the and transitions are given by the dipole emission pattern. Orienting the quantization axis along the ion-HALO axis, the unnormalized polarization states of the emitted radiation are for and for , where and are the spherical polar and azimuthal angles of the direction of emission and and are their respective spherical-coordinate unit vectors [4]. Thus, the collection of photons emitted on the transition is suppressed due to the single-mode fiber coupling, while the collection efficiency for the transitions sums up to 6% with respect to spontaneous emission into full space. Taking into account the CGCs for - and -decay, the resulting collection probability for emission is . The single-mode–fiber coupling accounts for an additional factor of 39%, resulting in a total collection efficiency %
OPO system at 2456 nm. We employ a home-built continuous-wave optical parametric oscillator (OPO) delivering 1 W of single-mode, single-frequency output power at 2456 nm as pump source for the DFG process [44]. The OPO is pumped by a diode laser at 1081 nm (Toptica DL Pro) amplified with a Yb-doped fiber amplifier (LEA Photonics) with 15 W maximum output power. The OPO consists of a 40 mm long periodically poled LiNbO crystal with 7 poling periods ( = 31.7m … 32.7m) inside a signal-resonant bow-tie ring cavity. Tuning of the idler wavelength from 2310 nm to 2870 nm is achieved by changing the poling period, the crystal temperature or the cavity length via a piezo actuator. With this tuning range, we are able to cover the whole telecom O-band from 1260 nm to 1360 nm with the frequency converter. During the experiment, the OPO was operated at 2456 nm using a poling period of = 32.6m at a temperature of 49∘C.
Polarization-preserving frequency converter. The input light is overlapped with a diagonally polarized stabilization laser at 854 nm in a fiber beam splitter with a transmission of 99% for the input and 1% for the stabilization. Behind the PBS we split the orthogonal polarization components, the H-polarization is rotated to the convertible V-polarization with a HWP. Both beams are coupled to the ridge waveguide via dichroic mirrors and aspheric zinc selenide (ZnSe) lenses with focal lengths of 11 mm and broadband anti-reflective (AR) coatings for all three wavelengths. The 40 mm long Zn:PPLN waveguide chip (NTT Electronics) with lateral dimensions of 9 x 16m consists of 12 ridge waveguides with 6 different poling periods = 22.60m … 22.85m (operating point: = 22.70m, = 31∘C) and AR-coatings for all wavelengths. The chip is temperature-stabilized and mounted on a 5-axis translation stage to achieve optimal mode-matching. The pump field at 2456 nm generated by the OPO is guided free-space to the converter. The beam passes a HWP and a rutile polarizer for power control, a 1600 nm long-pass filter used for clean-up and a telescope made of two AR-coated spherical CaF-lenses to achieve best possible coupling to the waveguide’s fundamental spatial mode. The transmitted pump field is back-reflected by a mirror and recoupled to the waveguide to enable conversion in both directions. The converted light at 1310 nm is separated from the pump field with further dichroic mirrors, the former H-polarized light is back-rotated with a HWP, and both arms are superimposed with another PBS. A bulk 99:1 beam splitter separates a part of the light for the path-length stabilization. Variation of the path length causes a phase change between H and V polarization, which is measured with a QWP at 22.5∘, a PBS and two photo diodes. From the two photo diode signals we calculate the contrast , which serves as a power-independent error signal for the PID lock. The feedback on the path length is applied with a piezo actuator (PM) mounted beneath one of the mirrors. In the output arm a bandpass filter (BPF, central wavelength: 1300 nm, bandwidth: 25 nm, Edmund optics) is followed by a chopper wheel, blocking alternatingly the stabilization laser and the photons, and another telescope to mode-match the beam to the fiber. Fiber coupling is realized with an AR-coated aspheric lens (f=8 mm, Thorlabs). As a narrowband spectral filter a fiber Bragg grating (FBG, central wavelength tunable from 1307–1317 nm, linewidth: 25 GHz, Advanced optical solutions GmbH) is utilized. A drawing of the complete setup and the characterization of the converter as well as a detailed analysis of the efficiencies and losses is found in Supplementary Notes 2 & 3.
Quantum state tomography. To perform quantum state tomography, ion and photon are projected onto all 36 combinations of eigenstates of the Pauli operators , and , where represents the eigenbases (/ for the photon and / for the ion) and / the superpositions of the latter. To compare the results with and without the frequency converter, we use two tomography setups for the projective measurement of the 854 nm and telecom photons (see Fig. 1). The tomography setup for 854 nm is inserted into the beam path via a flip mirror and consists of QWP, HWP, polarizer and a silicon APD. The APD (SPCM-AQR-14, Perkin Elmer) has a quantum efficiency of = 30% and a dark-count rate of photons/s. The tomography setup for 1310 nm is realized with QWP, HWP, Wollaston prism and two commercial fiber-coupled superconducting-nanowire single-photon detectors (SSPD, Single Quantum). The quantum efficiencies and dark counts for SSPD1 (SSPD2) are 70(2)% (62(2)%) and 58.7 (56.4) photons/s, respectively. All waveplates are motorized and controlled via an Ethernet link to enable remote control of the complete experiment. The atomic state is analyzed with a combination of coherent pulses on the quadrupole transition at 729 nm and the RF-transition between the -states followed by fluorescence detection (details see Supplementary Note 1). From these measurements, the density matrix is calculated via linear state reconstruction combined with a maximum-likelihood estimation (see Supplementary Note 6).
Data availability
All relevant data are available from the corresponding author on request.
Acknowledgements
We thank Benjamin Kambs, Philipp Müller and Jonas Becker for helpful discussions. This work was financially supported by the German Federal Ministry of Science and Education (Bundesministerium für Bildung und Forschung (BMBF)) within the project Q.com.Q (Contract No. 16KIS0127).
Author Contributions
M.B. and P.E conducted the experiments and analyzed the data with help from S.K.. M.B. and A.L. constructed the frequency converter, P.E. and M.K. implemented the ion-photon entanglement sequence. S.K. developed a software toolbox for the state reconstruction. J.E. and C.B. conceived and supervised the project. M.B., P.E., J.E. and C.B. wrote the manuscript with input from all authors.
Competing Financial Interests
The Authors declare no Competing Financial or Non-Financial Interests.
References
- [1] Briegel, H.-J., Dür, W., Cirac, J.I. & Zoller, P. Quantum Repeaters: The Role of Imperfect Local Operations in Quantum Communication. Phys. Rev. Lett. 81, 5932–5935 (1998).
- [2] Munro, W.J., Stephens, A.M., Devitt, S.J., Harrison, K.A. & Nemoto, K. Quantum communication without the necessity of quantum memories. Nat. Phot. 6, 777-781 (2012).
- [3] Sangouard, N., Simon, C., de Riedmatten, H. & Gisin, N. Quantum repeaters based on atomic ensembles and linear optics. Rev. Mod. Phys. 83, 33-80 (2011).
- [4] Blinov, B. B., Moehring, D.L., Duan, L.- M. & Monroe, C. Observation of entanglement between a single trapped atom and a single photon. Nature 428, 153–157 (2004).
- [5] Stute, A. et al. Tunable ion–photon entanglement in an optical cavity. Nature 485, 482–485 (2012).
- [6] Volz, J. et al. Observation of Entanglement of a Single Photon with a Trapped Atom. Phys. Rev. Lett. 96, 030404 (2006).
- [7] Ritter, S. et al. An elementary quantum network of single atoms in optical cavities. Nature 484, 195–200 (2012).
- [8] Togan, E. et al. Quantum entanglement between an optical photon and a solid-state spin qubit. Nature 466, 730–734 (2010).
- [9] De Greve, K. et al. Quantum–dot spin–photon entanglement via frequency downconversion to telecom wavelength. Nature 491, 421–425 (2012).
- [10] Gao, W.B., Fallahi, P., Togan, E., Miguel-Sanchez, J., & Imamoglu, A. Observation of entanglement between a quantum dot spin and a single photon. Nature 491, 426–430 (2012).
- [11] Bussières, F. et al. Quantum teleportation from a telecom–wavelength photon to a solid–state quantum memory. Nat. Phot. 8, 775–778 (2014).
- [12] Seri, A. et al. Quantum Correlations between Single Telecom Photons and a Multimode On-Demand Solid-State Quantum Memory. Phys. Rev. X 7, 021028 (2017).
- [13] Lenhard, A. et al. Telecom-heralded single-photon absorption by a single atom. Phys. Rev. A 92, 063827 (2015).
- [14] Huang, J. & Kumar, P. Observation of quantum frequency conversion. Phys. Rev. Lett. 68, 2153–2156 (1992).
- [15] Radnaev, A. G. et al. A quantum memory with telecom wavelength conversion. Nat. Phys. 6, 894-899 (2010).
- [16] Dudin, Y. O. et al. Entanglement of Light-Shift Compensated Atomic Spin Waves with Telecom Light. Phys. Rev. Lett. 105, 260502 (2010).
- [17] Li, Q., Davanco, M., & Srinivasan, K. Efficient and low-noise single-photon-level frequency conversion interfaces using silicon nanophotonics. Nat. Phot. 10, 406-414 (2016).
- [18] Zaske, S. et al. Visible-to-Telecom Quantum Frequency Conversion of Light from a Single Quantum Emitter. Phys. Rev. Lett. 109, 147404 (2012).
- [19] Ates, S. et al. Two-Photon Interference Using Background-Free Quantum Frequency Conversion of Single Photons Emitted by an InAs Quantum Dot. Phys. Rev. Lett. 109, 147405 (2012).
- [20] Rakher, M.T., Ma, L., Slattery, O., Tang, X. & Srinivasan, K. Quantum transduction of telecommunications-band single photons from a quantum dot by frequency upconversion. Nat. Phot. 4, 786–791 (2010).
- [21] Tanzilli, S. et al. A photonic quantum information interface. Nature 437, 116–120 (2005).
- [22] Ikuta, R. et al. Wide–band quantum interface for visible–to–telecommunication wavelength conversion. Nat. Commun. 2, 1544 (2011).
- [23] Zhou, Z.-Y. et al. Orbital Angular Momentum-Entanglement Frequency Transducer. Phys. Rev. Lett. 117, 103601 (2016).
- [24] Ramelow, S., Fedrizzi, A., Poppe, A., Langford, N. K. & Zeilinger, A. Polarization–entanglement–conserving frequency conversion of photons. Phys. Rev. A 85, 013845 (2012).
- [25] Kambs, B. et al. Low-noise quantum frequency down-conversion of indistinguishable photons. Opt. Express 24, 22250-22260 (2016).
- [26] Yu, L. et al. Two–photon interference at telecom wavelengths for time–bin–encoded single photons from quantum–dot spin qubits. Nat. Commun 6, 8955 (2015).
- [27] Farrera, P., Maring, N., Albrecht, B., Heinze, G. & de Riedmatten, H. Nonclassical correlations between a C–band telecom photon and a stored spin–wave. Optica 3, 1019–1024 (2016).
- [28] Ikuta, R. et al. Heralded single excitation of atomic ensemble via solid–state-based telecom photon detection. Optica 3, 1279–1284 (2016).
- [29] Albota, M. A., Wong, F. N. C. & Shapiro, J. H. Polarization–independent frequency conversion for quantum optical communication. J. Opt. Soc. Am. B 23, 918–924 (2006).
- [30] Krutyanskiy, V., Meraner, M., Schupp, J. & Lanyon, B. P. Polarisation-preserving photon frequency conversion from a trapped-ion-compatible wavelength to the telecom C-band. Appl. Phys. B 123:228 (2017).
- [31] Kurz, C. et al. Experimental protocol for high-fidelity heralded photon-to-atom quantum state transfer. Nat. Commun. 5, 5527 (2014).
- [32] Kurz, C., Eich, P., Schug, M., Müller, P. & Eschner, J. Programmable atom-photon quantum interface. Phys. Rev. A 93, 062348 (2016).
- [33] Ruster, T. et al. A long-lived Zeeman trapped-ion qubit. Appl. Phys. B 122:254 (2016).
- [34] Wang, Y. et al. Single-qubit quantum memory exceeding ten-minute coherence time. Nat. Phot. 11, 646–650 (2017).
- [35] Ballance, C. J., Harty, T. P., Linke, N. M., Sepiol, M. A. & Lucas, D. M. High-Fidelity Quantum Logic Gates Using Trapped-Ion Hyperfine Qubits. Phys. Rev. Lett. 117, 060504 (2016).
- [36] Gaebler, J. P. et al. High-Fidelity Universal Gate Set for 9Be+ Ion Qubits. Phys. Rev. Lett. 117, 060505 (2016).
- [37] Schug, M. et al. Quantum interference in the absorption and emission of single photons by a single ion. Phys. Rev. A 90, 023829 (2014).
- [38] Hucul, D. et al. Modular entanglement of atomic qubits using photons and phonons. Nat. Phys. 11, 37-42 (2015).
- [39] Zaske, S., Lenhard, A., & Becher, C. Efficient frequency downconversion at the single photon level from the red spectral range to the telecommunications C-band. Opt. Express 19, 12825-12836 (2011).
- [40] Chuang, I. L., & Nielsen, M. A. Prescription for experimental determination of the dynamics of a quantum black box. J. Mod. Opt. 44, 2455-2467 (1997).
- [41] Schuck, C., Pernice, W. H. P., & Tang, H. X. Waveguide integrated low noise NbTiN nanowire single-photon detectors with milli-Hz dark count rate. Scientific Rep. 3, 1893 (2013).
- [42] Mahring, N. et al. Photonic quantum state transfer between a cold atomic gas and a crystal. Nature 551, 485-488 (2017).
- [43] Ikuta, R. et al. Polarization insensitive frequency conversion for an atom-photon entanglement distribution via a telecom network. Preprint at https://arxiv.org/abs/1710.09150 (2017)
- [44] Lenhard, A., Brito, J., Bock, M., Becher, C., & Eschner, J. Coherence and entanglement preservation of frequency-converted heralded single photons. Opt. Express 10, 11187-11199 (2017).
Supplementary information: High-fidelity entanglement between a trapped ion and a telecom photon via quantum frequency conversion, Bock et al.
Supplementary Note 1
Experimental sequence for entanglement generation and atomic state analysis
The experimental sequence, depicted in Supplementary Figure 5, starts with 8 µs of Doppler cooling on the transition, including repumping of population from the manifold back to the ground state, resulting in a mixture between the and Zeeman sublevels of . As shown in Supplementary Figure 5a, a laser pulse at 393 nm of 3 µs duration excites the ion to , where the polarization and geometry of the pulse are adjusted to drive solely the atomic transition. Subsequent decay into the metastable manifold creates a mixture of entangled atom-photon states
| (2) |
and
| (3) |
where the imbalance in the amplitudes originates from unequal Clebsch-Gordan coefficients for the respective decay channels. Potential decay to via the emission of a photon at 850 nm is detected as false positive events and thus eliminated in a later step.
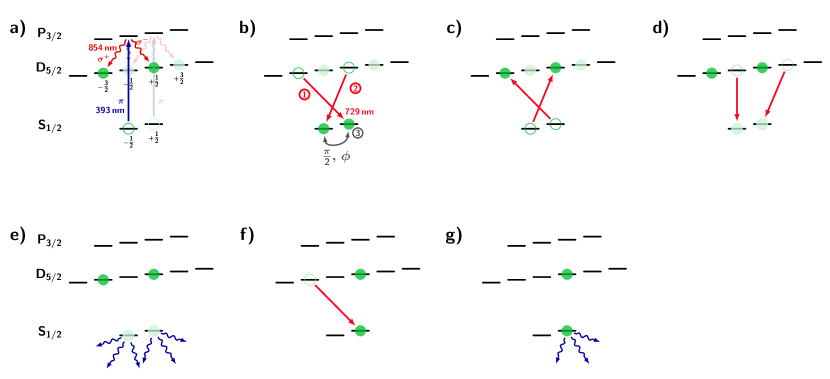
As shown in Supplementary Figure 5b, conditioned on the detection of an 854 nm photon, optional state rotation for the atomic state analysis is carried out by two 729 nm pulses (50 µs each) that coherently transfer the , superposition into , followed by a radio-frequency (RF) pulse (5 µs), resonant on the transition, which translates the superposition phase into population of . After shelving the population back to (Supplementary Figure 5c), the undesired superposition , is projected out by transferring the latter to and eliminating these cases by means of fluorescence detection (200 µs) where ”bright” events are omitted (Supplementary Figure 5d/e). In the course of the fluorescence detection, erroneous 850 nm-photon–detection events are eliminated likewise, as population in leads to fluorescence when the cooling lasers (397 nm and 866 nm) are switched on. State detection of the remaining populations is conducted by two further 729 nm pulses coupling and to with a fluorescence detection after each pulse (Supplementary Figure 5f/g).
The generation sequence takes 11 µs (8 µs for cooling and 3 µs for generation), which yields a maximum achievable sequence rate of about 90.9 kHz. However, due to the atomic state analysis, triggered upon a photon detection event, the rate is reduced to about 58 kHz on average.
Supplementary Note 2
Detailed setup of the quantum frequency converter
A detailed drawing of the converter, which contains all optical elements and the complete setup for the path length stabilization, is shown in Supplementary Figure 6.
Supplementary Note 3
External conversion efficiency
We define the external efficiency as the ratio between 1310 nm photons leaving the output fiber of the converter (see blue output arrow in Supplementary Figure 6) and 854nm photons entering the input fiber of the converter (red input arrow in Supplementary Figure 6). Hence it includes the internal conversion efficiency and all transmission and filtering losses between these two fibers, as will be explained in more detail below. We can also interpret the external efficiency as a device efficiency of the QFC when it is applied as a component of a quantum network. Due to the asymmetry of the setup, the individual efficiencies and losses are different in the interferometer arms, which makes a separate consideration of both arms reasonable. All losses and efficiencies were measured individually using the 854 nm alignment laser and the converted signal thereof.
The external conversion efficiency of the H-polarized arm (the arm containing the half wave plates) is composed of the following individual efficiencies:
| (4) |
denotes the coupling efficiency of the input field at 854 nm to the waveguide of 79.7%. This value is limited by the non-optimal overlap between the Gaussian mode of the input light and the astigmatic mode of the waveguide. An improvement might be achieved with cylindrical lenses, which is in our case not possible due to limited space in the 854 nm beam path. The internal conversion efficiency is defined as the amount of input light which is converted inside the waveguide including losses in the waveguide but excluding losses outside. Not that the internal efficiency is not identical to the signal depletion, which does not take into account losses in the waveguide. We measure an internal efficiency of 96.6% limited by the spatial mode overlap of input, pump and output field. The joint transmission of the dichroic mirrors (each beam has to pass three of them) is = 81.6%. This rather poor transmission is explained by the non-standard angles of incidence, which are outside the specification of the mirror coatings (the dichroic mirrors are specified for 45∘ angle of incidence). Further transmission losses arise from the spectral filters, namely the band-pass filter with = 97.1% and the fiber Bragg grating with = 69.5%. The coupling to the single-mode fiber = 82% is again limited by a non-perfect mode-matching. All losses in the remaining optical elements (lenses for fiber-coupling, ZnSe-lenses, polarizing beam splitters, 99:1 beam splitters for stabilization, spherical lenses for mode matching) are combined in = 82.5%. Due to a higher external efficiency of this arm, it was necessary to decrease the efficiency on purpose with the second HWP to ensure an equal conversion efficiency for both polarization components. This is represented by the asymmetry-correction factor = 92.4%.
We calculate the external conversion efficiency of the V-polarized arm similarly:
| (5) |
with the waveguide coupling efficiency = 78.2%, the internal conversion efficiency = 89.6%, the transmission through the dichroic mirrors = 86.6%, the spectral filter transmission = 97.1% and = 69.3%, the fiber-coupling = 77.8% and = 83.8%. Apart from small differences in the coupling efficiencies and the losses in all optical elements, a reduced internal efficiency is observed. This is caused by the lack of pump power in the second pass through the waveguide.
Potential improvements to boost the external conversion efficiency are waveguides with a quadratic cross-section yielding a higher overlap with Gaussian modes; a pump source with higher output powers 2 W enabling pumping from both sides, which should remove the remaining asymmetries; dichroic mirrors with coatings designed for the given wavelength combination, polarization and angles of incidence which increase the transmission above 90% and volume Bragg gratings with efficiencies around 95% replacing the fiber Bragg grating. With these improvements, overall efficiencies around 50% are within reach.
Supplementary Note 4
Entanglement generation rate
Measurement without frequency conversion
In this section, the values for the entangled-state generation rate given in the main text are calculated. In the measurement without the frequency conversion, 114,200 events were detected in 4,132 s. Note that only the signal events excluding the APD dark counts are considered for the generation rate. The detection time window is 300 ns corresponding to 65% of the photon wavepacket. Thus we get for the detected entanglement rate after projection
| (6) |
The generated rate is calculated to
| (7) |
with the transmission of the polarizer = 78%, the quantum efficiency of the APD = 30% and an additional factor = 50% as the emitted photons are partially unpolarized, resulting in the absorption of half of the photons on average by the polarizer.
As a check for consistency we calculate the theoretical rate we expect from the sequence repetition rate and the losses/efficiencies between the ion trap and the projection setup. With the repetition rate 58 kHz the generated rate is
| (8) |
with the collection efficiency of the HALO = 3.6% and the fiber coupling efficiency 39%. Furthermore three additional factors have to be taken into account. As explained in Supplementary Note 1, the state preparation creates a statistical mixture of two superpositions in the -manifold, thus half of the photons arise from a decay to the unwanted superposition. The factor = 50% takes into account this effect. Moreover, a decay to the -state results in the emission of a photon at 850 nm, which is also collected. With the Einstein coefficients of the transitions at 854 nm and 850 nm (A = 1.35 MHz and A = 0.152 MHz, respectively) the correction factor is = = 89.9%. Finally, = 65% takes into account that only a part of the photon wavepacket is considered. Thus, the theoretically expected rate is in very good agreement with the measured rate.
Measurement with frequency conversion
The detected entanglement generation rate including the frequency converter is computed in an analogue way. Note that we utilized two single-photon detectors for the telecom photon detection instead of a single APD for the unconverted photon detection. With 193,120 events detected in 7,779 s we get
| (9) |
The generated entanglement rate for the converted photons is
| (10) |
with the transmission of the tomography setup = 86.5% and the quantum efficiencies of the SSPDs = 70(2)% and = 62(2)%.
Again as a consistency check, we calculate the expected rate with the losses and efficiencies in the telecom setup measured with a laser. For the overall transmission efficiency we get
| (11) |
with the transmission of the fiber between the labs (includes the coupling to the fiber and the fiber-fiber coupling to the converter) = 75.8%, the external conversion efficiency = 26.5(2)% and the duty cycle of the path-length stabilization = 87.5%. With a sequence repetition rate of 61.7 kHz (the rate is slightly increased as the atomic state analysis is performed less often caused by a lower photon count rate) the expected generated rate is
| (12) |
which is again consistent with the measured number. A further interesting quantity, which is important for the following SBR calculation, is the ratio of the probabilities to project and detect a photon at 854 nm and at 1310 nm:
| (13) |
Compared to this value is clearly higher caused by the higher quantum efficiencies of the SSPDs. Note that for the measurement including the projection to the Bell state all numbers have to be multiplied by a factor 2/3 as losses were introduced to compensate the different CGC.
Supplementary Note 5
Signal-to-background ratio
Without the frequency converter we achieve a signal-to-background ratio defined as the total number of signal events (S = 114,200 in 4,132 s inside a 300 ns window) divided by the total number of background events (BG = 3,868) of 29.5. The background in this case is solely determined by the APD dark counts, which is clearly visible if we calculate the expected background yielding
| (14) |
which is in good agreement with the measured background. denotes the APD dark-count rate of 117.7 photons/s.
A similar result is obtained for the case including the frequency conversion. The number of signal events (S = 193,120 in 7,779 s inside a 300 ns window) and background events (BG = 7,953) yields a SBR of 24.3. Here the background has two contributions; a major part are the SSPD dark counts (on average 93.5%) and a minor part the conversion-induced noise of 11.4 photons/s (on average 6.5%):
| (15) |
| (16) |
A similar calculation reveals that these dark counts determine the total background:
| (17) |
As a conclusion, inserting the frequency converter lowers the SBR from 29.5 to 24.3. Although we detect only 43% of the photons at 1310 nm, the SBR is not reduced by this factor as the background is also reduced by a factor 0.52, compensating the losses partially. Nevertheless, further improvements of the SBR are reasonable to distribute entanglement over distances of several hundreds of kilometers. On the one hand, the conversion-induced noise can be reduced by spectral filters with smaller bandwidths. Commercial fiber Bragg gratings offer bandwidths down to 1 GHz without a significant decrease in transmission (Ultra narrow-band filter, Advanced optical solutions GmbH), which already increases the SBR by a factor 25 assuming that the noise is equally distributed around the target wavelength. The fundamental limit is the photon bandwidth of 23 MHz, but in this regime a tradeoff between filter transmission and filter bandwidth has to be accepted. On the detector side, recent progress in the development of NbTiN-based superconducting detectors with milli-Hertz dark count rates [1] are very promising to further increase the SBR about two orders of magnitude compared to our results.
Supplementary Note 6
State reconstruction
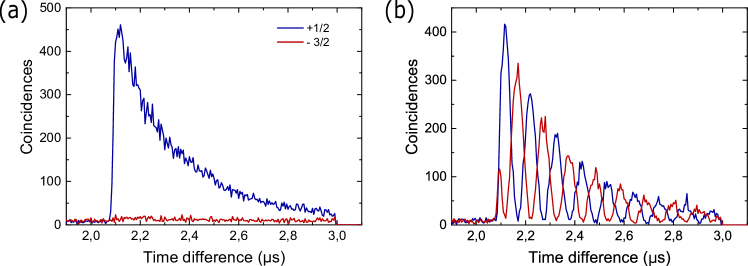
The state reconstruction is adapted from [2, 3, 4]. We start with the coincidences between photon-detection events and bright events from the atomic state analysis measured in all 36 combinations of projections to the eigenstates of the Pauli operators . Supplementary Figure 7a shows an example for the measurement in the eigenbasis where the 1310 nm photon is projected to and the ion to (red curve) and (blue curve), respectively. One measurement in the superposition basis is shown in Supplementary Figure 7b (photon projected to ). The oscillation is related to the Larmor precession of the phase of the atomic superposition in the -manifold. As the time difference between the start of the excitation pulse at 393 nm and the atomic state analysis is constant for each sequence repetition, the phase of the atomic superposition depends on the photon’s detection time, i.e. the time at which the atom-photon entanglement is established.
From the 36 measurements we calculate the normalized joint expectation values in the Pauli base . This calculation is straightforward for the eigenbases, where we extract solely the number of coincidences (summed up in the 300 ns window) from the curves shown above. In the case of the projection to the atomic superpositions, the expectation values are determined by the phase and visibility of the Larmor fringes, which we obtain via a fit of the data. With the we get for the density matrix
| (18) |
To ensure that the density matrix is physical, a maximum-likelihood estimation [4] is performed afterwards with the linear reconstructed matrix as initial guess. This final density matrix is utitlized to calculate the fidelities and purities stated in the main text and the next section. The error bars of the latter are derived via a finite difference-quotient method assuming a Poissonian distribution of the detection events.
Supplementary Note 7
Complete list of fidelities and purities
As mentioned in the main text, background subtraction was applied to the raw data to demonstrate the functionality of our method. To perform this background subtraction, we reconstructed the density matrix as described in In Supplementary Note 6 from a modified raw data set. At first, we determine for each basis combination the average number of dark coincidences per time-bin. In Supplementary Figure 7a, for instance, this is done by integrating the number of coincidences outside the photon wavepacket (from 0µs to 2µs) and dividing it by the number of time-bins. This approach is justified in our experiment as we generate triggered single photons within a specified time window; thus, contrary to a photon-pair source, e.g. based on parametric conversion with random emission times, coincidences outside the photon wavepacket originate solely from detector dark-counts. Now, we assume a Poissonian distribution for the dark coincidences (this is feasible as conversion-induced noise as well as detector dark counts occur independently) with the average number of dark coincidences as expectation value. With the distribution of the dark coincidences and the total number of coincidences, we calculate the distribution of the true signal coincidences, yielding expectation value and variance of the latter. From this point, we proceed as described in Supplementary Note 6. This statistical approach is necessary on the one hand to get a proper error estimation and on the other hand to avoid negative values for the number of coincidences in some time-bins.
The following tables summarize again all fidelities and purities with and without subtraction of the background (denoted in the tables as ”Total BG subt.”’ and ”W/o BG subt.”’, respectively). In the measurements with the frequency converter, 93.5% of the background originates from the detectors and 6.5% from conversion-induced noise. Thus it is of interest to quantify solely the converter’s influence on the state by subtracting only 93.5% of the background (in this case we multiply the average number of dark coincidences per bin with 0.935). This is denoted in the tables as ”Detector DC subt.”
| Measurement | Total BG subt. | Detector DC subt. | W/o BG subt. |
|---|---|---|---|
| W/o conversion | 98.3 0.3 % | – | 95.9 0.3 % |
| With conversion | 97.7 0.2 % | 97.3 0.2 % | 94.8 0.2 % |
| Measurement | Total BG subt. | Detector DC subt. | W/o BG subt. |
|---|---|---|---|
| W/o conversion | 95.5 0.3 % | – | 93.3 0.3 % |
| With conversion | 94.8 0.2 % | 94.5 0.2 % | 92.2 0.2 % |
| With conv. & state carving | 98.2 0.2 % | 97.7 0.2 % | 93.4 0.2 % |
| Measurement | Total BG subt. | Detector DC subt. | W/o BG subt. |
|---|---|---|---|
| W/o conversion | 96.7 1.6 % | – | 92.1 1.6 % |
| With conversion | 95.8 1.3 % | 95.1 1.3 % | 90.3 1.2 % |
| With conv. & state carving | 96.7 1.4 % | 95.8 1.4 % | 87.8 1.3 % |
Supplementary References
- [1] Schuck, C., Pernice, W. H. P., & Tang, H. X. Waveguide integrated low noise NbTiN nanowire single-photon detectors with milli-Hz dark count rate. Scientific Rep. 3, 1893 (2013).
- [2] Kurz, C. et al. Experimental protocol for high-fidelity heralded photon-to-atom quantum state transfer. Nat. Commun. 5, 5527 (2014).
- [3] Kurz, C., Eich, P., Schug, M., Müller, P. & Eschner, J. Programmable atom-photon quantum interface. Phys. Rev. A 93, 062348 (2016).
- [4] James, D. F. V., Kwiat, P. G., Munro, W. J. & White, A. G. Measurement of qubits. Phys. Rev. A 64, 052312 (2001).